Sales Pipeline Analysis: Benchmarks, Formulas, and Frameworks That Actually Tell You What's Wrong
It's Monday morning. The board wants a forecast update by noon. Your VP of Sales pulls up the pipeline report and starts eyeballing deal stages, mentally adjusting numbers based on gut feel. The forecast lands at 46% accuracy - which, depressingly, is about average. 67% of companies don't even have a formalized forecasting process. The pipeline data exists. The analysis doesn't.
That's the gap we're closing here. Not another vocabulary lesson on what a pipeline is - a diagnostic framework with real benchmarks, segmented by company type, so you can figure out what's broken and where.
What Pipeline Analysis Is (And Isn't)
Sales pipeline analysis is the practice of measuring how deals move through your sales process - where they advance, where they stall, and where they die. Most teams think they're doing it. They're not. They're running status updates and calling it analysis.
The difference matters. A status update tells you "we have $2.3M in pipeline." Proper analysis tells you "our SQL-to-opportunity conversion dropped 8 points this month, concentrated in the mid-market segment, and 62% of deals past their expected close date haven't had activity in two weeks." One is a number. The other is a diagnosis.
Two blockers prevent real analysis in most RevOps orgs: inconsistent stage definitions across reps and CRM data so stale it's essentially fiction. Fix those two things and every framework below starts producing useful output.
The Only Three Metrics You Need First
Track only three metrics:
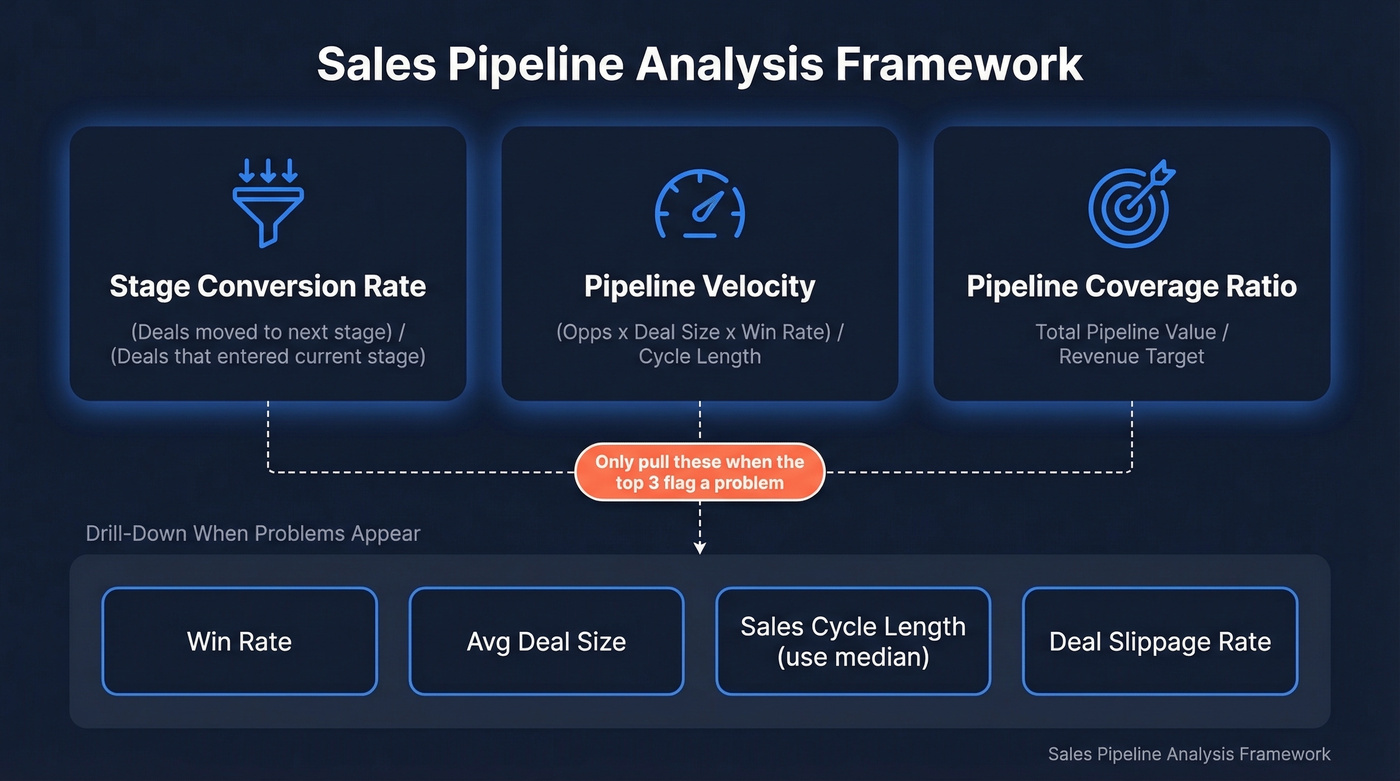
- Stage-by-stage conversion rates (where deals die)
- Pipeline velocity (how fast revenue moves through)
- Pipeline coverage ratio (whether you have enough to hit target)
Segment all three by your company type. Everything else is a drill-down you run when those three signal a problem. And none of it matters if your CRM data is stale - 91% of CRM data is incomplete, and 70% goes stale annually. Start with a data audit before you trust any number coming out of your pipeline.
Core Metrics and Supporting Indicators
Here's the thing: most guides hand you a list of 11 metrics and tell you to track all of them. That's how you end up with dashboards nobody looks at.
The Core Three
Stage conversion rate tells you where deals die. The formula is simple: (deals that moved to next stage) / (deals that entered current stage). Calculate this for every stage transition, every month. The biggest drop-off in most B2B funnels is MQL-to-SQL at roughly 15% conversion. If you're not measuring this transition specifically, you're missing your largest leak.
Pipeline velocity tells you how fast money moves. The formula: (Number of Opportunities x Average Deal Size x Win Rate) / Sales Cycle Length. This is a system metric - it captures volume, value, effectiveness, and speed in one number. We'll walk through a worked example below.
Pipeline coverage ratio tells you whether you have enough pipeline to hit target. Formula: Total Pipeline Value / Revenue Target. A 3x ratio means you need $3 in pipeline for every $1 of quota. But the "right" ratio depends entirely on your segment and win rate.
The Supporting Four
Pull these out when the core three flag a problem:
- Win rate - overall closed-won / total opportunities. Useful for trending, dangerous as a standalone metric.
- Average deal size - watch for compression over time, which signals discounting problems.
- Sales cycle length - measure median, not mean. A few whale deals will skew the average badly.
- Deal slippage rate - percentage of deals that push past their expected close date. This is your forecast killer.
Stop building dashboards with 15 charts. Three numbers, four drill-downs.
Benchmarks by Company Type
Generic benchmarks are useless. "A good win rate is 20-30%" means nothing if you're selling six-figure enterprise deals versus $5k SMB contracts.
Stage Conversion by Industry
These benchmarks come from First Page Sage's analysis of conversion data collected from 2017-2025 across a majority-B2B client mix:
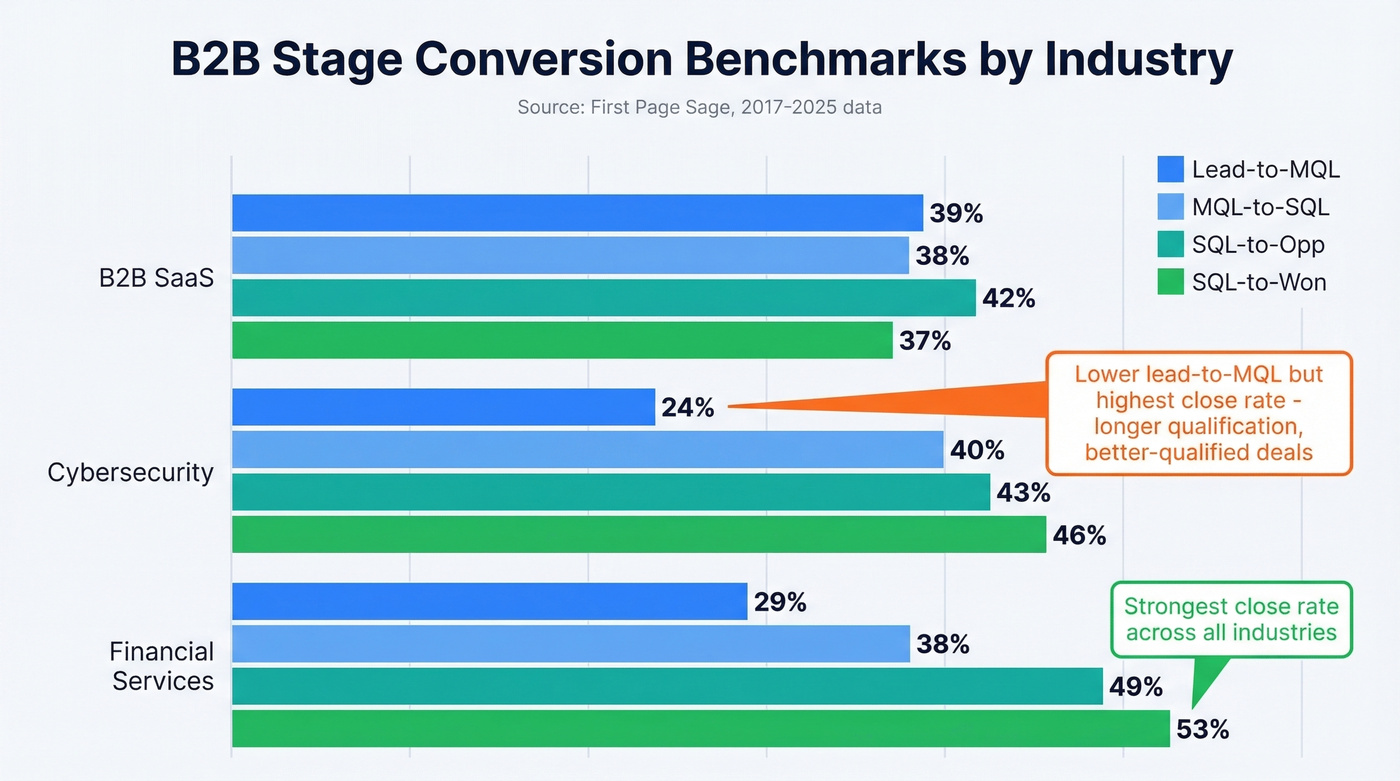
| Industry | Lead-to-MQL | MQL-to-SQL | SQL-to-Opp | SQL-to-Won |
|---|---|---|---|---|
| B2B SaaS | 39% | 38% | 42% | 37% |
| Cybersecurity | 24% | 40% | 43% | 46% |
| Financial Svcs | 29% | 38% | 49% | 53% |
Notice how cybersecurity has a much lower lead-to-MQL rate but a higher SQL-to-close rate. That's a longer qualification cycle with better-qualified deals making it through. If your cybersecurity pipeline converts leads to MQLs at 40%, you're probably letting unqualified leads through.
Coverage Ratio by Segment
| Segment | Target Coverage |
|---|---|
| Early-stage SaaS | 4-6x |
| Growth-stage SaaS | 3-4x |
| Mature SaaS | 2-3x |
| Enterprise B2B | 3-5x |
| SMB / Mid-market | 2-4x |
Per Count.co's coverage ratio benchmarks, early-stage companies need higher coverage because their win rates are still volatile and their sales process isn't proven yet.
Win Rate by Deal Size
| Segment | Win Rate | Target Coverage |
|---|---|---|
| Enterprise (1,000+) | 20-25% | 3-5x |
| Mid-market (100-999) | 25-35% | 2.5-4x |
| SMB (<100) | 30-40% | 2-3x |
Let's be honest: saying a "50%+ win rate is good" is misleading for enterprise teams where 20-25% is perfectly normal. If your enterprise reps are closing 40% of deals, they're either exceptional or your pipeline is too narrow - you're only pursuing sure things and leaving revenue on the table.
91% of CRM data is incomplete and 70% goes stale annually - which means your pipeline analysis is built on fiction. Prospeo refreshes 300M+ profiles every 7 days (not the 6-week industry average) and delivers 98% email accuracy. Clean data in, accurate pipeline metrics out.
Stop analyzing a pipeline full of dead contacts. Start with data you can trust.
Pipeline Velocity - A Worked Example
Sales velocity and pipeline velocity are used interchangeably in practice. Don't let anyone tell you they're different concepts.
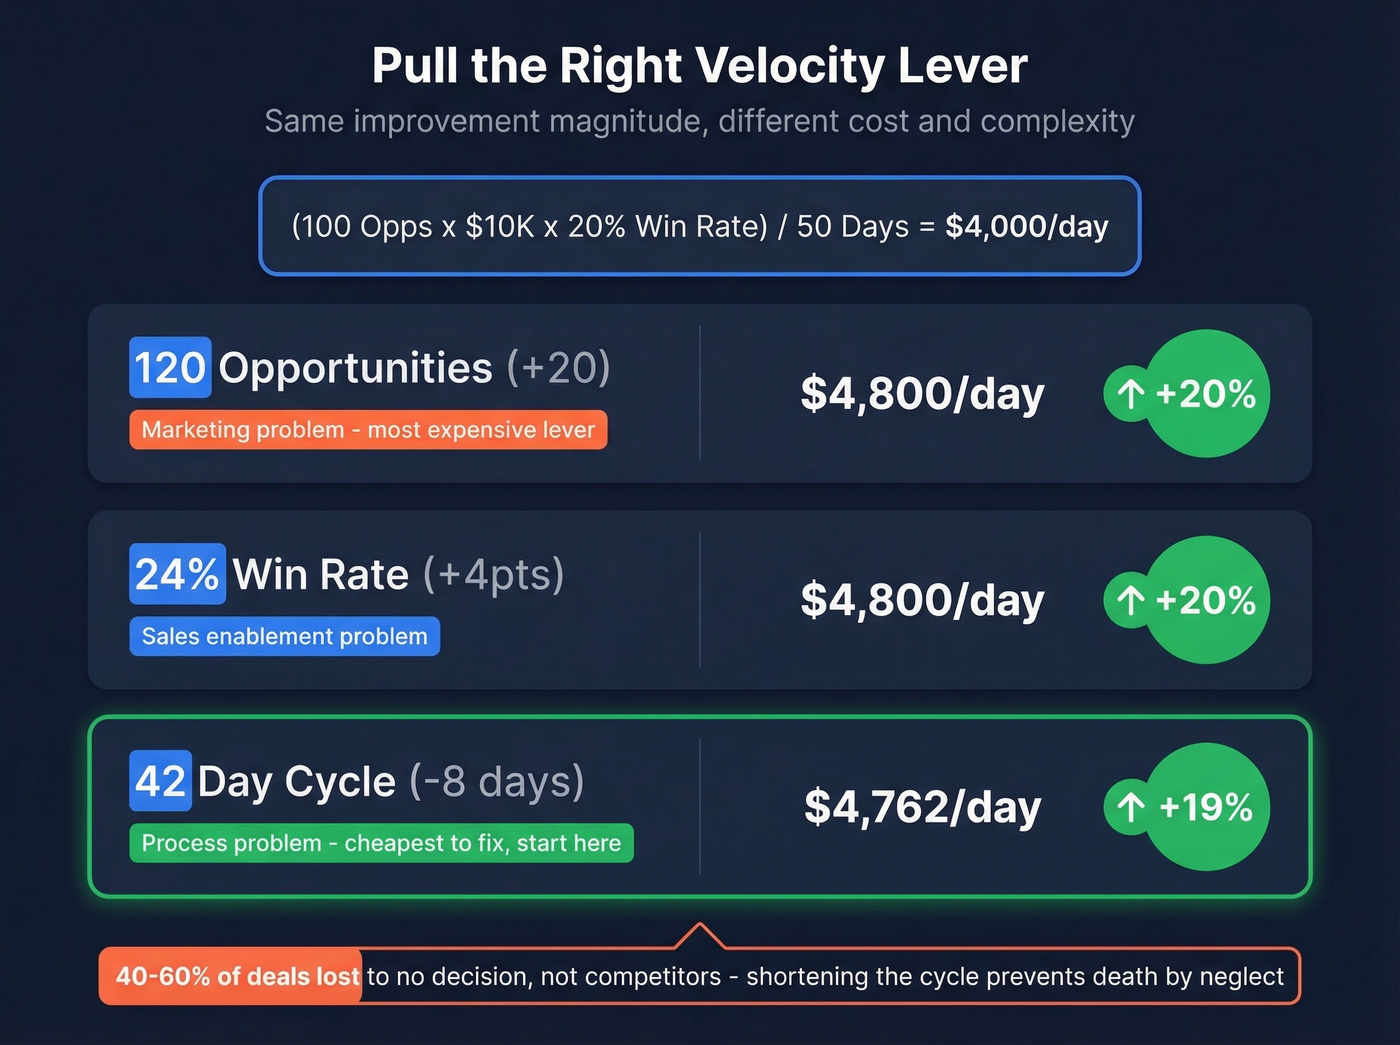
Say you have 100 opportunities in pipeline, $10,000 average deal size, 20% win rate, and a 50-day average sales cycle.
Velocity = (100 x $10,000 x 0.20) / 50 = $4,000/day in expected revenue.
Now here's where it gets interesting. What happens if you improve just one variable by 15-20%?
- Increase opportunities to 120 - velocity jumps to $4,800/day (+20%)
- Raise win rate to 24% - velocity hits $4,800/day (+20%)
- Shorten cycle to 42 days - velocity reaches $4,762/day (+19%)
Same magnitude of improvement, different operational implications. Adding 20 more opportunities is a marketing problem. Improving win rate by 4 points is a sales enablement problem. Cutting 8 days off the cycle is a process problem. Velocity tells you which lever to pull - the one that's cheapest to move.
Most teams default to "generate more pipeline" when velocity drops. That's the most expensive lever. In our experience, shortening the sales cycle by removing internal friction - faster legal reviews, pre-approved discount tiers, better mutual action plans - delivers the same velocity improvement at a fraction of the cost. Start there.
One stat worth internalizing: 40-60% of deals are lost to "no decision", not to competitors. Your biggest competitor is inertia. Shortening the sales cycle isn't about rushing - it's about preventing deals from dying of neglect.
Stage-by-Stage Diagnosis
When conversion drops at a specific stage, the fix depends on where the drop happens. The goal isn't just to flag that something is off - it's to identify the root cause and the team responsible for fixing it.
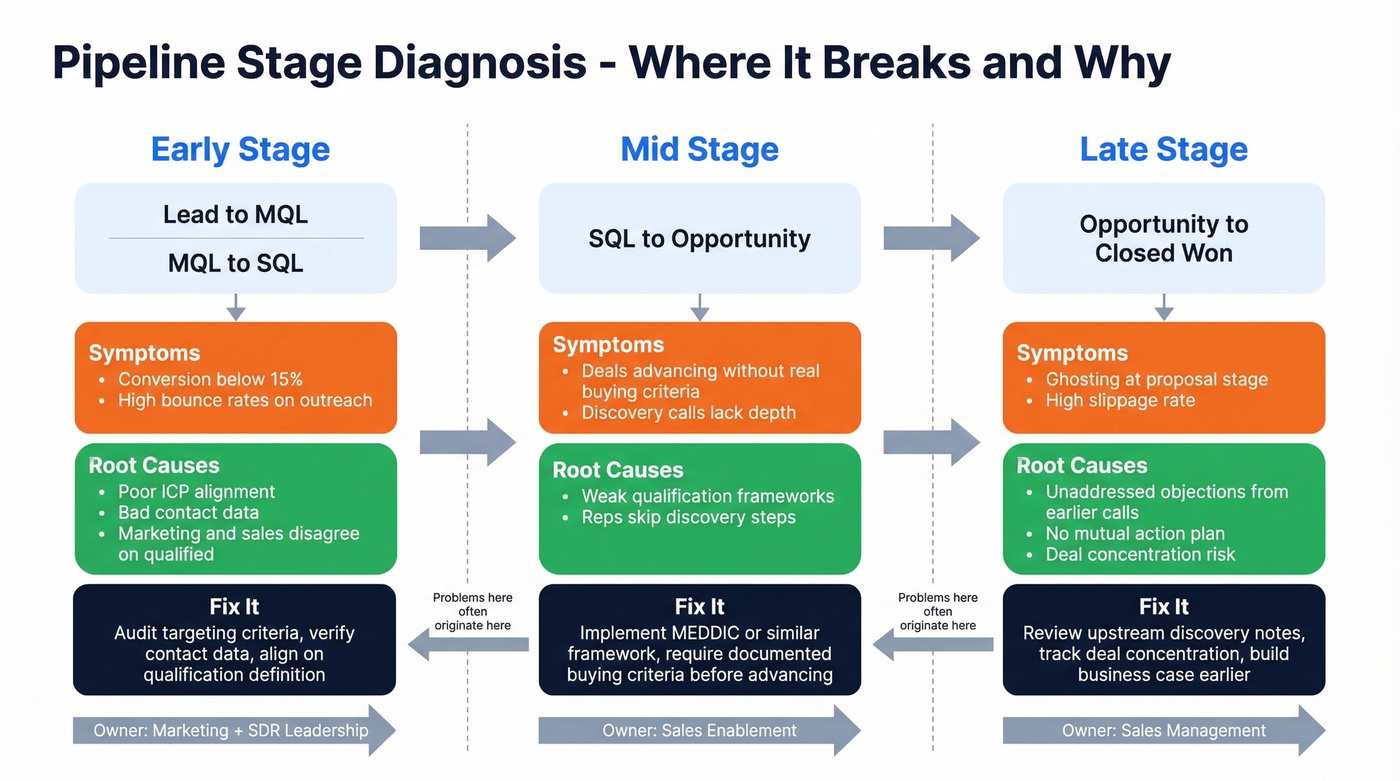
Early-stage drops (Lead-to-MQL, MQL-to-SQL) almost always point to lead quality or ICP alignment issues. If your lead-to-MQL conversion is 15% when the benchmark is 30%+, the problem isn't your SDRs - it's the leads they're working. Check your targeting criteria, your content offers, and whether marketing and sales agree on what "qualified" means.
We've seen teams blame their SDRs for low conversion when the real problem was 30% of their contact data bouncing. Low lead-to-MQL conversion often signals a data quality problem upstream - verify contact data before blaming the pitch.
Mid-stage drops (SQL-to-Opportunity) usually signal discovery and qualification gaps. Reps are advancing deals that shouldn't advance, or they're failing to uncover the real buying criteria. This is where frameworks like MEDDIC earn their keep.
Late-stage drops (Opportunity-to-Closed Won) feel like pricing or competitive losses, but they often originate from earlier discovery failures. The prospect who ghosts you at the proposal stage usually had an unaddressed objection from the second call. Look upstream.
Also check whether your pipeline is concentrated in a few large deals. If 40% of your pipeline value sits in 3 opportunities, your forecast is a coin flip regardless of what your coverage ratio says. Track deal concentration alongside slippage rate - together they explain most forecast misses.
Skip the obsession over "deals lost to competitors." Track deals lost to no decision separately. When 40-60% of your losses are prospects who simply didn't buy from anyone, your pipeline problem isn't competitive - it's about creating urgency and building a compelling business case earlier in the cycle.
Pipeline Reviews That Improve Forecasting
73% of forecast misses trace back to poor pipeline reviews. Most reviews are status updates disguised as strategy sessions - reps narrate what happened last week, managers nod, and nobody leaves with a clear action plan.
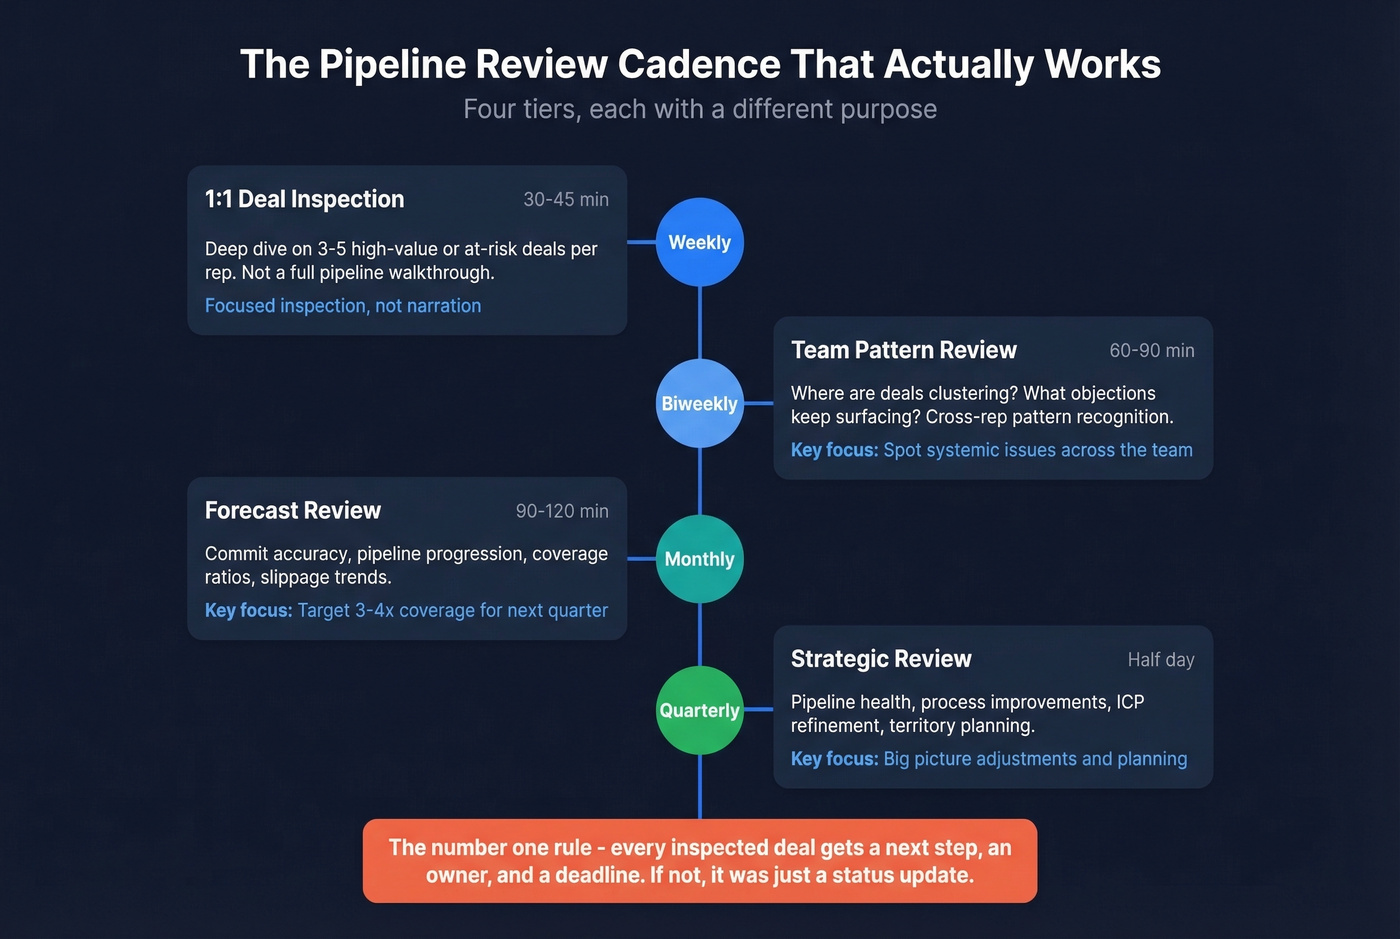
The Four-Tier Cadence
- Weekly 1:1s (30-45 min): Deep dive on 3-5 high-value or at-risk deals per rep. Not a full pipeline walkthrough - focused inspection.
- Biweekly team reviews (60-90 min): Pattern recognition across the team. Where are deals clustering? What objections keep surfacing?
- Monthly forecast reviews (90-120 min): Commit accuracy, pipeline progression vs. last month, coverage ratios, slippage trends. Target 3-4x coverage for next quarter and 90%+ SLA adherence on deal updates.
- Quarterly strategic reviews (half-day): Pipeline health, process improvements, ICP refinement, and territory planning.
Deal Inspection Flow
For every deal you inspect: context, qualification validation, progression evidence, risk assessment, action plan. That last step is non-negotiable. If a review doesn't produce specific next actions with owners and deadlines, it was a status update.
In our experience, the single biggest predictor of forecast accuracy is whether reviews produce documented action items. Teams that enforce "every inspected deal gets a next step, an owner, and a date" consistently forecast within 10% of actual.
Anti-Patterns to Kill
- Gut feel over data. "I think this one's going to close" isn't analysis. What changed since last week?
- No qualification framework. If your team can't articulate MEDDIC or BANT criteria for a deal, the deal isn't qualified - it's a hope.
- Blame culture. If reps hide bad news because reviews feel punitive, your pipeline data is fiction. You're forecasting based on what reps are willing to admit.
Fix Your Data Before Analyzing Anything
Every framework in this article assumes your CRM data is accurate. For most teams, it isn't. 91% of CRM data is incomplete, and 70% goes stale annually. Your Salesforce or HubSpot instance is eroding every week - and so are your conversion rates, velocity calculations, and coverage ratios.
Data Hygiene Cadence
Before any advanced analysis, establish a rhythm: audit CRM data monthly, purge stale opportunities quarterly, and verify contact data continuously. Every open opportunity needs these fields filled, consistently, no exceptions:
- Stage mapped to your buyer's journey, not your internal process
- Expected close date updated weekly, not set-and-forget
- Deal size - even a rough estimate beats blank
- Next step - a specific action, not "follow up"
- Last activity date auto-populated if possible
If you can't trust these five fields across your pipeline, don't bother with advanced analysis. Fix the inputs first.
Where Data Quality Hits Pipeline Hardest
Snyk ran into this exact problem - their outbound bounce rate was 35-40%, which made outbound performance and every pipeline metric downstream far noisier than it should be. After implementing Prospeo for CRM enrichment, bounce rates dropped under 5%, and AE-sourced pipeline increased 180%. That's 50+ AEs generating 200+ new opportunities per month from data that actually reaches inboxes. When 70% of your pipeline data goes stale annually, weekly verification isn't optional - it's the prerequisite for every metric in this guide.
Your velocity formula is only as good as the opportunities feeding it. Teams using Prospeo book 26% more meetings than ZoomInfo users and 35% more than Apollo - because 98% accurate emails and 30% mobile pickup rates mean reps actually reach decision-makers. More real conversations, shorter cycles, higher win rates.
Move every velocity lever at once - starting at $0.01 per verified email.
AI-Powered Pipeline Analysis in 2026
89% of revenue organizations now use AI in some form, up from 34% in 2023. Companies using AI-powered forecasting report 15-20% higher forecast accuracy, 25% shorter sales cycles, and up to 30% improvement in quota attainment.
What AI does differently isn't magic - it's pattern recognition at scale. Instead of a manager eyeballing 50 deals, AI models analyze engagement signals across emails, meetings, and CRM activity to score deal health in real time, surfacing risks and opportunities humans consistently miss because we're bad at tracking dozens of variables simultaneously.
The catch: AI models are only as good as the data feeding them. If your CRM is 91% incomplete, your AI forecast is just a more sophisticated version of gut feel. Clean data in, useful predictions out. Garbage in, confident-sounding garbage out.
FAQ
What's the difference between a sales pipeline and a sales funnel?
A pipeline tracks individual deals through stages - the rep's view. A funnel measures aggregate conversion rates - the manager's view. Pipeline analysis uses both: deal-level inspection for coaching, stage-level metrics for diagnosing systemic problems.
How often should we review our pipeline?
Weekly 1:1s for deal inspection, biweekly team reviews for patterns, monthly forecast reviews for accuracy, quarterly strategic reviews for process. Consistency matters more than frequency - pick a rhythm and protect the time.
What's the minimum data needed to start?
Stage, expected close date, deal size, and last activity date for every open opportunity. With those four fields consistently filled, you can calculate conversion rates, velocity, and coverage - the three metrics that form the backbone of any useful sales pipeline analysis. If bounce rates exceed 10%, enrich your CRM first before trusting downstream metrics.
How do pipeline insights differ from raw reporting?
Raw reports show deal counts, revenue totals, and stage distribution. Insights explain why numbers moved and what to do about it. The shift requires segmenting data by rep, deal size, source, and stage, then comparing against benchmarks to spot deviations worth investigating. Teams averaging 46% forecast accuracy typically lack this segmentation layer.