How to Build a Sales Pipeline Report That Doesn't Lie to You
It's the last week of the quarter. Your CRM says you're sitting on 3.2x pipeline coverage - healthy by any textbook standard. Then you weight it by stage probability and the number drops to 1.4x. Half your "pipeline" is Stage 1 deals that haven't moved in 60 days. That's not a sales pipeline report. That's a graveyard with optimistic close dates.
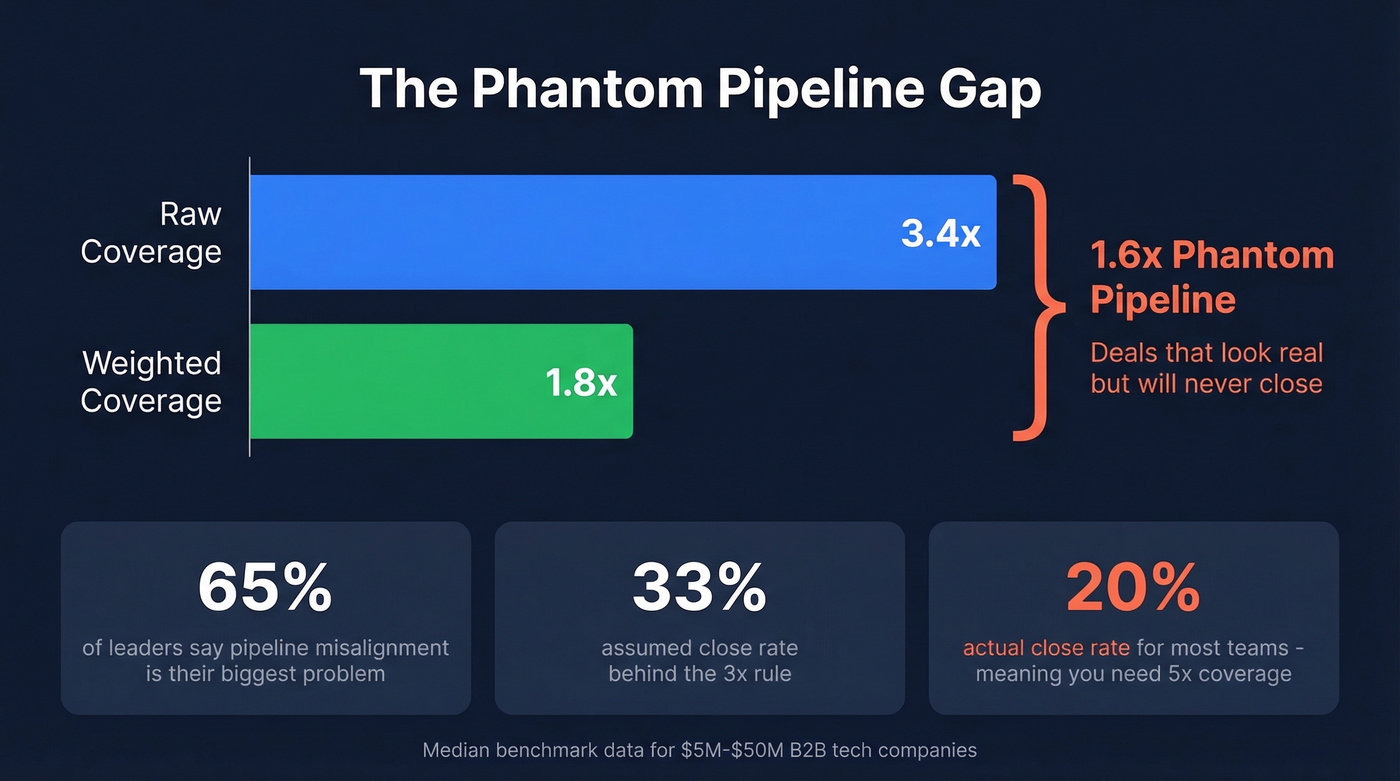
You're not alone. 65% of sales and marketing leaders say leadership misalignment on pipeline data is their biggest operational problem. The fix isn't more dashboards. It's better ones.
Five reports, weighted pipeline coverage, clean upstream data, and 30 minutes. That's what we're covering below - metrics, benchmarks, formulas, and a field-by-field template.
What a Pipeline Report Actually Is
A sales pipeline report is a real-time snapshot of every open deal - where it sits by stage, how much it's worth, and how fast it's moving. It's not a forecast. A forecast projects forward using weighted probabilities; the pipeline report tells you what's true right now.
Confusing the two is how teams end up blindsided at quarter-end.
7 Pipeline Metrics Worth Tracking
The consensus on r/salesops is that there's "one most important pipeline metric." There isn't. Pipeline health is a system, and you need to read it as one. Here are the seven metrics that matter, with formulas and current benchmarks.
| Metric | Formula | Benchmark |
|---|---|---|
| Pipeline coverage (raw) | Open pipeline / quota | 3:1 to 4:1 |
| Weighted coverage | Sum of (deal x stage prob.) / quota | 2.1x or higher |
| Stage conversion rate | Deals entering next stage / deals in current | Lead-MQL 41%, MQL-SQL 39%, SQL-Opp 42%, Opp-Close 39% (SMB/MM) |
| Win rate | Closed-won / total closed | 20-30% |
| Sales velocity | (Opps x deal size x win%) / cycle length | $743-$2,456/day |
| Avg. deal age | Median days from creation to close | 84 days (optimal 46-75) |
| Stalled deal count | No activity > 45 days | Under 25% of pipeline value |
Here's the thing most teams miss: the classic "3x coverage" rule assumes a ~33% close rate. If your actual close rate is 20%, you need 5x raw coverage to hit plan, and most teams don't have it. For $5M-$50M B2B tech companies, median raw coverage is 3.4x while weighted coverage is only 1.8x. That 1.6x gap is phantom pipeline - deals that look real in your CRM but will never close. If you're only tracking raw coverage, you're lying to your board.

Stage Probability Benchmarks
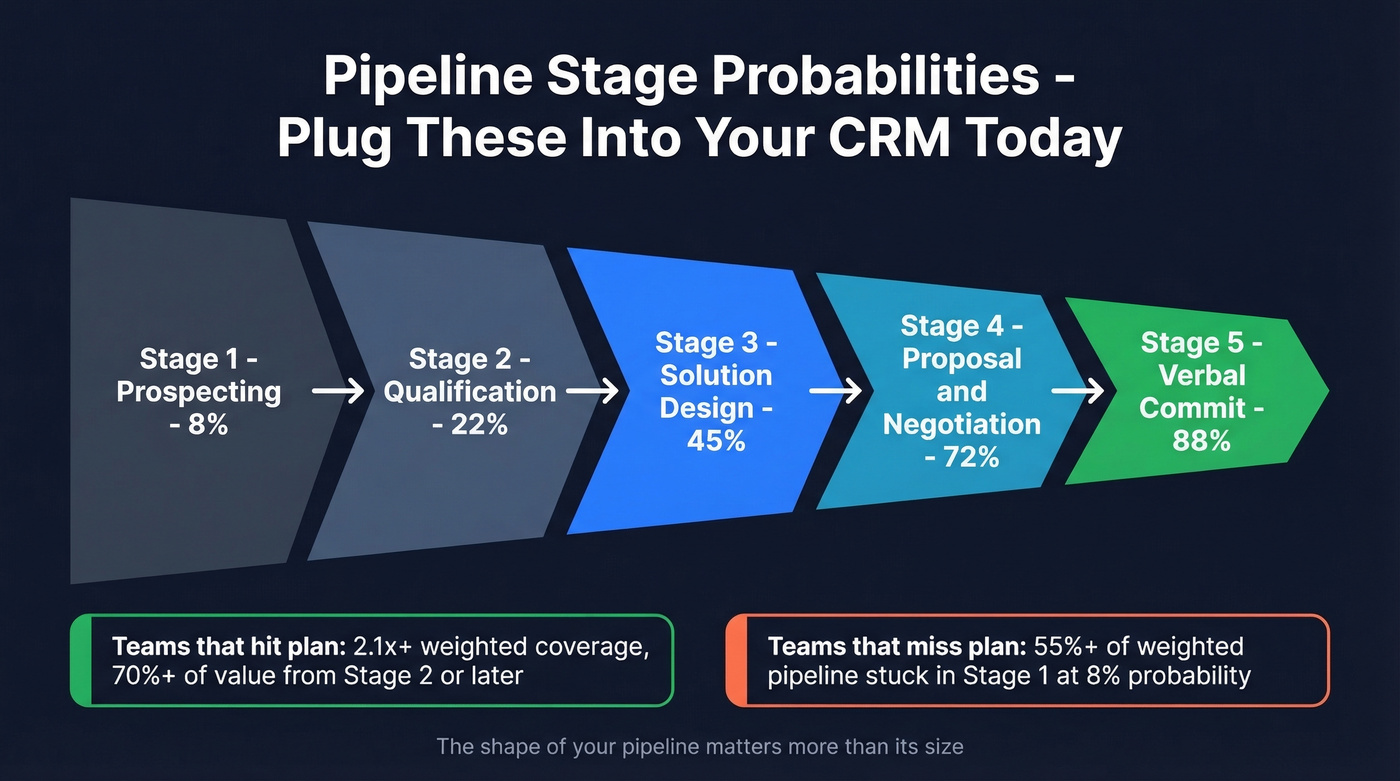
This is the most actionable table in the article. Plug these into your CRM today and your weighted forecast gets instantly more honest.
| Stage | Close Probability |
|---|---|
| Stage 1 - Prospecting | 8% |
| Stage 2 - Qualification | 22% |
| Stage 3 - Solution Design | 45% |
| Stage 4 - Proposal / Negotiation | 72% |
| Stage 5 - Verbal Commit | 88% |
Teams that consistently hit plan show weighted coverage of 2.1x or higher with 70%+ of pipeline value from Stage 2 or later. Teams that miss plan cluster 55%+ of weighted pipeline in Stage 1 at 8% probability. We've seen this pattern repeat across dozens of pipeline reviews - the shape of your pipeline matters more than its size.
Phantom pipeline starts with bad contact data. If 35% of your emails bounce, every stage conversion rate in your report is a lie. Prospeo delivers 98% email accuracy with 7-day data refresh - so the deals in your pipeline are built on contacts who actually exist.
Kill phantom pipeline at the source. Start with verified data.
5 Reports Every Sales Leader Needs
You don't need 15 reports. You need five you actually review weekly. Not all pipelines follow SaaS stages - some teams track bids, awarded contracts, and bid volume by period - but the reporting logic is the same. Here's the set, adapted from Forecastio's framework.
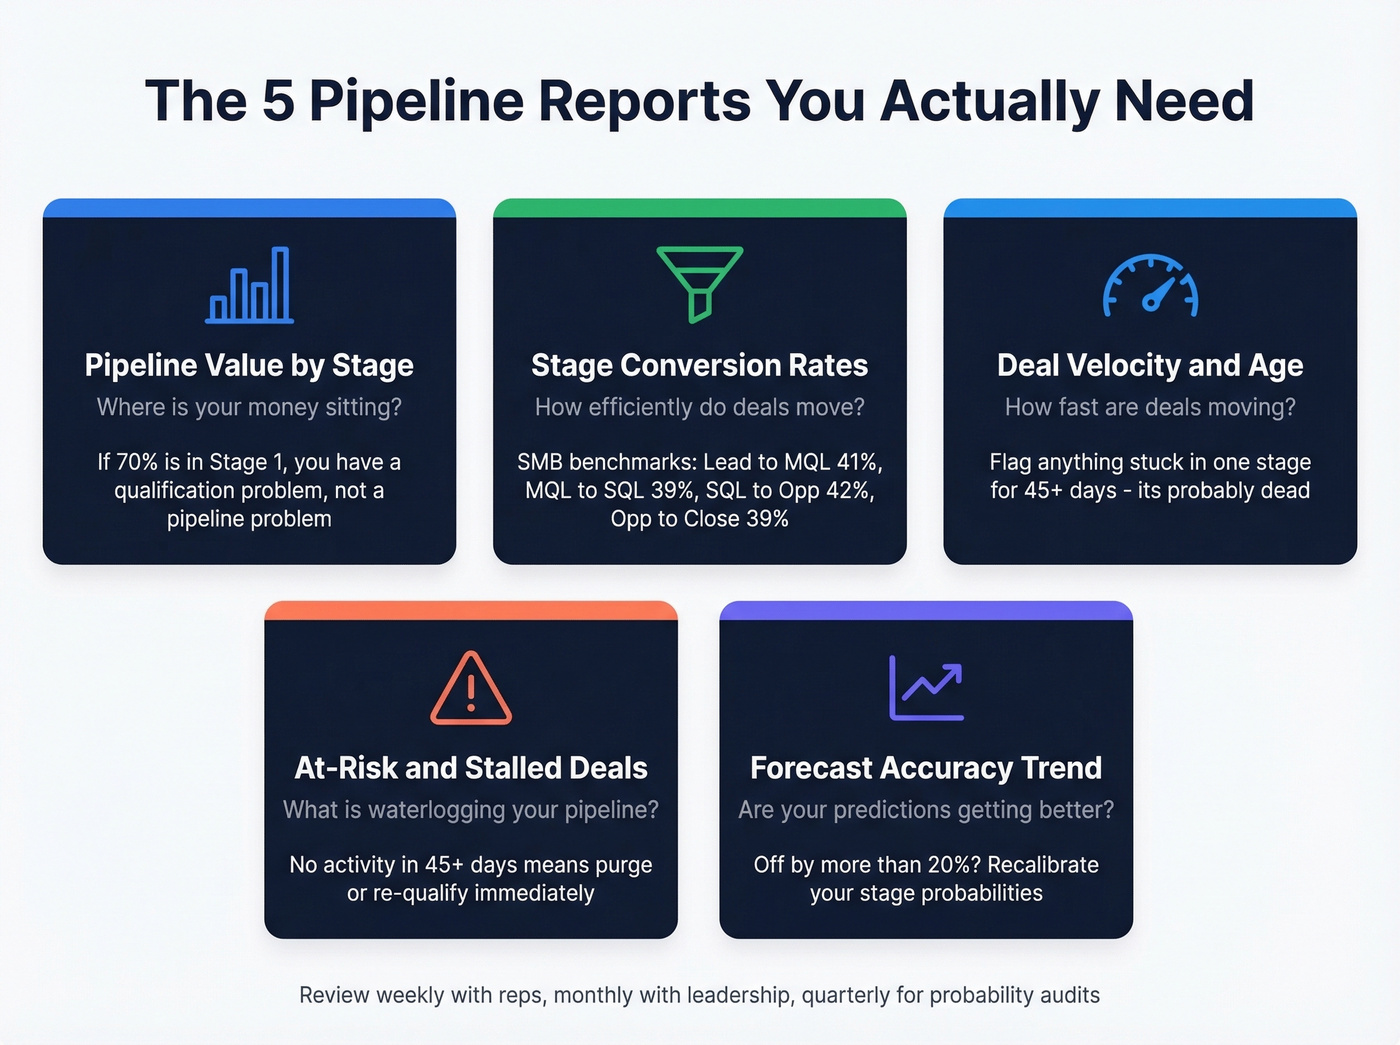
Pipeline Value by Stage
Total dollar value at each stage, broken down by rep or team. If 70% of your pipeline sits in Stage 1, you don't have a pipeline problem. You have a qualification problem.
Stage Conversion Rates
How efficiently deals move between stages. SMB/mid-market benchmarks: Lead-MQL 41%, MQL-SQL 39%, SQL-Opportunity 42%, Opportunity-Close 39%. Enterprise runs lower across the board: 39%, 31%, 36%, 31% respectively. If your SQL-Opportunity rate is half the benchmark, that's where to focus coaching before anything else.
Deal Velocity and Age
Flag any deal stuck in the same stage for more than 45 days. In our experience, that's one of the strongest predictors of teams that consistently miss plan. A deal that stalls at Stage 2 for 60 days isn't "still in play." It's dead and nobody's called time of death.
At-Risk and Stalled Deals
This is often called "waterlogging" - dormant deals inflating your pipeline and distorting forecasts. Build a report surfacing every deal with no logged activity in 45+ days, then purge or re-qualify ruthlessly. A smaller, accurate pipeline always beats a bloated one.
Forecast Accuracy Trend
Compare your weighted forecast against actual closed revenue each month. If you're consistently off by more than 20%, your stage probabilities need recalibrating against real win-rate data. Skip this report if you've been running your current stage definitions for less than two full quarters - you won't have enough data to draw conclusions.
How to Build One in 15 Minutes
HubSpot Quick-Start
In HubSpot Sales Hub Professional (~$90-$100+/seat/month, billed annually), go to Reporting > Reports > Sales. Select a pipeline report, toggle between "Over time" and "Totals" views, filter by date range and rep, then save to a dashboard.
HubSpot's default stage probabilities - Appointment Scheduled 20%, Qualified to Buy 40%, Presentation Scheduled 60%, Decision-Maker Bought In 80%, Contract Sent 90% - are a starting point. Replace them with the benchmarks above and audit quarterly against actual win rates. The defaults are generous and will inflate your weighted forecast.
Salesforce Quick-Start
Salesforce Sales Cloud (from ~$25/user/month for entry tiers to ~$165+/user/month for Enterprise) works best with a Close Month x Opportunity Stage layout. Build it in five steps:
- Reports > New Report > Opportunities
- Filter by Close Date and Stage
- Group Rows by Close Month, Columns by Stage
- Add summary fields: Sum of Amount + Weighted Amount
- Add a chart and save
That becomes your single source of truth for pipeline reviews.
Spreadsheet Template
Let's be honest - 70%+ of small businesses still track pipeline in spreadsheets. That's fine, but you need to standardize it. Here are the 10 fields:
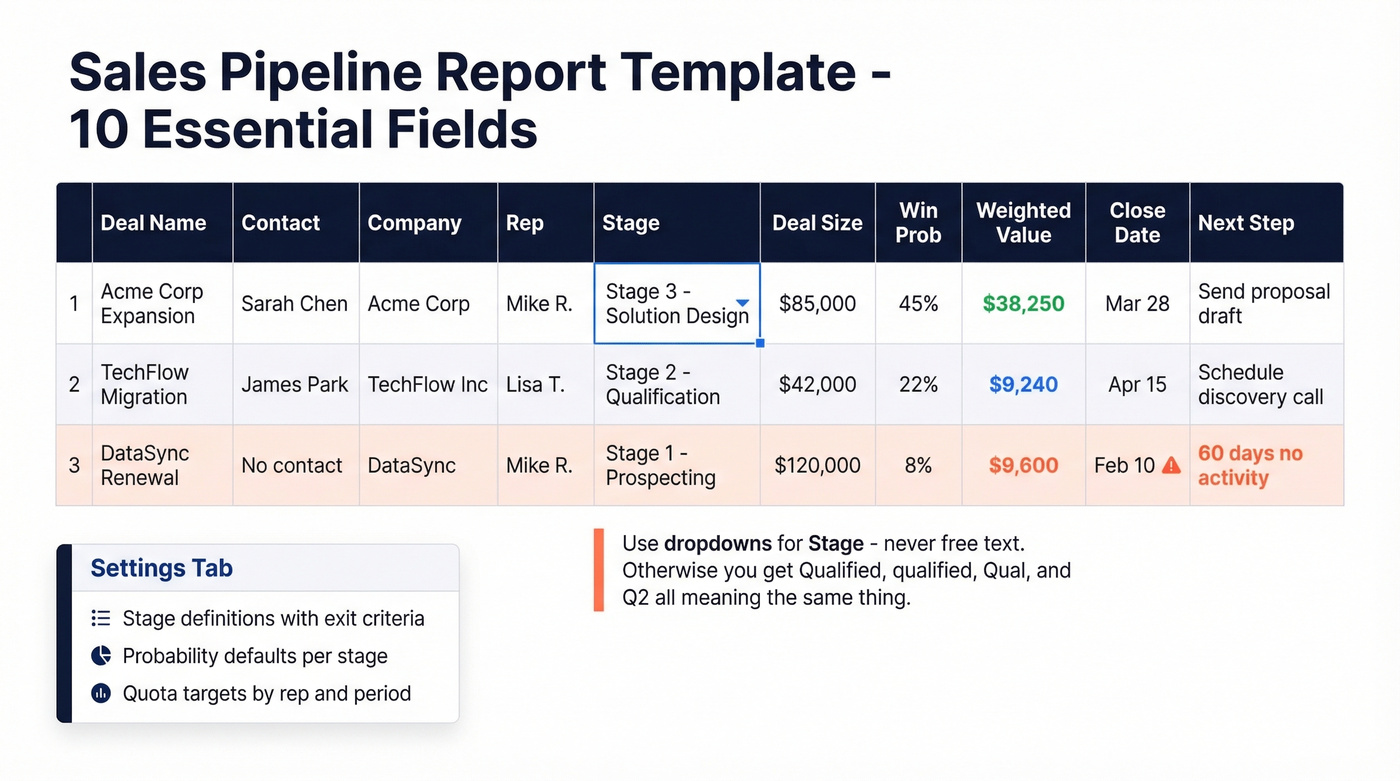
- Deal name
- Contact person
- Company
- Sales rep
- Stage (dropdown - not free text)
- Deal size
- Win probability
- Weighted forecast value (deal size x probability)
- Expected close date
- Next step / notes
Add a settings tab for stage definitions, probability defaults, and quota targets. Use dropdown menus to prevent the data inconsistency that kills reporting accuracy. Free text in the Stage column is how you end up with "Qualified," "qualified," "Qual," and "Q2" all meaning the same thing.
4 Mistakes That Ruin Pipeline Reports
Subjective stage criteria. If "Stage 2" means "I think they're interested" instead of "they completed discovery and confirmed budget," your pipeline is fiction. Define exit criteria by buyer behavior, not seller opinion.
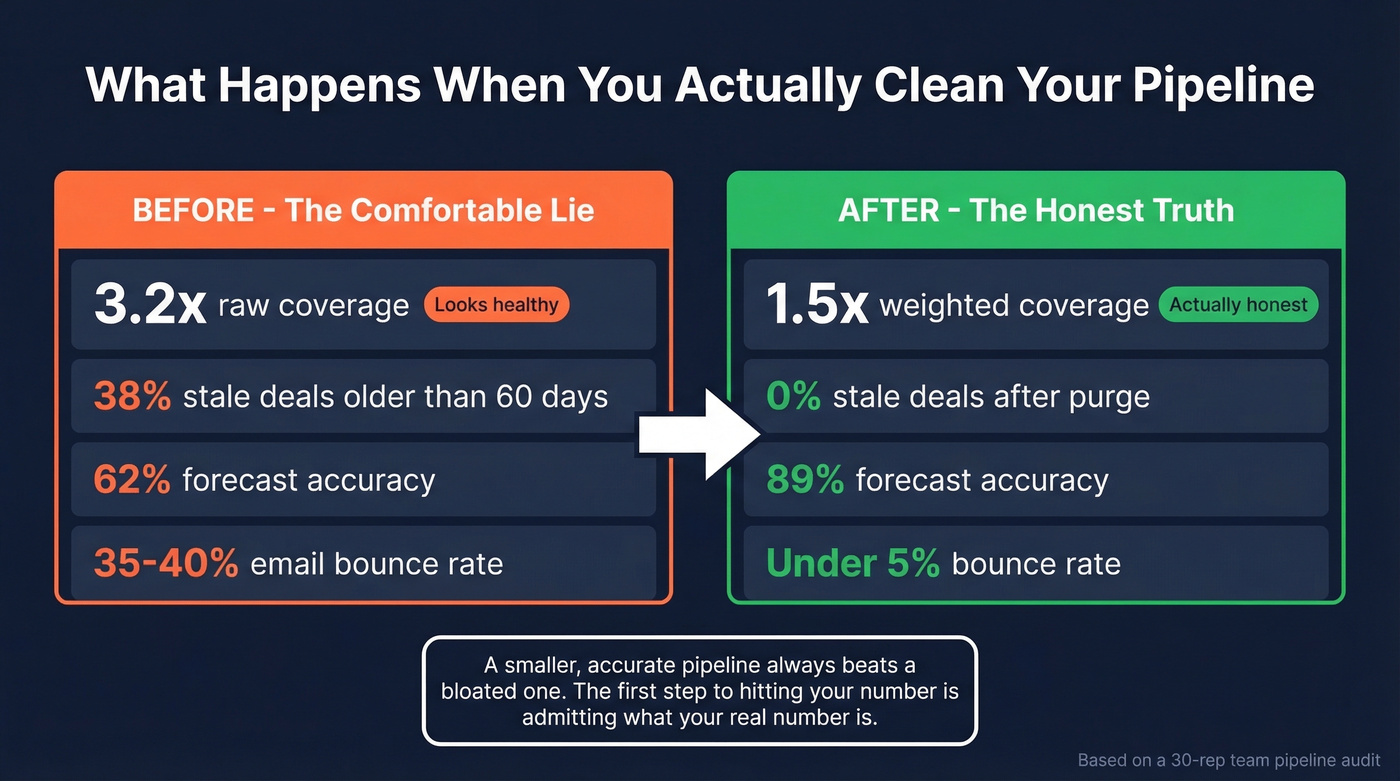
Waterlogged pipeline. Deals with no activity for 45+ days shouldn't count as pipeline. Purge stale deals monthly. We ran a pipeline audit for a 30-rep team last year and found that removing deals older than 60 days with no activity cut their reported pipeline by 38% - but their forecast accuracy jumped from 62% to 89% the following quarter.
Ignoring relationship depth. Teams track deal stages religiously while ignoring who they're meeting. If your champion is a mid-level manager and you've never engaged the economic buyer, that Stage 4 deal is really a Stage 2. Track meeting quality by seniority and titles met - it's a leading indicator most CRMs don't surface by default.
Bad upstream data. 90% of customer databases are incomplete, and reps waste roughly a fifth of their day on bad contact info. Your pipeline report is only as accurate as the contacts feeding it. Before leads enter your pipeline, verify the data. Prospeo checks emails at 98% accuracy on a 7-day refresh cycle, so your pipeline numbers reflect reality instead of stale records. When Snyk rolled this out across 50 AEs, their bounce rate dropped from 35-40% to under 5% and AE-sourced pipeline jumped 180%.
Look - most teams don't have a pipeline generation problem. They have a pipeline honesty problem. Apply the stage probabilities above, purge anything stalled past 45 days, and your "3.2x coverage" will probably shrink to 1.5x. That's terrifying. It's also the first step toward actually hitting your number.
Stalled deals often stall because reps can't reach the right buyer. With 125M+ verified mobiles (30% pickup rate) and 30+ filters like buyer intent and job changes, Prospeo fills your Stage 1 with prospects who pick up the phone - so your pipeline report shows movement, not a graveyard.
Stop reporting on dead deals. Start reaching real decision-makers.
FAQ
What's a good pipeline coverage ratio?
Raw 3:1 to 4:1 is the textbook answer, but weighted coverage matters more. Aim for 2.1x weighted with 70%+ of value from Stage 2 and beyond. If your close rate is below 25%, bump raw coverage to 5x.
How often should I review my sales pipeline report?
Weekly for reps and managers reviewing deal movement and stalled opportunities. Monthly for revenue leaders tracking coverage trends. Quarterly for auditing stage probabilities against actual win-rate data.
How do I fix bad data before it enters the pipeline?
Verify contact information at the point of entry using a real-time enrichment tool. Pair that with a CRM deduplication rule and you eliminate the garbage-in problem that wrecks reporting. The goal is zero bad records entering Stage 1 - because once they're in, they distort every metric downstream.
What's the fastest way to spot phantom pipeline?
Multiply each deal's value by its stage probability, then sum the results. If weighted coverage is less than half your raw coverage, you have significant phantom pipeline - deals sitting in early stages with inflated close dates that won't convert.