Statistics on Email Marketing for 2026: Every Stat Sourced and Explained
You've seen the stat roundups. "Email ROI is $42 for every $1 spent!" Great - says who? Based on what methodology? From what year? Most pages compiling statistics on email marketing are a graveyard of unsourced numbers recycled from 2019 blog posts, stripped of context, and slapped with a "2026" label.
The open rate problem alone tells the story: depending on which page you land on, the "average" open rate is 20%, 36.5%, or 43.46%. All three are technically defensible. None of them mean the same thing.
Every stat below includes its source, dataset size where available, and methodology notes. If a number is inflated by Apple Mail Privacy Protection, we say so. If two sources disagree, we explain why.
10 Stats You Can Actually Cite
These are the numbers worth putting on a slide. Each one is sourced and explained in detail further down.
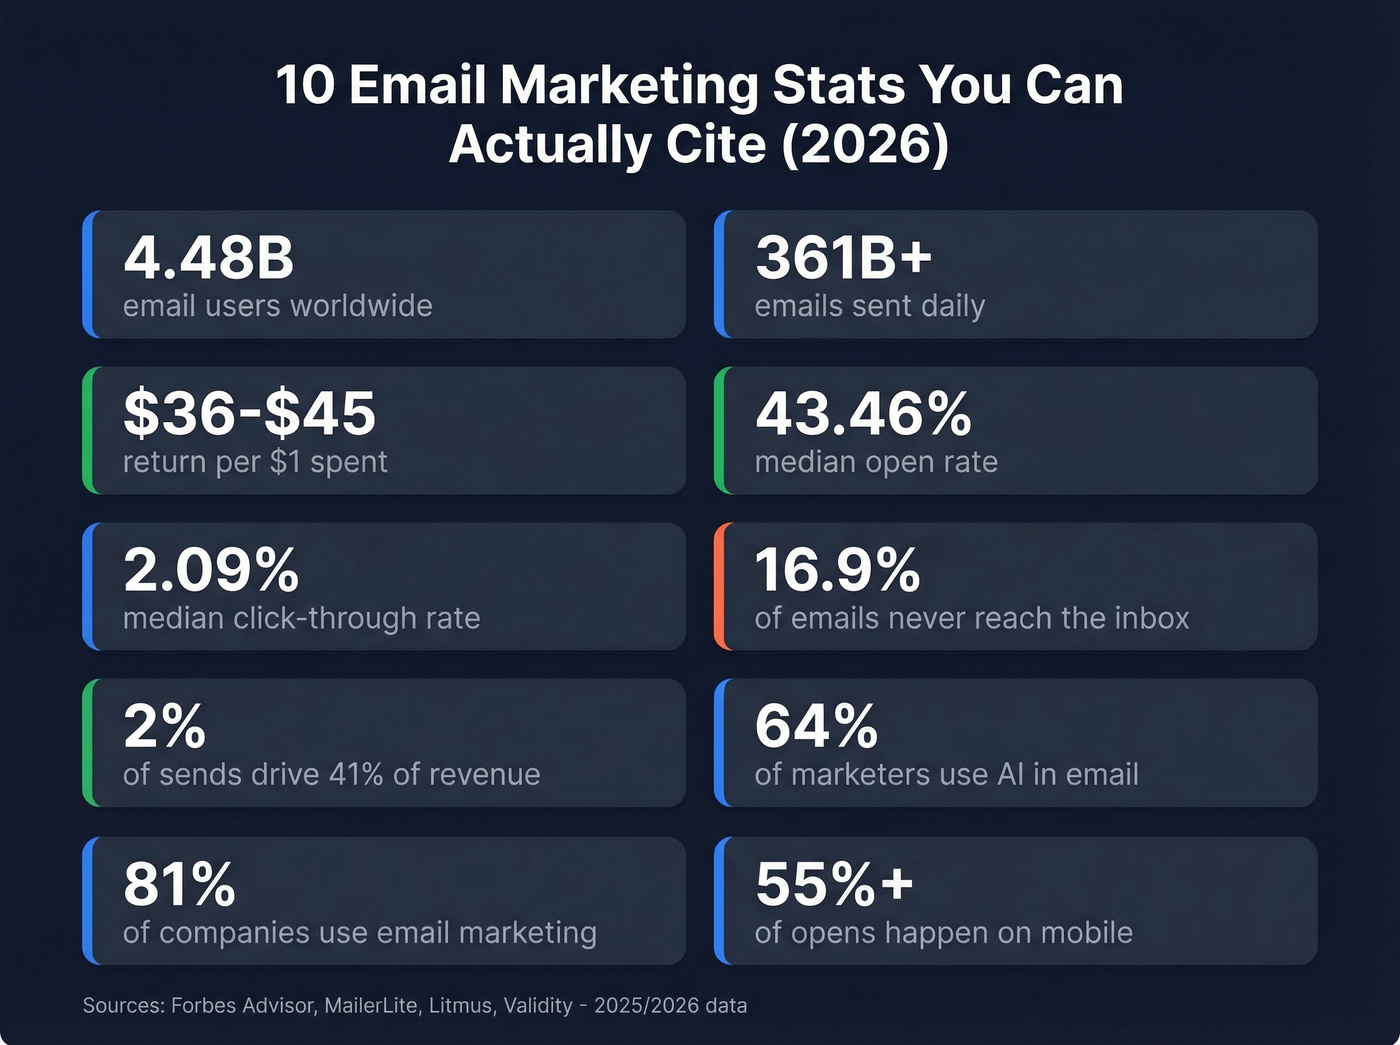
- 4.48 billion email users worldwide (Forbes Advisor, Mar 2026), projected to reach 4.73 billion in 2026
- 361 billion+ emails sent per day worldwide
- $36-$45 return per $1 spent on email marketing - the range reflects methodology differences across Litmus and other industry compilations
- 43.46% median open rate (MailerLite 2025, 3.6M campaigns - includes Apple MPP inflation)
- 2.09% median click-through rate (same dataset)
- 84% average inbox placement rate; 16.9% of emails never reach the inbox
- 2% of email send volume generates 41% of total email revenue (automated flows)
- 64% of marketers now use AI in email marketing
- 81% of companies use email as part of their marketing strategy; mobile devices account for 55%+ of email opens
- 97% incorporate at least one interactive element in campaigns; buttons/CTAs ranked most effective by 35%
Email Usage and Adoption
Email isn't slowing down. It's accelerating.
The global user base sits at 4.48 billion as of Forbes Advisor's March 2026 compilation, with a 4.73 billion user projection for 2026. That's more than half the planet with an inbox. Daily volume is around 361 billion emails - not all marketing, of course, since transactional, internal, and personal messages make up the bulk - but the sheer infrastructure means email as a channel isn't going anywhere. Every "email is dead" take from the last decade has aged poorly.
On the business side, 81% of companies use email as part of their marketing strategy. Even among small businesses, where budgets are tighter and teams are leaner, 64% run email marketing. The channel's combination of low marginal cost, direct ownership (you don't rent your list from an algorithm), and measurable ROI keeps it dominant.
Mobile Email Is the Default
Here's a stat most roundups bury: over 55% of all email opens now happen on mobile devices. If your emails aren't mobile-optimized, you're designing for the minority of your audience.
Mobile visitors convert at 3.6% on email signup widgets, compared to 2.9% on desktop. People are more willing to subscribe on their phones - but they'll bounce instantly from an email that renders poorly on a 6-inch screen. Mobile-first design isn't a best practice anymore. It's the baseline.
The growth trajectory matters for planning. If you're building outbound or lifecycle programs, the addressable audience is expanding, not contracting. The question isn't whether email works - it's whether your data and execution are good enough to stand out in 361 billion daily messages.
Email Marketing ROI Benchmarks
The ROI range you'll see cited most often is $36-$45 per $1 spent. The variance comes down to methodology. Litmus repeats the widely cited benchmark of 36:1 ROI or more. Other industry compilations cite higher figures depending on sample composition and what they count as "email-driven" revenue.
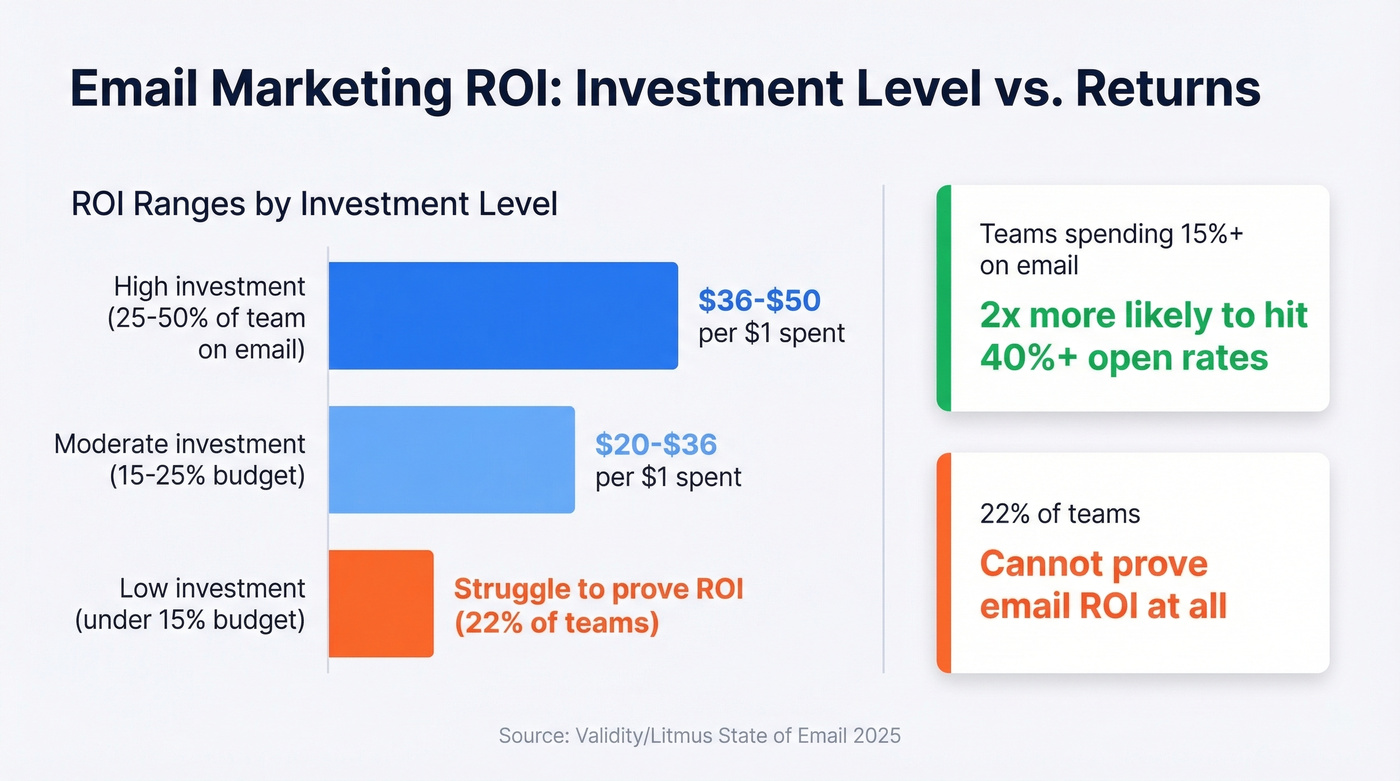
The Validity/Litmus State of Email 2025 report adds useful context: companies dedicating more than 15% of their marketing budget to email are 2x more likely to achieve open rates above 40%. The high-ROI cohort - teams seeing 36:1 to 50:1 returns - dedicates 25-50% of their marketing team to email operations. Email rewards investment. Underfund it and you'll join the 22% who struggle to prove ROI at all.
Here's the thing: if your average deal size is above $5k and you're spending less than 15% of your marketing budget on email, you're almost certainly over-investing in channels with worse unit economics. Email isn't sexy, but it's the highest-ROI channel most teams understaff. The 2025 data already proved this, and the 2026 numbers only reinforce the trend.
| Channel | Benchmark Conversion Rate |
|---|---|
| Email marketing (B2C) | 2.8% |
| Email marketing (B2B) | 2.4% |
Email Engagement Benchmarks
This is where the stat pages diverge - and where you need to understand why before citing anything.
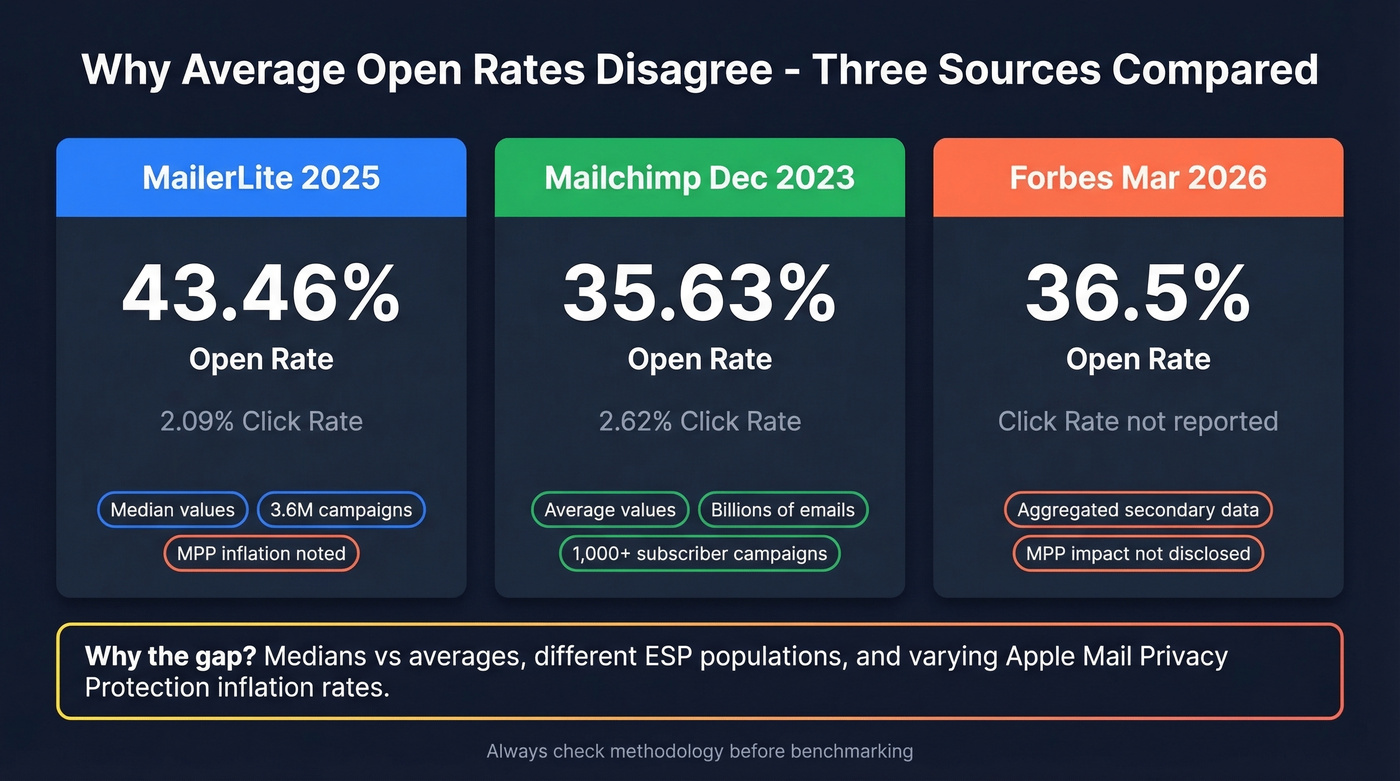
Three major sources report different "average" open rates:
| Metric | MailerLite 2025 | Mailchimp (Dec 2023) | Forbes 2026 |
|---|---|---|---|
| Open rate | 43.46% | 35.63% | 36.5% |
| Click rate | 2.09% | 2.62% | Not reported |
| CTOR | 6.81% | Not reported | Not reported |
| Unsub rate | 0.22% | 0.22% | Not reported |
| Dataset | 3.6M campaigns | Billions of emails | Aggregated |
| Methodology | Median, 181K accts | Avg unique rates; campaigns 1,000+ subs | Secondary |
| Freshness | Dec '24-Nov '25 | Dec 2023 | Mar 2026 compilation |
| MPP caveat | Yes, explicit | Yes, noted | Not disclosed |
Why do they differ? Three reasons. First, the 2025 data reports medians while the Mailchimp benchmarks are averages - medians are less sensitive to outlier campaigns. Second, the datasets come from different ESP populations with different sender profiles. Third, Apple Mail Privacy Protection inflates open rates, and the degree of inflation depends on each ESP's Apple Mail user share.
The unsub rate jump is worth calling out. MailerLite's data shows unsubscribe rates rising from 0.08% in 2024 to 0.22% in 2025. That sounds alarming until you understand the cause: Gmail changes made opting out easier. This is healthy. People who don't want your emails are leaving cleanly instead of hitting "spam." Your list gets cleaner, your sender reputation improves, and your engagement metrics become more honest.
Industry Benchmarks
Benchmarks vary dramatically by industry. A nonprofit sending a donor update and an ecommerce brand sending a flash sale are playing different games entirely.
2025 Industry Data (MailerLite)
Based on 3.6M campaigns across 181K accounts, Dec 2024-Nov 2025. All figures are medians.
| Industry | Open Rate | Click Rate | Unsub Rate |
|---|---|---|---|
| Religion | 55.71% | 3.12% | 0.11% |
| Nonprofit | 52.38% | 2.87% | 0.14% |
| Education | 44.20% | 2.41% | 0.16% |
| Health & Fitness | 40.15% | 2.10% | 0.20% |
| Ecommerce | 32.67% | 1.68% | 0.25% |
| Travel | 30.10% | 1.42% | 0.21% |
The spread is massive - 25 percentage points between religion and travel. High-affinity audiences like faith communities and nonprofits open at rates that would be unrealistic targets for transactional industries. If you're benchmarking, compare within your vertical, not against all-industry averages.
2023 Industry Data (Mailchimp)
Based on billions of emails, campaigns with 1,000+ subscribers. Last updated December 2023.
| Industry | Open Rate | Click Rate | Unsub Rate |
|---|---|---|---|
| Non-Profits | 40.04% | 3.27% | 0.18% |
| Education | 35.64% | 3.02% | 0.18% |
| Business & Finance | 31.35% | 2.78% | 0.15% |
| Ecommerce | 29.81% | 1.74% | 0.19% |
| Media & Publishing | 33.15% | 2.89% | 0.12% |
| Software & Tech | 30.85% | 2.45% | 0.21% |
This dataset is still useful for directional comparison, but treat it as a baseline, not a current target. The MailerLite dataset is fresher and includes explicit methodology notes. Always check which year and methodology a source uses before benchmarking.
Automation and Triggered Emails
The most important stat on this entire page might be this one: 2% of email send volume generates 41% of total email revenue. Automated flows do the heavy lifting while broadcast campaigns carry the volume.
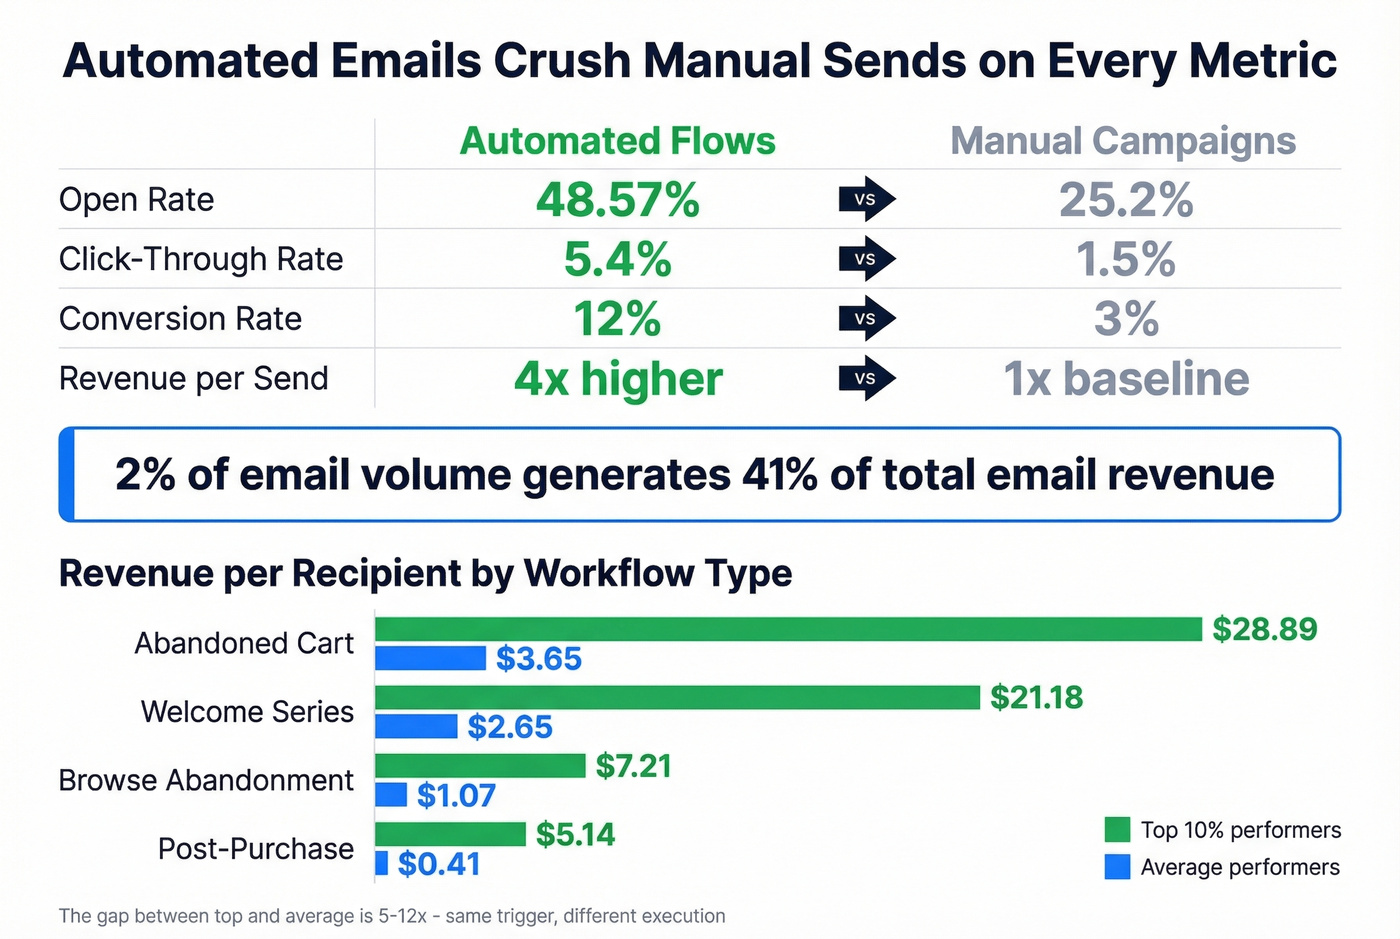
We've seen this play out consistently. The top-performing automated workflows share a common trait - they fire fast. Abandoned cart emails sent within 60 minutes outperform those sent the next day by a wide margin. The performance gap between automated and manual emails is stark across every metric:
- Automated open rate: 48.57% vs. manual 25.2%
- Automated CTR: 5.4% vs. manual 1.5%
- Automated conversion rate: 12% vs. manual 3%
- Revenue per send: 4x higher for automated flows
Adoption is widespread but uneven. 63% of companies use marketing automation specifically for email, and 79% of marketers automate at least part of their customer journey - 10% fully, 25% mostly, 44% partly. The remaining 21% don't automate at all, which at this point is leaving money on the table.
The per-workflow breakdown tells the real story:
| Workflow Type | Top 10% Rev/Recipient | Avg Rev/Recipient |
|---|---|---|
| Abandoned cart | $28.89 | $3.65 |
| Welcome series | $21.18 | $2.65 |
| Browse abandonment | $7.21 | $1.07 |
| Post-purchase | $5.14 | $0.41 |
The gap between top 10% and average performers is 5-12x. That's not a data quality issue - it's an optimization issue. Same trigger, same concept, wildly different execution. The marketing automation market is projected to reach $13.97 billion by 2030, growing at 12.8% CAGR, and triggered messages tied to specific user actions consistently outperform generic broadcast sends across every dataset we've reviewed.
The data shows 16.9% of emails never reach the inbox. Bad contact data is the #1 reason. Prospeo's 5-step verification and 7-day refresh cycle deliver 98% email accuracy - so your campaigns actually hit the benchmarks that matter, not the spam folder.
Stop inflating your send volume. Start reaching real inboxes at $0.01 per verified email.
List Growth and Opt-In Stats
List growth is the upstream metric that determines everything else.
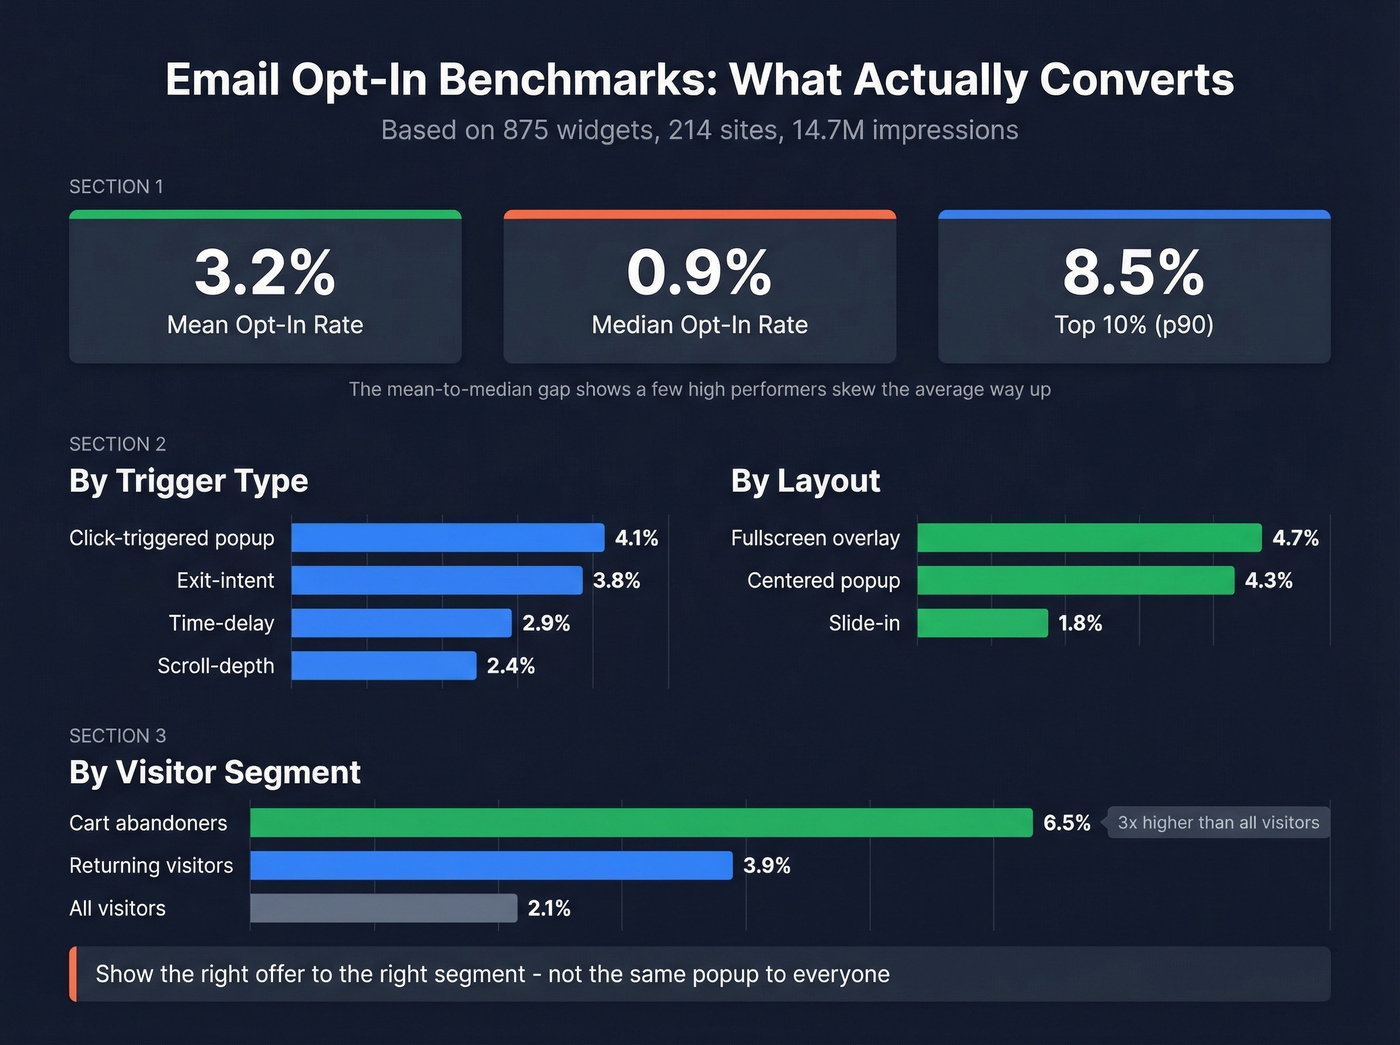
A dataset covering 875 widgets across 214 sites - 14.7 million impressions and 473,000 subscriptions - gives us unusually granular benchmarks. Overall opt-in conversion: mean 3.2%, median 0.9%, p90 8.5%. That median-to-mean gap tells you the distribution is heavily skewed - a small number of high-performing widgets pull the average up significantly. If you're at 1%, you're roughly at the median. If you're at 3%+, you're outperforming most sites.
Trigger type matters enormously. Click-triggered popups convert at 4.1%, exit-intent at 3.8%, time-delay at 2.9%, and scroll-depth at 2.4%. Layout matters too: fullscreen overlays hit 4.7%, centered popups 4.3%, and slide-ins trail at 1.8%.
The targeting data is where it gets interesting. Cart abandoners convert at 6.5% on opt-in widgets - 3x the rate of all-visitor targeting at 2.1%. Returning visitors sit at 3.9%. The lesson: show the right offer to the right segment, not the same popup to everyone.
Seasonality creates predictable spikes. BFCM drives a +65% uplift over regular weeks, Christmas +42%, Valentine's +28%, and Back to School +19%. Plan your list growth campaigns around these windows - even holiday-adjacent sends tend to dip in response rates, so timing matters for both opt-in and engagement.
Email Deliverability Stats
Average inbox placement sits at 84%. That means 16.9% of emails never reach the inbox, and 10.5% land directly in spam. For a 100,000-email campaign, that's nearly 17,000 messages your recipients will never see.
The practitioner perspective on Reddit paints an even sharper picture: roughly 90% of emails pass content checks, yet only about 60% reach a visible inbox. The gap is driven by subject line patterns, missing unsubscribe headers, broken links, and - most critically - sender reputation. Deliverability has shifted from "write better copy" to structural compliance and long-term sender behavior.
Gmail and Yahoo's 2024 bulk sender requirements accelerated this shift. Authentication (SPF, DKIM, DMARC) is now table stakes. Spam complaint rates need to stay below 0.1%. One-click unsubscribe headers are mandatory. These aren't suggestions - they're enforcement thresholds that directly affect inbox placement.
Your email stats start with your data. A high bounce rate signals to Gmail and Yahoo that you're a careless sender, and every downstream metric suffers. Prospeo's email verification - catch-all handling, spam-trap removal, honeypot filtering - catches bad addresses before they damage sender reputation. At 98% accuracy across 143M+ verified emails, it's the verification layer that protects everything else. Customers like Meritt saw bounce rates drop from 35% to under 4%, directly improving deliverability and every metric that follows.
Look, deliverability isn't glamorous. But it's the foundation. Every open rate, click rate, and revenue-per-send stat on this page assumes your emails actually arrive. If 16.9% of your volume is disappearing, you're optimizing subject lines on a broken foundation.
Teams dedicating 25-50% of resources to email see 36:1 to 50:1 ROI. But that ROI collapses when your contact data decays - and industry-average providers refresh every 6 weeks. Prospeo refreshes every 7 days across 300M+ profiles, so your outbound hits decision-makers, not dead addresses.
Maximize your email ROI with data that's never more than a week old.
AI in Email Marketing
AI adoption in email marketing has moved from experimental to operational. 64% of marketers now use AI in their email programs, with the most common applications being personalization (50%), subject line optimization (41%), and send-time optimization (29%).
The forward-looking data is more striking. 70% of email marketers predict that up to half of email operations will be AI-driven by the end of 2026. Another 18% expect AI to handle 50-75% of tasks. We're watching a channel that already had strong ROI get a productivity multiplier on top. Early data suggests AI-personalized subject lines lift open rates by 5-10% over static variants, though rigorous longitudinal studies are still catching up.
Production speed captures this shift in real terms. Only 6% of teams now need more than two weeks to produce an email - down from 62% in 2024. That's a near-complete collapse in production timelines, driven largely by AI-assisted copywriting, design, and QA workflows.
The risk is over-automation without governance. In our experience, teams that let AI draft and send without human review eventually hit a brand voice or compliance wall - and the cleanup costs more than the time saved.
Why Open Rates Are Unreliable in 2026
Real talk: open rates are the most cited and least reliable metric in email marketing. Apple Mail Privacy Protection, launched in 2021, pre-fetches tracking pixels for Apple Mail users regardless of whether they actually open the email. This inflates open rates, and multiple benchmark sources now flag that caveat directly.
Every open rate number on this page - 43.46%, 35.63%, 36.5% - is inflated to some degree. The MailerLite data explicitly flags this in their methodology. Mailchimp notes it. Forbes doesn't disclose whether they've adjusted.
This is why CTOR can appear deceptively low when opens are inflated. If your denominator is artificially high, the ratio drops even if clicks are healthy. It's a math artifact, not a performance problem. Reddit threads on r/emailmarketing increasingly echo this: experienced practitioners have stopped using open rate as a primary KPI entirely, focusing instead on downstream actions like clicks, conversions, and revenue per send.
The Gmail unsubscribe UX shift compounds the measurement change. Unsubscribe rates jumped from 0.08% to 0.22% - not because more people hate your emails, but because leaving got easier. This is a positive signal for list health, even though the number looks worse on a dashboard.
What should you track instead? Click-through rate, where 2-3% is solid. CTOR in the 5-7% range. Conversion rate. Revenue per email. Bounce rate remains reliable and directly reflects data quality - and it's the one metric that clean, verified contact data directly improves by catching invalid addresses before they hit your ESP.
B2B vs. B2C Email Performance
B2B and B2C email marketing operate under different dynamics, and blending their stats leads to misleading benchmarks.
One grounded benchmark to anchor on: email marketing conversion rates are 2.8% for B2C and 2.4% for B2B. B2B campaigns tend to show lower open and click rates than B2C, but higher revenue per conversion due to larger deal sizes. The automation gap is where B2B often pulls ahead economically - onboarding drips, renewal reminders, and event follow-ups can generate disproportionate revenue per send because the deal sizes justify the investment in sequencing and personalization.
For B2B teams running outbound, the quality of your contact data determines everything. Sending to a verified decision-maker's inbox is a fundamentally different game than blasting a purchased list. Better data reduces bounces, protects domain reputation, and lifts every metric downstream.
Cold Email and Outbound Benchmarks
For teams focused on outbound, a separate set of benchmarks applies. The cold email reply rate typically falls between 1-5%, depending on targeting, personalization, and list quality. Personalized subject lines and opening lines run 20-30% higher open rates than generic templates, which is why top SDR teams invest heavily in research before sending.
How many cold emails to generate a qualified opportunity? The answer varies by industry and deal size, but sales teams commonly report needing 100-300 targeted cold emails per opportunity. The average cold email click-through rate hovers around 2-3%, roughly in line with marketing email benchmarks but with far more variance based on copy quality and relevance.
B2B cold email results improve dramatically with proper follow-up. Sales follow-up data shows that 80% of deals require at least five touchpoints, yet most reps stop after two. The breakup email - a final "closing the loop" message - often generates a surprisingly strong response, with some teams reporting 15-20% reply rates when the sequence is well-constructed. High-performing SDR teams typically send 150-250 personalized emails per week per rep, and volume matters less than targeting: cold outbound results are strongest when SDRs combine verified contact data with account-level research.
Campaign Trends for 2026
Litmus frames "privacy-proofing" as the defining trend for 2026. The playbook is shifting toward metrics and strategies that don't depend on tracking pixels or third-party cookies.
Zero-party data collection is replacing inferred behavioral data. Preference centers, surveys, and interactive content let subscribers tell you what they want directly. Re-permission campaigns - asking existing subscribers to confirm their preferences - are becoming standard practice rather than a compliance checkbox.
BIMI adoption is accelerating as a trust signal. Brand Indicators for Message Identification display your verified logo next to emails in supporting inboxes. It's both a deliverability signal and a brand recognition play.
Interactive elements are now the norm, not the exception. 97% of email marketers incorporate at least one interactive element, with buttons and CTAs ranked most effective by 35% of respondents. The days of static, image-heavy emails are fading - AMP for Email, embedded polls, and real-time content blocks are moving from experimental to expected. Embedded video thumbnails are lifting click rates by 20-40% in early tests, though results depend heavily on the subject line signaling video content inside.
AI governance is the emerging concern. With the EU AI Act creating risk-level classifications, email teams using AI for personalization and content generation need to understand disclosure requirements, offer opt-outs, and keep policies updated. The 64% of teams already using AI in email need governance frameworks before regulation catches up.
FAQ
What's a good email open rate in 2026?
The 2025 median across 3.6M campaigns is 43.46%; Mailchimp's benchmark (last updated Dec 2023) is 35.63%. Both are inflated by Apple Mail Privacy Protection. Focus on click-through rate (2-3% is healthy) and CTOR of 5-7% as more reliable engagement indicators. Always compare within your industry vertical, not against all-sector averages.
What's the average ROI of email marketing?
Industry sources cite $36-$45 per $1 spent, with the range driven by methodology differences. Litmus repeats a 36:1 benchmark. Companies dedicating over 15% of marketing budget to email are 2x more likely to see 40%+ open rates. Email consistently ranks as the highest-ROI digital channel across both B2B and B2C.
How many emails are sent per day worldwide?
Around 361 billion emails per day, with 4.48 billion global users and a 4.73 billion projection for 2026. Daily volume continues to grow year over year, driven by both marketing and transactional expansion.
Do automated emails really outperform manual campaigns?
Significantly. Automated emails see 48.57% open rates vs. 25.2% for manual sends, 5.4% CTR vs. 1.5%, and 4x higher revenue per send. The top 10% of abandoned cart flows generate $28.89 per recipient - nearly 8x the average of $3.65.
How do I improve email deliverability for free?
Start with authentication: configure SPF, DKIM, and DMARC for your sending domain. Keep spam complaint rates below 0.1% and include one-click unsubscribe headers. Verify your list before sending - Prospeo's free tier includes 75 email verifications per month at 98% accuracy, which catches invalid addresses before they damage your sender reputation. Tools like Mail Tester and Google Postmaster Tools also help diagnose issues at no cost.