What Is a Sales Margin? Formulas, Benchmarks & Real Examples
A flooring retailer switched its sales commissions from markup-based to margin-based last year. Half the team thought they were getting a raise. The other half thought they were getting a pay cut. Both were wrong - they just didn't understand the difference between margin and markup. If you're asking what a sales margin actually is, you're already ahead of most teams that confuse these concepts daily, costing their businesses real money.
Quick version
- Sales margin = (Revenue - COGS) / Revenue x 100
- Average across all industries: 36.56% gross, 8.54% net (Vena Solutions summary of NYU Stern/Damodaran, Feb 2026)
- Sales margin and gross margin use the same formula - different context
- Margin ≠ markup (confusing them misprices every product)
- Your "real" margin is lower than you think once shipping, returns, and fees are included
Sales Margin Defined
Sales margin is the profit generated from a sale, expressed as a percentage of revenue. It tells you how much of every dollar you collect actually sticks after covering the direct costs of delivering your product or service.
The formula:
(Revenue - Cost of Goods Sold) / Revenue x 100 = Sales Margin %
Here's where terminology gets messy. Sales margin and gross profit margin are the same calculation. The difference is context: "gross margin" shows up in financial reporting and investor decks, while "sales margin" is the term operations and sales teams use when analyzing individual transactions, product lines, or rep performance.
This metric sits at an intermediate level - it doesn't include overhead like rent, marketing, or software subscriptions. For full business profitability, you need net profit margin. But for pricing decisions and deal-level analysis, sales margin is the number that matters. You can slice it by product line, salesperson, region, or deal cluster, and you should, because an aggregate number hides the products and reps that are dragging profitability down.
How to Calculate Sales Margin
Let's walk through three business types to show how the same formula plays out differently.
| Scenario | Revenue | Direct Costs | Gross Profit | Sales Margin |
|---|---|---|---|---|
| SaaS company | $50,000 | $15,000 | $35,000 | 70% |
| Ecommerce brand | $100,000 | $50,000 | $50,000 | 50% |
| Services firm | $200,000 | $94,000 | $106,000 | 53% |
Those are clean examples. Real transactions get messier. AccountingTools walks through a useful worked example: $100,000 in revenue, minus a $10,000 discount, minus $65,000 in labor costs, minus $2,000 in salesperson commission = $23,000 in gross profit. Calculated against net sales of $90,000 (revenue after the discount), that's a 25.6% margin on a deal that looked like it had much more room.
The lesson: discounts and commissions eat margin fast. If your reps are authorized to discount 10% and earn 2% commission, you've already given up 12% of revenue before COGS even enters the picture. Track the fully loaded number, not the sticker price.
Sales Margin vs. Markup
This is where teams blow up pricing models. In our experience, the margin/markup confusion is the single most expensive pricing mistake small businesses make. A Reddit thread on r/explainlikeimfive captured the problem perfectly: a manager tells the team to "price items at a 42% margin." Half the team uses Cost x 1.42 (that's markup). The other half uses Cost / 0.58 (that's margin). They get completely different prices and argue about who's right.
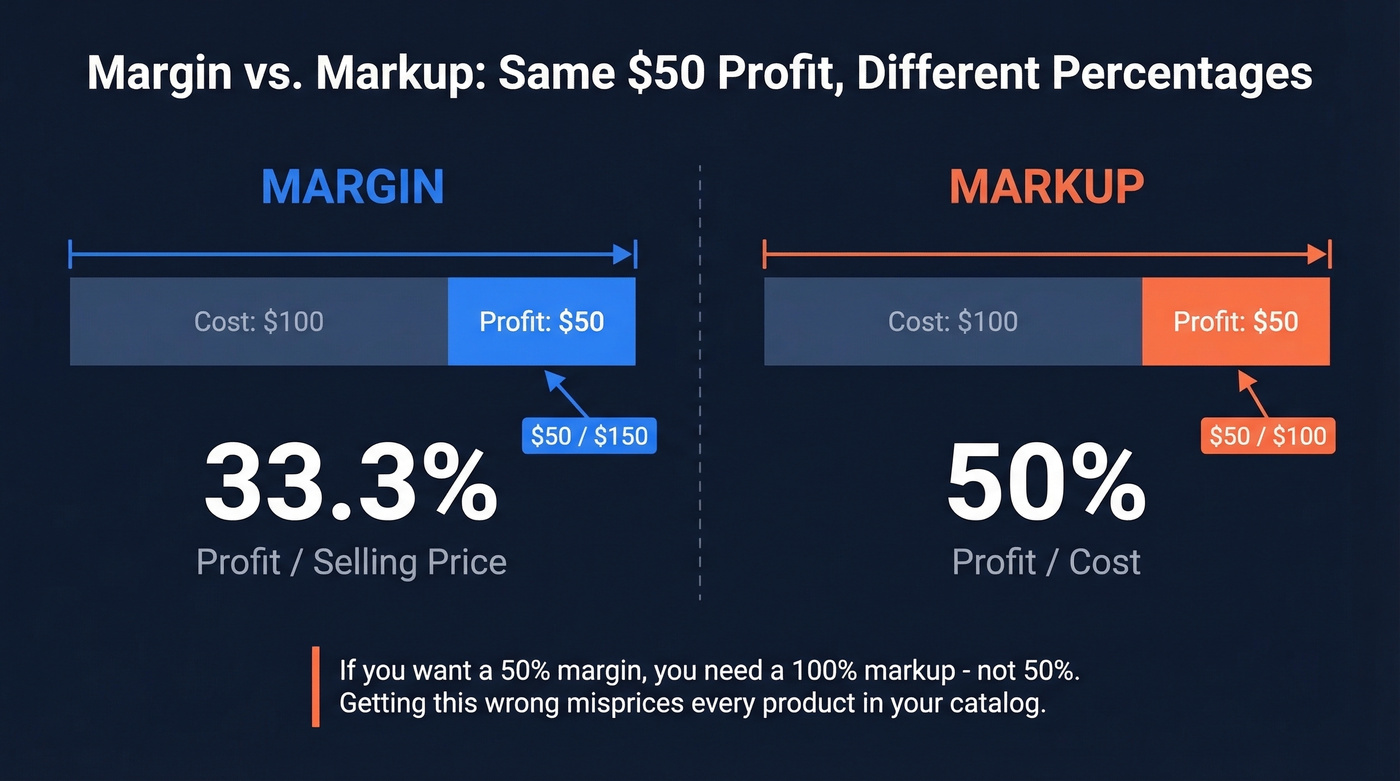
Let's make this concrete. You buy a product for $100 and sell it for $150. Your profit is $50.
- Margin = $50 / $150 = 33.3% (profit as a percentage of the selling price)
- Markup = $50 / $100 = 50% (profit as a percentage of the cost)
Same transaction. Same $50 profit. Wildly different percentages.
Here's the thing: if you want a 50% margin, you need a 100% markup - not 50%. The math: $100 cost / (1 - 0.50) = $200 selling price. That $100 profit on $100 cost is a 100% markup. Getting this wrong on a product catalog with thousands of SKUs compounds into serious revenue leakage.
Markup-to-Margin Reference
| Markup % | Margin % | Selling Price on $100 Cost |
|---|---|---|
| 20% | 16.7% | $120 |
| 30% | 23.1% | $130 |
| 50% | 33.3% | $150 |
| 75% | 42.9% | $175 |
| 100% | 50.0% | $200 |
Bookmark this table. It'll save you from the most common pricing errors: applying a uniform markup across all products instead of targeting margin by category, ignoring overhead and variable costs, and not reevaluating prices as costs change.
Discounts and commissions eat margin fast - but so does chasing bad contact data. Every bounced email is wasted spend that drags your cost-per-deal up and your effective margin down. Prospeo delivers 98% email accuracy at ~$0.01 per lead, so your outbound budget actually converts.
Stop leaking margin on leads that never land.
The Four Types of Margin
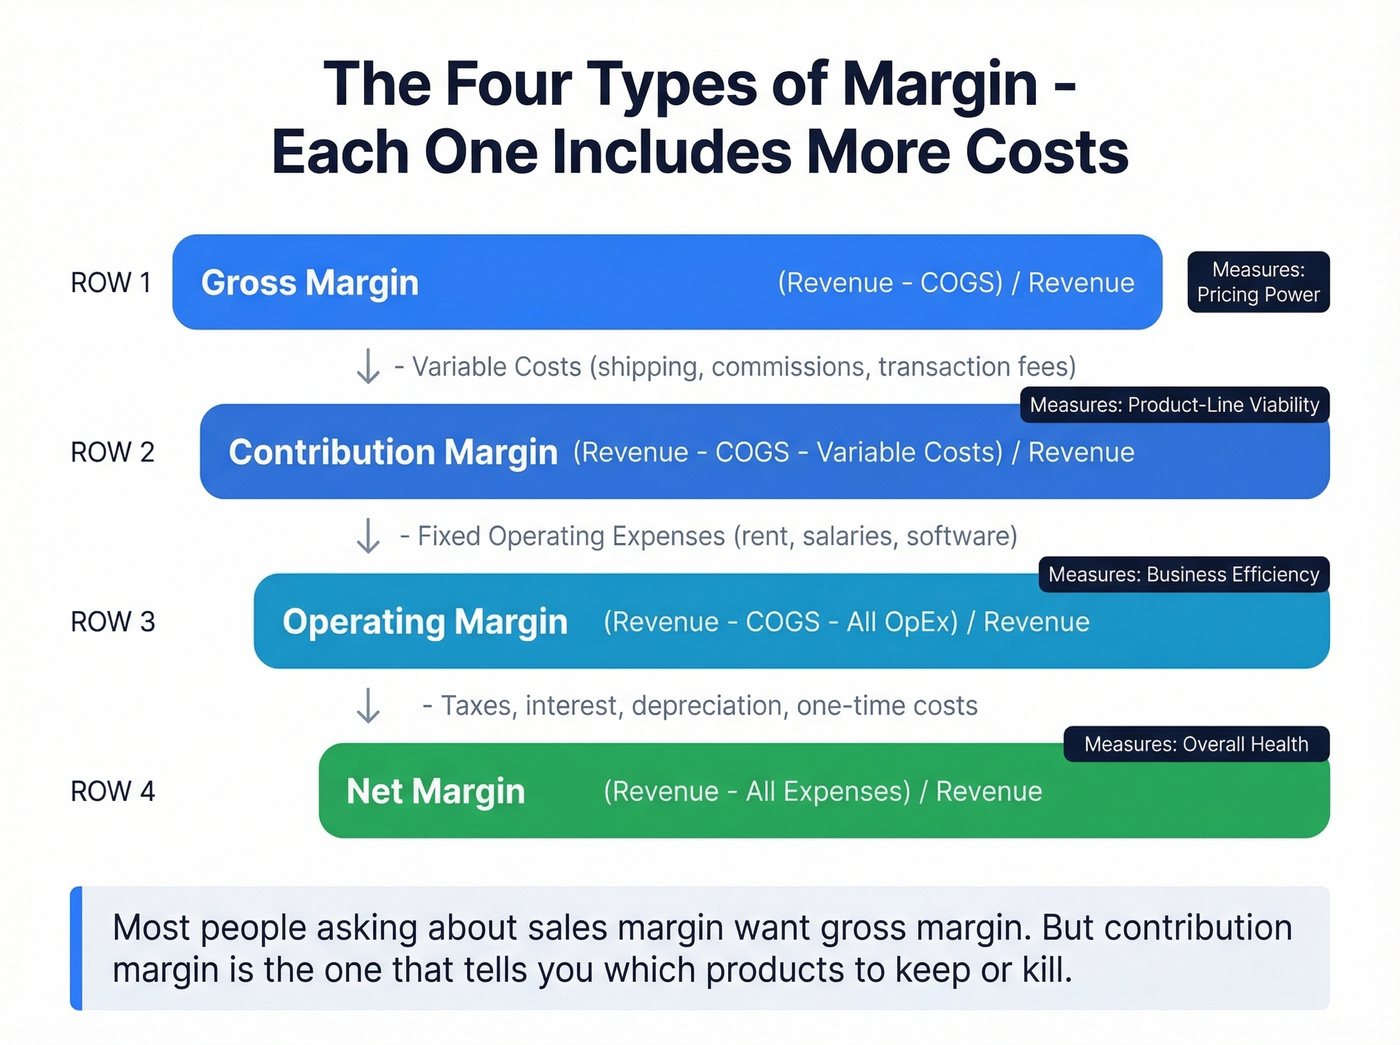
Not all margins measure the same thing. Each one includes more costs than the last.
| Margin Type | Formula | What It Tells You |
|---|---|---|
| Gross | (Revenue - COGS) / Revenue | Pricing power |
| Contribution | (Revenue - COGS - Variable Costs) / Revenue | Product-line viability |
| Operating | (Revenue - COGS - All OpEx) / Revenue | Business efficiency |
| Net | (Revenue - All Expenses) / Revenue | Overall health |
Most people asking about sales margin want gross margin. But if you're deciding which products to kill or invest in, contribution margin is the number that actually matters - it strips away the noise and shows whether a product line earns its keep.
2026 Benchmarks by Industry
The cross-industry averages - 36.56% gross and 8.54% net - work as a sanity check but fail as a target. Benchmarking against "all industries" is like comparing your marathon time to the average speed of all vehicles on a highway. Useless.
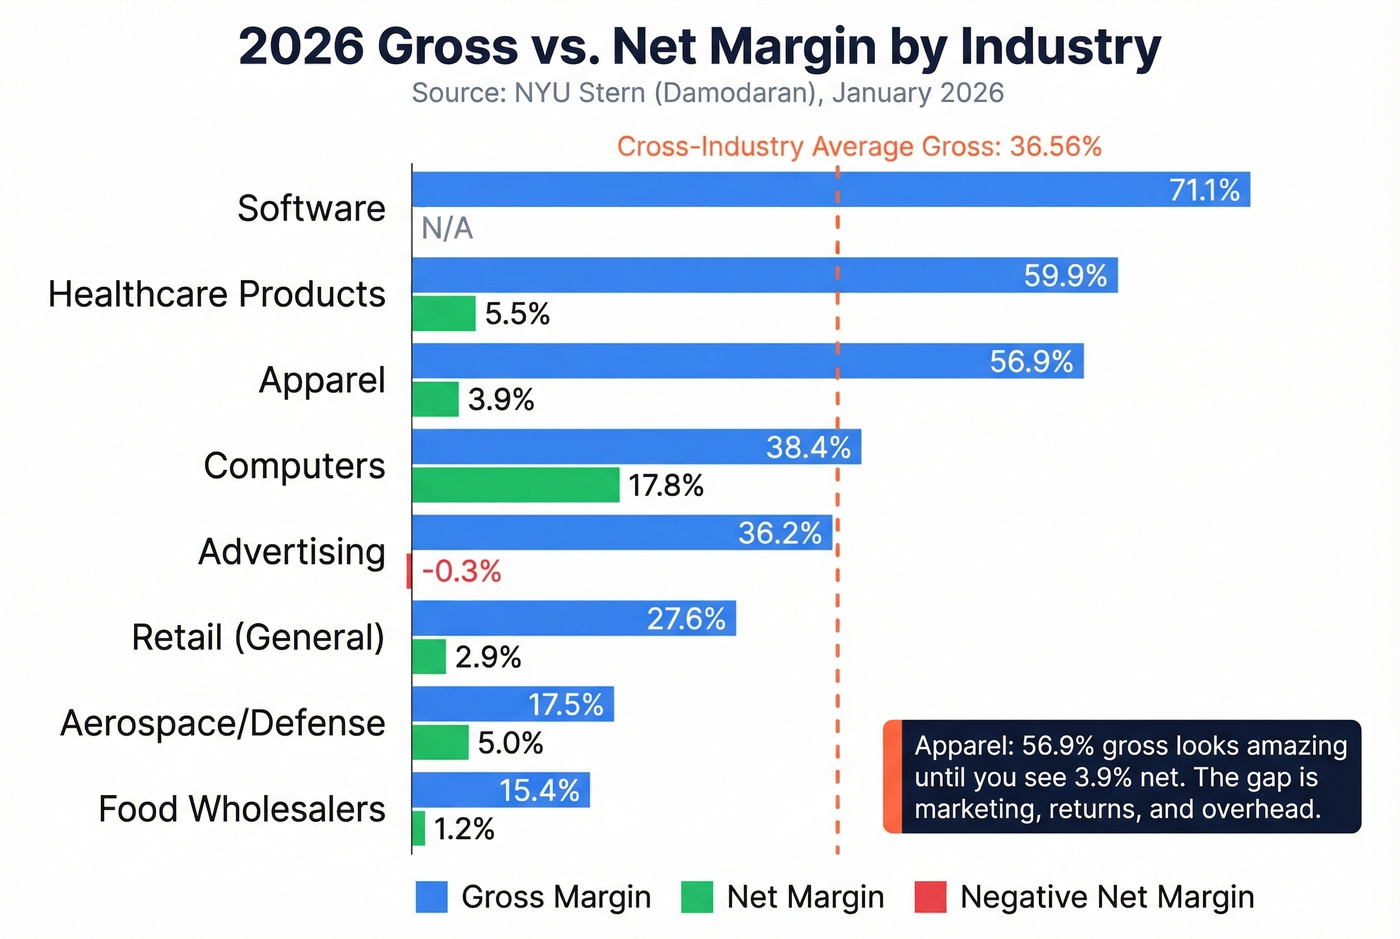
Here's what the data actually looks like by sector, from NYU Stern (Damodaran), January 2026:
| Industry | Firms | Gross Margin | Net Margin |
|---|---|---|---|
| Advertising | 52 | 36.24% | -0.30% |
| Aerospace/Defense | 79 | 17.48% | 4.99% |
| Apparel | 35 | 56.88% | 3.85% |
| Auto & Truck | 33 | 10.41% | 1.29% |
| Computers/Peripherals | 36 | 38.36% | 17.78% |
| Food Wholesalers | 13 | 15.44% | 1.17% |
| Healthcare Products | 53 | 59.94% | 5.46% |
| Retail (General) | 17 | 27.58% | 2.89% |
| Software (System & Application) | 389 | 71.10% | - |
| Banks (Money Center) | - | 100.00% | 30.89% |
Look at apparel: 56.88% gross margin sounds incredible until you see the 3.85% net. That gap tells you everything about how much gets consumed by marketing, returns, and overhead between the gross and net lines.
Banks at 100% gross margin isn't a typo - their "COGS" structure is fundamentally different from product businesses. Don't compare yourself to banks. Compare yourself to your sector, and ideally to companies at your stage and scale. You can download the full Damodaran dataset to find your exact industry.
Our hot take: If your gross margin is within 5 points of your industry median and you're still not profitable, your problem isn't pricing - it's overhead. Most businesses obsess over margin when they should be auditing their operating expenses.
How to Calculate It in Excel
Three formulas you'll actually use:
Margin from price and cost:
=(Price-Cost)/Price
Selling price from cost and target margin:
=Cost/(1-Margin%)
Example: $100 cost, 30% target margin -> =100/(1-0.30) -> $142.86
Markup-to-margin conversion:
=Markup%/(1+Markup%)
Example: 50% markup -> =0.50/(1+0.50) -> 33.3% margin
That second formula is the one most people get wrong. They multiply cost by (1 + margin%) instead of dividing by (1 - margin%). The difference on a $100 item at 30% target margin: $130 (wrong) vs. $142.86 (right). That's $12.86 per unit left on the table - and on 10,000 units, you've just given away $128,600.
How to Improve Your Sales Margin
Reveal Fully Loaded COGS
What looked like an 80% product margin can become 40% fully loaded once you include shipping, returns, 3PL fees, BNPL costs, and payment processing. We've seen this pattern repeatedly - teams celebrate their gross margin while ignoring the costs that actually determine profitability. One DTC brand found that improving fully loaded gross margin from 40% to 60% increased their available marketing budget from EUR140k to EUR420k. That's the difference between treading water and scaling.
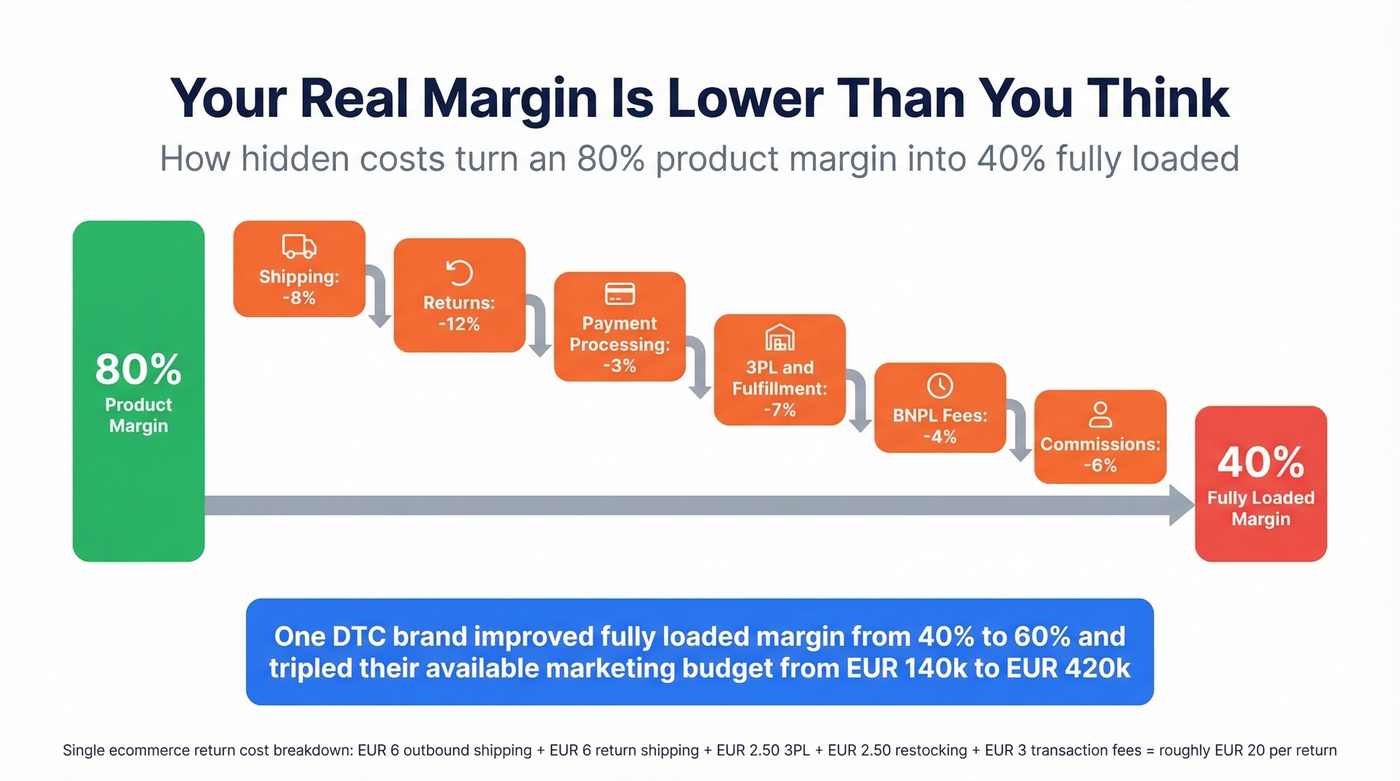
Start by itemizing every cost that touches a sale. A single ecommerce return can cost roughly EUR20: EUR6 outbound shipping + EUR6 return shipping + EUR2.50 3PL outbound + EUR2.50 restocking + roughly EUR3 in non-refundable transaction fees. With apparel return rates running 20-30%, that's a margin destroyer hiding in plain sight.
Offer Store Credit Over Refunds
Offering store credit instead of cash refunds keeps revenue in your ecosystem. 68% of customers who receive store credit make another purchase. That's not just margin protection - it's a second bite at the sale.
Set Smart Shipping Thresholds
Set your free shipping threshold at roughly 20% above your average order value. This nudges customers to add items rather than absorbing shipping costs on orders that can't support them. Simple change, measurable impact.
Restructure Commissions Around Margin
That flooring retailer from the intro? Their old system paid commissions on material markup. Salespeople learned to pad material prices while giving away labor at cost - protecting their commission while destroying overall deal profitability. Switching to margin-based commissions on a sliding scale aligned incentives with what actually matters: total deal margin, not line-item games.
If your reps are compensated on revenue or markup, they have zero incentive to protect margin. Restructure around margin percentage and watch behavior change overnight.
Cut Wasted Sales Costs
For sales-driven businesses, every bounced email and disconnected phone number is wasted SDR time that directly erodes your margin on each deal. If your team burns hours on bad contact data, that's a hidden cost sitting inside your fully loaded COGS. Tools like Prospeo - with 98% email accuracy and a 7-day data refresh cycle - keep outreach costs productive so reps spend time talking to prospects, not chasing dead leads.
Skip this section if you're purely product/ecommerce. But for any team running outbound, data quality is a margin lever most people overlook.
You just learned that overhead - not pricing - is often the real margin killer. Your sales team's prospecting time is overhead too. Prospeo cuts list-building from 15 hours to 2-3 hours per week with 300M+ verified profiles and 30+ filters to find the right buyers instantly.
Slash prospecting overhead and protect your bottom line.
FAQ
Is sales margin the same as gross margin?
Yes - same formula, different context. "Gross margin" appears in financial statements and investor decks; "sales margin" is the operational term sales and ops teams use when analyzing individual deals, product lines, or rep performance. The calculation is identical: (Revenue - COGS) / Revenue x 100.
What's the difference between margin and markup?
Margin is profit as a percentage of selling price; markup is profit as a percentage of cost. A $50 profit on a $150 sale is 33.3% margin but 50% markup. To hit a 50% margin target, you need a 100% markup - confusing the two misprices every product in your catalog.
What's a good sales margin for a small business?
Benchmark against your sector, not a cross-industry average. SaaS targets 70%+, ecommerce 40-50%, services 50%+. The all-industry average is 36.56% gross and 8.54% net per NYU Stern/Damodaran's 2026 data. If you're within 5 points of your industry median but still unprofitable, audit operating expenses before adjusting prices.
How can bad data hurt my sales margin?
Every bounced email or wrong phone number wastes SDR time, inflating your cost per deal. Teams switching from lower-accuracy providers typically see bounce rates drop from 35%+ to under 4%, directly improving fully loaded margin per closed deal.