Average CAC by Industry: 2026 Benchmarks From 4 Sources
Your CFO just asked what it costs to acquire a customer. You pulled a number from last quarter's dashboard, and it was 30% higher than the one you quoted during budget planning. That's not a fluke - average CAC has climbed 60% over the past five years and shows no sign of leveling off.
Most CAC benchmarks you'll find online pull from a single dataset. We synthesized four sources - FirstPageSage, Optifai (N=939), Benchmarkit, and Focus Digital - so you can benchmark with more confidence.
The short version: your industry's typical customer acquisition cost is higher than last year, up 222% over eight years. But the number that actually matters is your CAC payback period - median 15 months for B2B SaaS. Below you'll find multi-source benchmarks by industry, channel, and segment so you can stop guessing and start planning.
How Customer Acquisition Cost Is Calculated
Customer acquisition cost is the total you spend on sales and marketing to land one new customer:
CAC = Total Sales & Marketing Spend / New Customers Acquired
"Total spend" means everything: salaries, tools, ad budget, agency fees, onboarding costs. Most teams undercount by leaving out headcount or software subscriptions. If your product requires hands-on setup, excluding onboarding costs understates your true CAC - sometimes by 20% or more.
A quick example: your team spends $500K in Q1 across ads, SDR salaries, and tooling. You close 200 new customers. Your CAC is $2,500. Simple math, but the inputs are where teams get sloppy - and where benchmarks start to diverge.
Average CAC by Industry
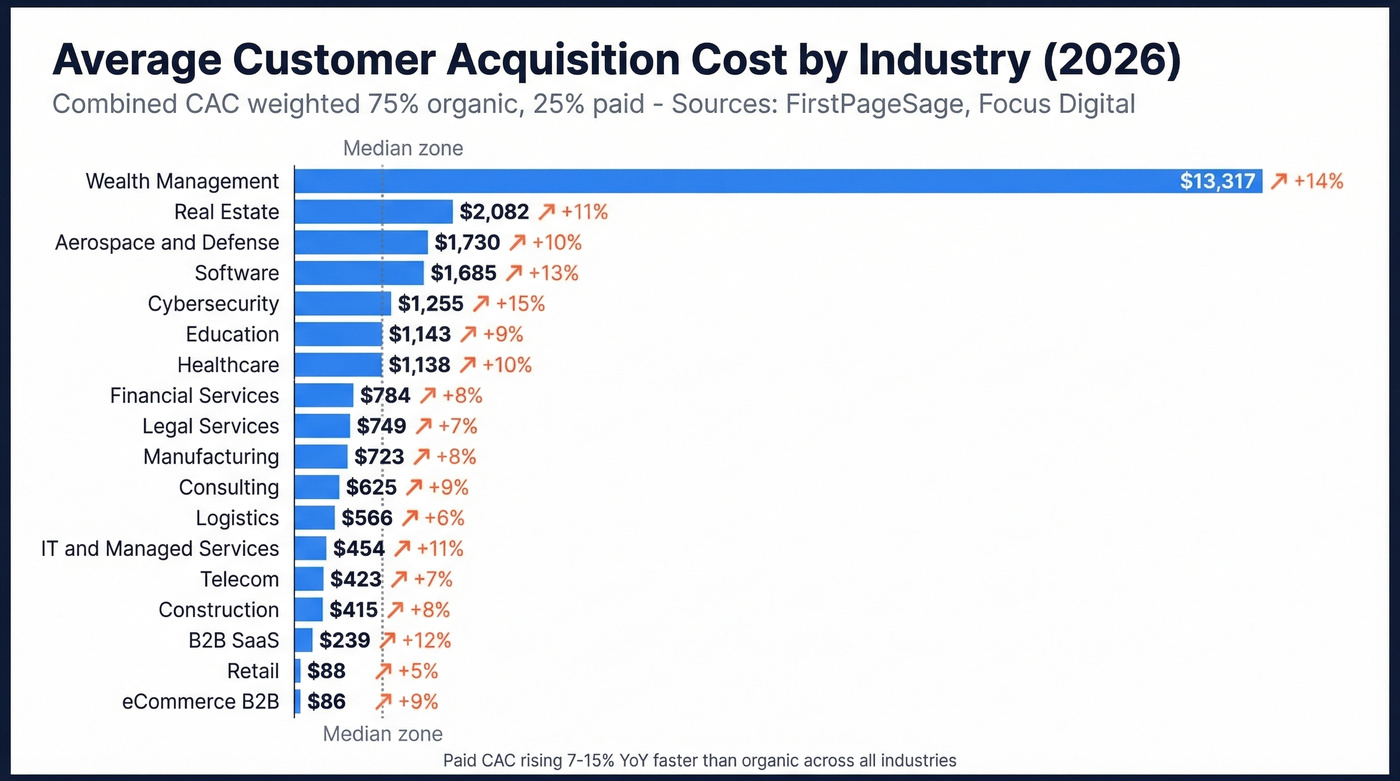
We cross-referenced FirstPageSage's 29-industry table with Focus Digital's YoY trend data to give you both the number and the direction it's heading.
One caveat on FirstPageSage's "combined" column: it's weighted 75% organic / 25% inorganic, reflecting their client mix. If your spend is heavier on paid, your real CAC will skew closer to the inorganic column.
| Industry | Organic CAC | Paid CAC | Combined* | YoY Trend |
|---|---|---|---|---|
| B2B SaaS | $205 | $341 | ~$239 | +6-12% |
| Software | $1,522 | $2,175 | ~$1,685 | +6% org / +12% paid |
| Financial Services | $644 | $1,202 | ~$784 | +5-8% |
| Education | $862 | $1,985 | ~$1,143 | +1-3% |
| Real Estate | $1,833 | $2,831 | ~$2,082 | +7% org / +15% paid |
| eCommerce (B2B) | $87 | $81 | ~$86 | +2-7% |
| Retail | $41 | $226 | ~$88 | +2% org / +7% paid |
| Wealth Mgmt | $11,834 | $17,768 | ~$13,317 | +8% org / +12% paid |
| Healthcare | $882 | $1,907 | ~$1,138 | +4-8% |
| Manufacturing | $662 | $905 | ~$723 | +3-5% |
| Cybersecurity | $1,062 | $1,835 | ~$1,255 | +6-10% |
| Legal Services | $584 | $1,245 | ~$749 | +5-8% |
| Telecom | $315 | $745 | ~$423 | +3-5% |
| Construction | $299 | $763 | ~$415 | +3-5% |
| Logistics | $510 | $732 | ~$566 | +3-5% |
| IT & Managed Services | $325 | $840 | ~$454 | +5-8% |
| Consulting | $533 | $901 | ~$625 | +4-7% |
| Aerospace & Defense | $1,510 | $2,390 | ~$1,730 | +4-6% |
*Combined = calculated from 75% organic / 25% paid weighting.
Sources: FirstPageSage B2B CAC report (Jan 2026) + Focus Digital trend data.
Paid CAC is rising faster than organic across every industry in Focus Digital's dataset - 7-15% YoY depending on vertical. Real estate and wealth management are seeing the steepest paid increases. eCommerce B2B remains an outlier where organic and paid CAC are nearly identical, likely because buyer intent is so transactional that channel matters less than offer.
Here's the thing: if you're only looking at the "combined" column, you're probably underestimating your actual acquisition cost. Most growth-stage companies run heavier on paid than the 75/25 weighting suggests. Use the organic and paid columns separately and weight them to your actual spend mix.
CAC by Channel
Channel selection is where you have the most direct control over acquisition costs. The 939-company B2B benchmark (Q1-Q3 2025) gives us the cleanest channel-level data, and Focus Digital adds ROI and break-even context.
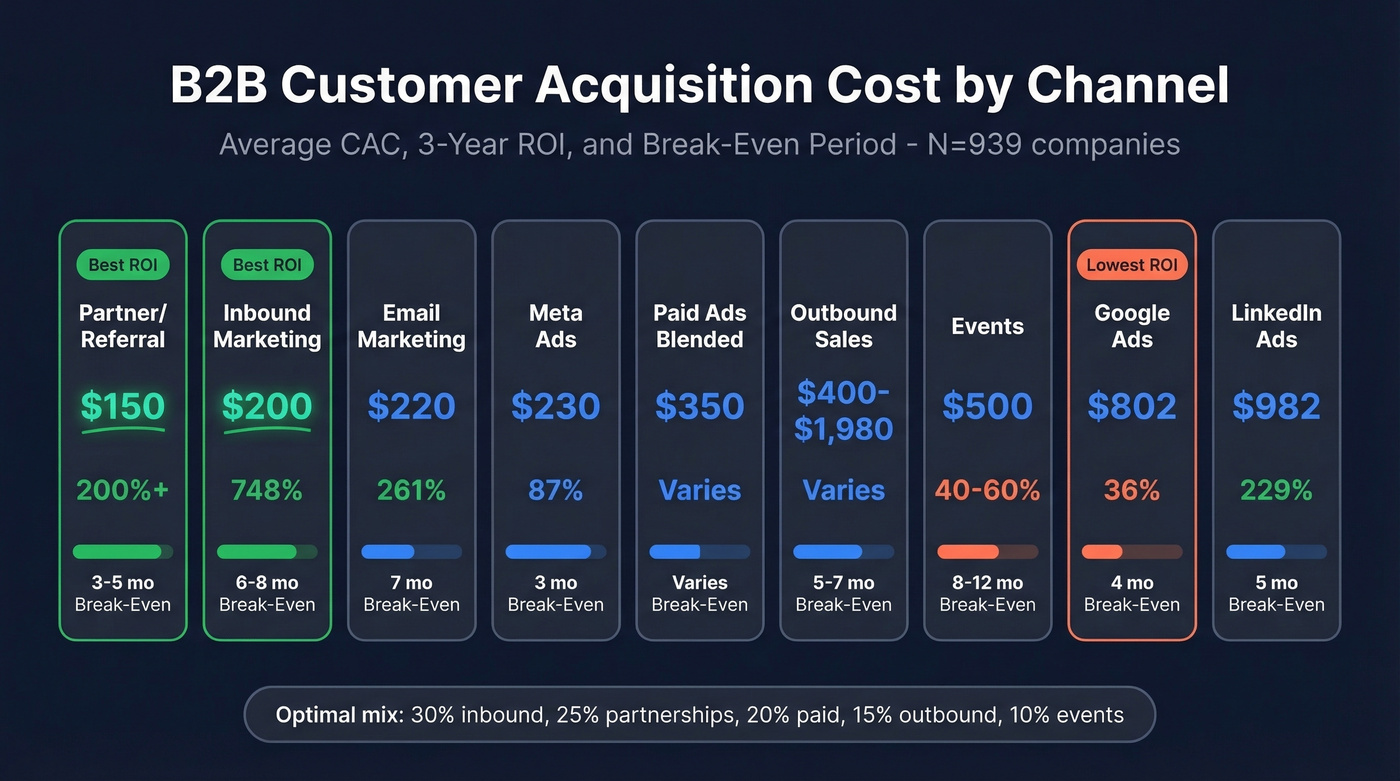
| Channel | Avg CAC | 3-Year ROI | Break-Even |
|---|---|---|---|
| Partner/Referral | $150 | 200%+ | 3-5 months |
| Inbound Marketing | $200 | 748% | 6-8 months |
| Email Marketing | $220 | 261% | 7 months |
| Meta (Facebook) Ads | $230 | 87% | 3 months |
| Paid Ads (blended) | $350 | Varies | Varies |
| LinkedIn Ads | $982 | 229% | 5 months |
| Google Ads (Paid Search) | $802 | 36% | 4 months |
| Outbound Sales | $400-$1,980 | Varies | 5-7 months |
| Events | $500 | 40-60% | 8-12 months |
The outbound range deserves explanation. The 939-company benchmark puts outbound at $400 average. Phoenix Strategy Group's broader B2B sample puts fully-loaded outbound at $1,980 - the gap depends on how you account for SDR salaries, tooling, and data costs. If your SDRs spend half their time on manual research, you're closer to $1,980. If they're running clean data through tight sequences, you're closer to $400.
If your deal sizes sit below $10K, you probably can't afford outbound at all. The math only works when your ACV justifies the per-rep cost. Below that threshold, double down on inbound and partnerships.
The optimal channel mix from the 939-company dataset: 30% inbound, 25% partnerships, 20% paid, 15% outbound, 10% events. Companies allocating 40-50% of budget to inbound and partnerships see roughly 30% lower overall CAC compared to outbound-heavy strategies.
That doesn't mean outbound is dead - it means outbound needs to be efficient. The $400 average includes a lot of waste: bad emails, wrong numbers, unqualified lists. We've seen teams cut their outbound costs by 30-40% just by fixing data quality before touching their sequences. Clean that up and the channel starts working again.
Budget allocation shifts by company size:
| Company Size | Top Channel | Secondary | Tertiary |
|---|---|---|---|
| Small (<$10M rev) | Social Ads (30%) | SEO (25%) | Paid Search (20%) |
| Mid-Market | Paid Search (30%) | Social Ads (25%) | SEO (20%) |
| Enterprise | Paid Search (35%) | SEO (15%) | Content (15%) |
Geography matters too. North American mobile app installs run $5.28 versus $0.50-$2.00 in Latin America - a 10x differential. If your product serves global markets, regional CAC arbitrage is one of the most underused levers available.
SaaS CAC Deep Dive
CAC by Vertical and Segment
SaaS acquisition costs vary wildly depending on who you're selling to. A $299 SMB eCommerce SaaS customer and a $14,772 enterprise fintech customer live in completely different universes.
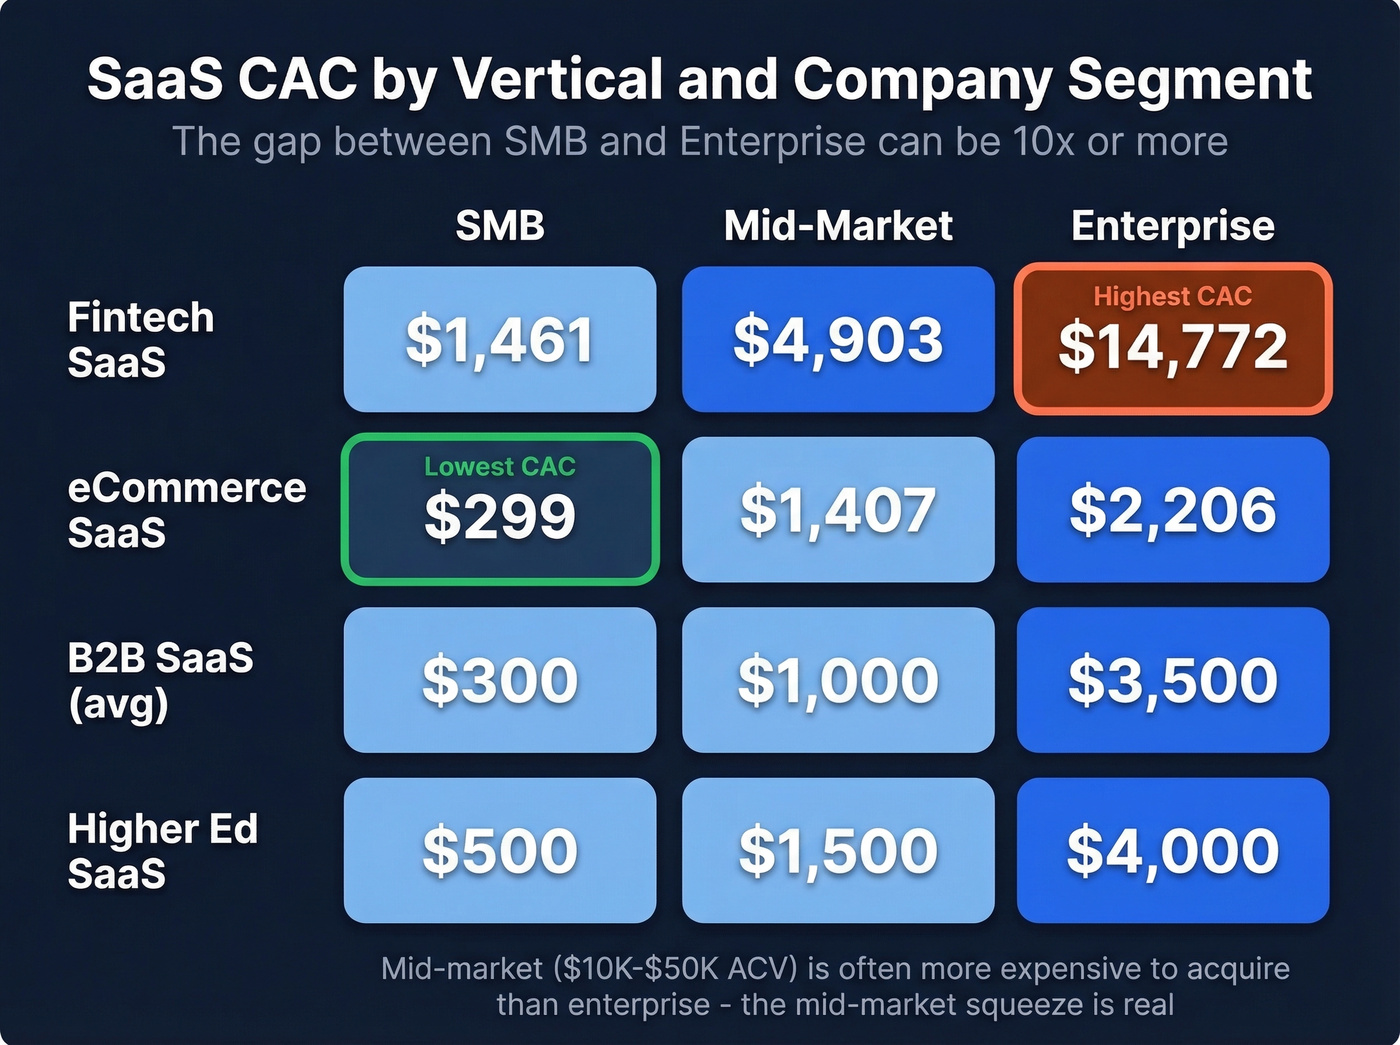
| Vertical | SMB | Mid-Market | Enterprise |
|---|---|---|---|
| Fintech SaaS | $1,461 | $4,903 | $14,772 |
| eCommerce SaaS | $299 | $1,407 | $2,206 |
| B2B SaaS (avg) | ~$300 | ~$1,000 | ~$3,500 |
| Higher Ed SaaS | ~$500 | ~$1,500 | ~$4,000 |
The fintech numbers are eye-opening. Enterprise fintech SaaS companies are spending nearly $15K to acquire a single customer - that only works if your ACV and retention justify it, which in fintech they often do.
The CAC Ratio: $2.00 Per $1 ARR
Benchmarkit's latest report puts the median New CAC Ratio at $2.00 - meaning the median SaaS company spends $2.00 in sales and marketing for every $1.00 of new ARR. That's up 14% year-over-year.
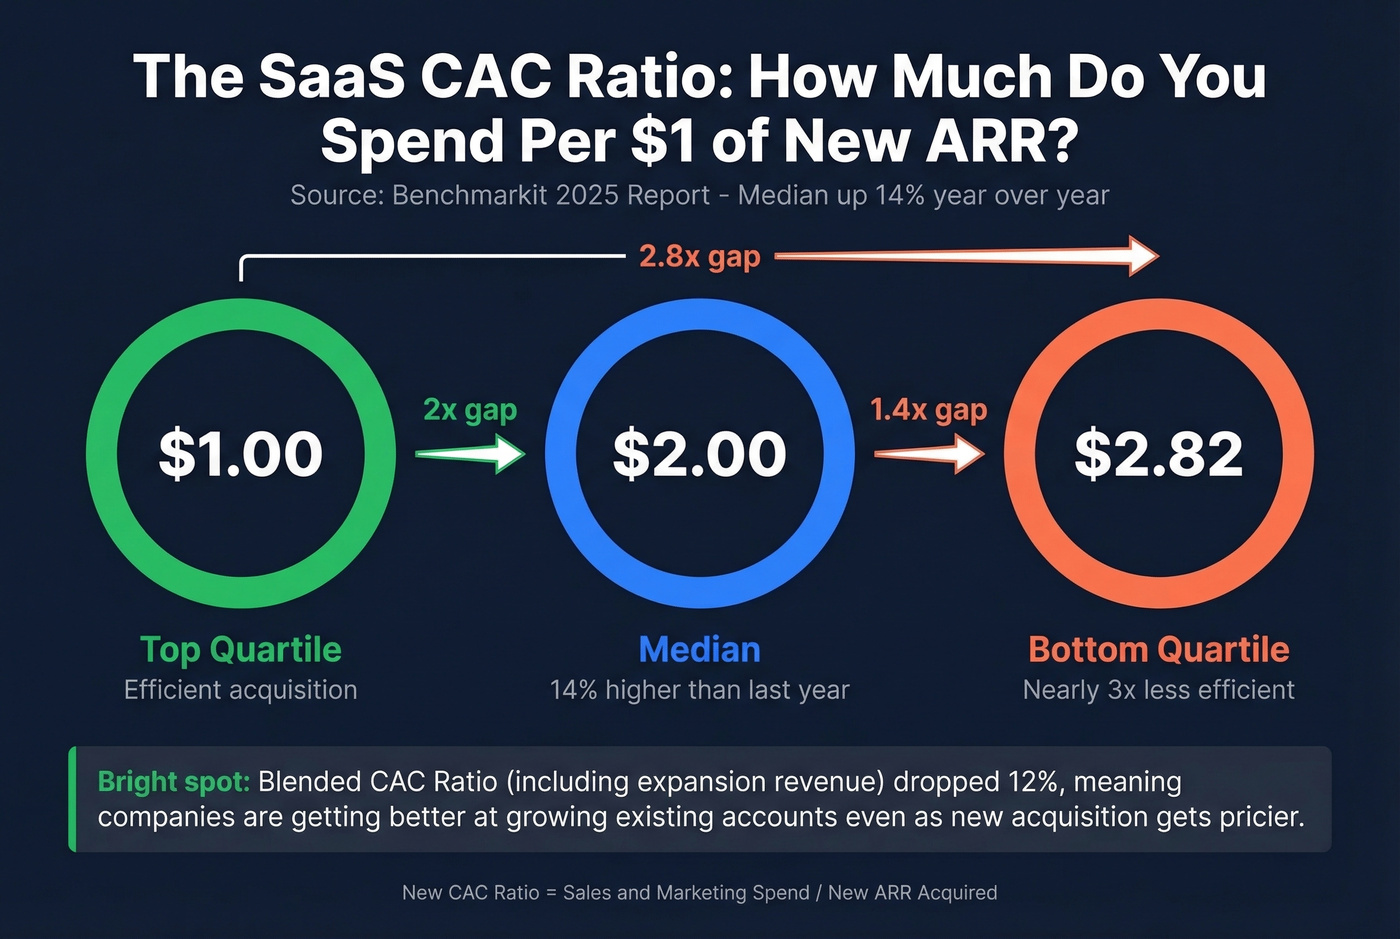
Top-quartile companies spend $1.00 per $1 ARR. Fourth-quartile companies spend $2.82. The gap between efficient and inefficient acquisition is nearly 3x.
One bright spot: the Blended CAC Ratio (which includes expansion revenue) dropped 12%, suggesting companies are getting better at expanding existing accounts even as new customer acquisition gets pricier. If you're not running an expansion playbook, you're leaving the easiest CAC improvement on the table.
One counterintuitive finding: $10K-$50K ACV solutions are often more expensive to acquire than $50K-$100K ACV deals. The mid-market squeeze is real - you need enterprise-grade sales motions without enterprise-grade deal sizes to absorb the cost.
The article shows outbound CAC ranges from $400 to $1,980 - and the gap is almost entirely data quality. Prospeo delivers 98% verified emails at $0.01 each, cutting the waste that inflates your cost per customer. Teams using clean Prospeo data report bounce rates under 4% and 26% more meetings booked.
Stop subsidizing bad data with your acquisition budget.
CAC Payback Period
Let's be honest: payback period matters more than CAC itself. A $5,000 CAC with a 6-month payback is infinitely better than a $500 CAC with a 24-month payback and 15% monthly churn.
Payback period and LTV:CAC are two sides of the same coin. A 3:1 LTV:CAC ratio with a 15-month payback is healthy; below 3:1 means you're spending more to acquire than you'll ever recover. Optimizing for payback - not just the raw number - is what separates sustainable growth from cash burn.
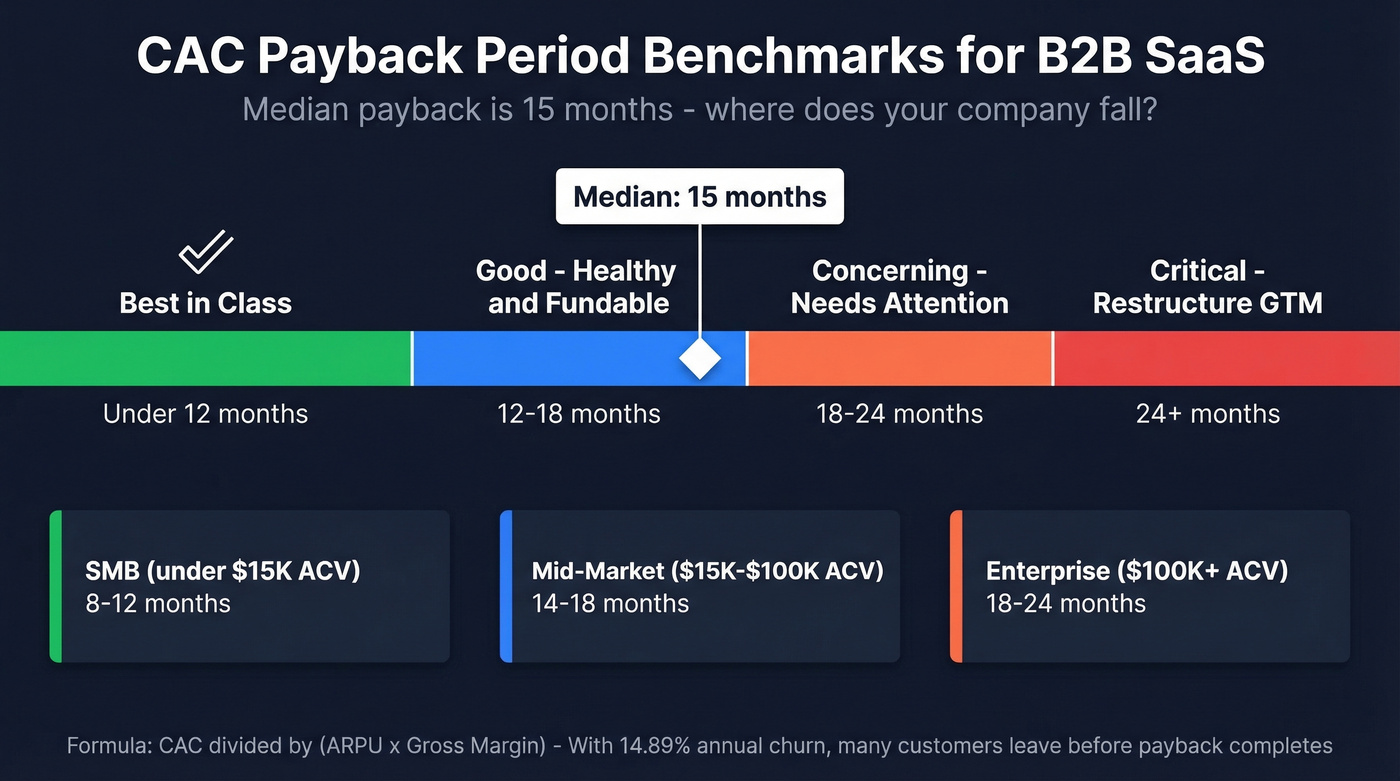
The 939-company benchmark puts the median B2B SaaS payback at 15 months:
| Band | Months | Assessment |
|---|---|---|
| Best-in-class | <12 | Strong unit economics |
| Good | 12-18 | Healthy, fundable |
| Concerning | 18-24 | Needs attention |
| Critical | >24 | Restructure GTM |
By segment, the ranges shift predictably. SMB companies with ACVs under $15K recover CAC in 8-12 months. Mid-market ($15K-$100K ACV) runs 14-18 months. Enterprise deals above $100K stretch to 18-24 months, which is acceptable given the deal sizes involved.
Two formulas exist for calculating payback. The standard version is CAC / (ARPU x Gross Margin) - if your CAC is $10,000, your monthly ARPU is $1,000, and your gross margin is 80%, your payback is 12.5 months. Some benchmarks use the simpler CAC / MRR, which overstates efficiency by ignoring margin. Know which one you're comparing against before you celebrate a "good" number.
With average B2B SaaS churn at 14.89% annually (HockeyStack Labs), a 15-month payback means you're losing a meaningful chunk of acquired customers before they break even. That makes churn reduction arguably a higher-ROI activity than CAC reduction for most teams.
FirstPageSage's payback data adds vertical color: eCommerce SaaS consumer payback averages just 4 months (good: 2 months), while fintech enterprise averages 23 months (good: 18 months). Retail SaaS enterprise can stretch to 31 months - nearly three years before you break even on acquisition.
If your payback period is creeping past 18 months and you're not selling six-figure enterprise contracts, something's broken in your funnel. Either your CAC is too high, your pricing is too low, or your churn is eating the math.
Why CAC Keeps Rising
CAC has surged 222% over eight years. The 60% five-year increase isn't a blip - it's structural. Three forces are driving it.
Ad platform saturation. Google Ads CPL increased 5.13% in 2025, and every B2B company is bidding on the same keywords. The consensus on r/ecommerce is blunt: ad-driven businesses are seeing higher cost per customer than last year, full stop.
Longer sales cycles. The average B2B SaaS sales cycle has stretched from 107 days in early 2022 to 134 days now. More touches, more meetings, more stakeholders - all of that costs money.
Broken attribution. iOS changes, cookie deprecation, and tighter consent rules mean your attribution models are increasingly wrong. When you can't measure what's working, you overspend on everything.
What Real Companies Pay
Benchmarks are useful. Practitioner numbers are better.
SaaS founder (r/SaaS): "My Google Ads CAC is $46 for a $50/mo product. Google shows 3 conversions, my database shows 5. The attribution is a mess. Google Ads is a rich person's game."
That $46 CAC on a $50/mo product means a payback period just under one month - if the attribution is right. At 3 conversions (Google's number), CAC jumps to $77 and payback stretches to 1.5 months. The gap between those two numbers is the difference between "this channel works" and "this channel barely works." Multiply that uncertainty across your entire budget and you see why so many founders are flying blind.
DTC advertiser (r/FacebookAds): "It's costing me $200 CAC for a $300 product, sometimes higher. This has been the norm since Feb 2024 - something changed. I'm worried about small business survival over the next few years."
These aren't outliers. They're the lived reality for founders running paid acquisition in 2026.
How to Reduce Your CAC
Shift Your Channel Mix
The single highest-leverage move is reallocating budget toward lower-CAC channels. Companies putting 40-50% of spend into inbound and partnerships see roughly 30% lower overall CAC. That's not a marginal improvement - it's the difference between a 12-month payback and a 17-month payback.
Fix Your Data Before Your Ads
The fastest way to cut outbound CAC isn't a new channel - it's verifying the data you already have. Bad emails bounce, bad phone numbers waste SDR time, and both inflate your cost per acquired customer without anyone noticing. When Meritt switched to Prospeo for email verification, their bounce rate dropped from 35% to under 4%, and pipeline tripled from $100K to $300K per week. At roughly $0.01 per verified email, the ROI math speaks for itself.
Skip this advice if you're running pure inbound with no outbound motion. But if SDRs are part of your GTM, data quality is the first thing to audit.
Invest in Compounding Channels
SEO delivers 748% ROI over three years. Email marketing returns 261%. The tradeoff is time - SEO takes 6-8 months to break even, and email needs a clean list to perform.
One hidden CAC inflator that our team sees constantly: email sequences bouncing above 3-5%. You're lighting money on fire and calling it a "channel test." The Meritt case above is a good illustration - their 35% bounce rate was silently multiplying their effective CAC before they fixed the underlying data.
Paid channels cost the same every month. Content and SEO get cheaper per acquisition over time. The best teams run paid for speed and organic for scale - and they verify every contact before it enters a sequence. That's how you bring acquisition costs down without sacrificing pipeline volume.
SDRs spending half their time on manual research is why your outbound CAC hits $1,980. Prospeo's 300M+ verified profiles with 30+ filters - intent data, technographics, job changes - give reps clean lists in minutes, not hours. One team cut list-building from 15 hours to 2-3 hours per week.
Move your outbound CAC from $1,980 to $400. Start with better data.
FAQ
What is a good customer acquisition cost?
A 3:1 LTV:CAC ratio is the standard benchmark - for every dollar spent acquiring a customer, you should generate three in lifetime value. The "good" number varies by industry: $239 is the B2B SaaS average, while eCommerce sits at $86 and wealth management at $13,317. All can be healthy if unit economics support them. Above 6:1 often signals underinvestment in growth.
How do you calculate CAC?
Divide your total sales and marketing spend by the number of new customers acquired in the same period. Include everything: salaries, tools, ad spend, agency fees, onboarding costs, and event sponsorships. Most teams undercount by excluding headcount, which makes their numbers look artificially low.
What's the average CAC for B2B SaaS?
The combined average is $239 per FirstPageSage's 29-industry benchmark, and $300 blended across channels per the 939-company dataset. SMB SaaS runs $100-$400, mid-market $400-$1,500, and enterprise can exceed $5,000 depending on vertical and sales cycle length.
How long should CAC payback take?
The median is 15 months for B2B SaaS. Best-in-class companies recover acquisition costs in under 12 months. Enterprise deals with 18-24 month payback periods are normal given higher ACVs. Anything beyond 24 months is a red flag that warrants GTM restructuring.
How can outbound teams lower their CAC quickly?
Fix data quality first - bad emails and wrong numbers silently inflate outbound costs by 30-40%. Verify contacts before they enter any sequence, eliminate wasted SDR time on dead leads, and watch your effective CAC drop within weeks, not months.