B2B Sales Funnel Metrics That Actually Matter in 2026
Every benchmark article gives you different numbers. Half are ChatGPT outputs - one Reddit poster literally admitted their "benchmarks" were what ChatGPT told them. Meanwhile, B2B sales cycles have lengthened 22% since 2022, buying committees have ballooned to 6.8 stakeholders (up from 5.4), and marketing teams still measure MQLs while finance measures CAC payback.
You don't need 22 B2B sales funnel metrics. You need seven - segmented by how you actually sell.
The Seven (and Three to Drop)
Track these:
- Stage-by-stage conversion rates (Lead → MQL → SQL → Opp → Close)
- Sales cycle length by ACV segment
- Weighted pipeline coverage ratio
- Sales velocity
- LTV:CAC ratio
- CAC payback period
- MQL-to-SQL quality ratio
Stop tracking: raw MQL volume, CRM activity counts, and unweighted pipeline size. All three reward volume over quality and hide the problems that actually kill quarters.
Stage-by-Stage Conversion Rates
A blended "our conversion rate is 3%" tells you nothing. You need stage-by-stage rates broken out by channel.
Martal's benchmarks put the broad B2B funnel at: Lead → MQL 35-45%, MQL → SQL 15%, SQL → Opp 25-30%, Opp → Close 6-9%. That MQL → SQL drop is the biggest leak in most funnels. But data from First Page Sage - 50+ B2B SaaS clients tracked over a decade - shows how much industry matters. B2B SaaS converts Lead → MQL at 39% with a 38% MQL → SQL rate, while cybersecurity sits at 24% Lead → MQL and reaches 46% at the SQL → Closed stage.
Channel matters just as much:
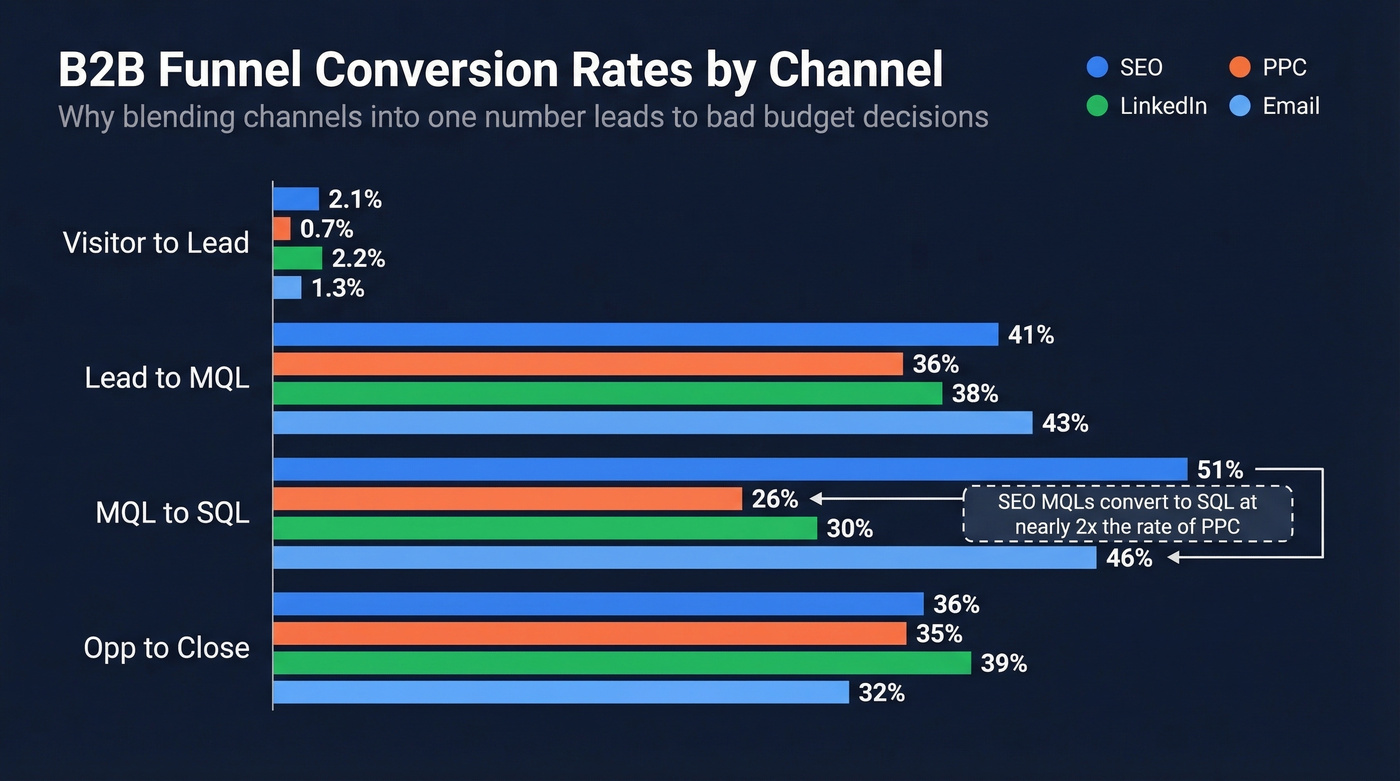
| Channel | Visitor → Lead | Lead → MQL | MQL → SQL | Opp → Close |
|---|---|---|---|---|
| SEO | 2.1% | 41% | 51% | 36% |
| PPC | 0.7% | 36% | 26% | 35% |
| 2.2% | 38% | 30% | 39% | |
| 1.3% | 43% | 46% | 32% |
SEO MQLs convert to SQL at about double PPC (51% vs 26%). If you're blending these into one number, you're making bad budget decisions.
Sales Cycle Length by ACV
The Optifai Pipeline Study (939 B2B SaaS companies) puts the median cycle at 84 days. That number is useless without ACV segmentation:
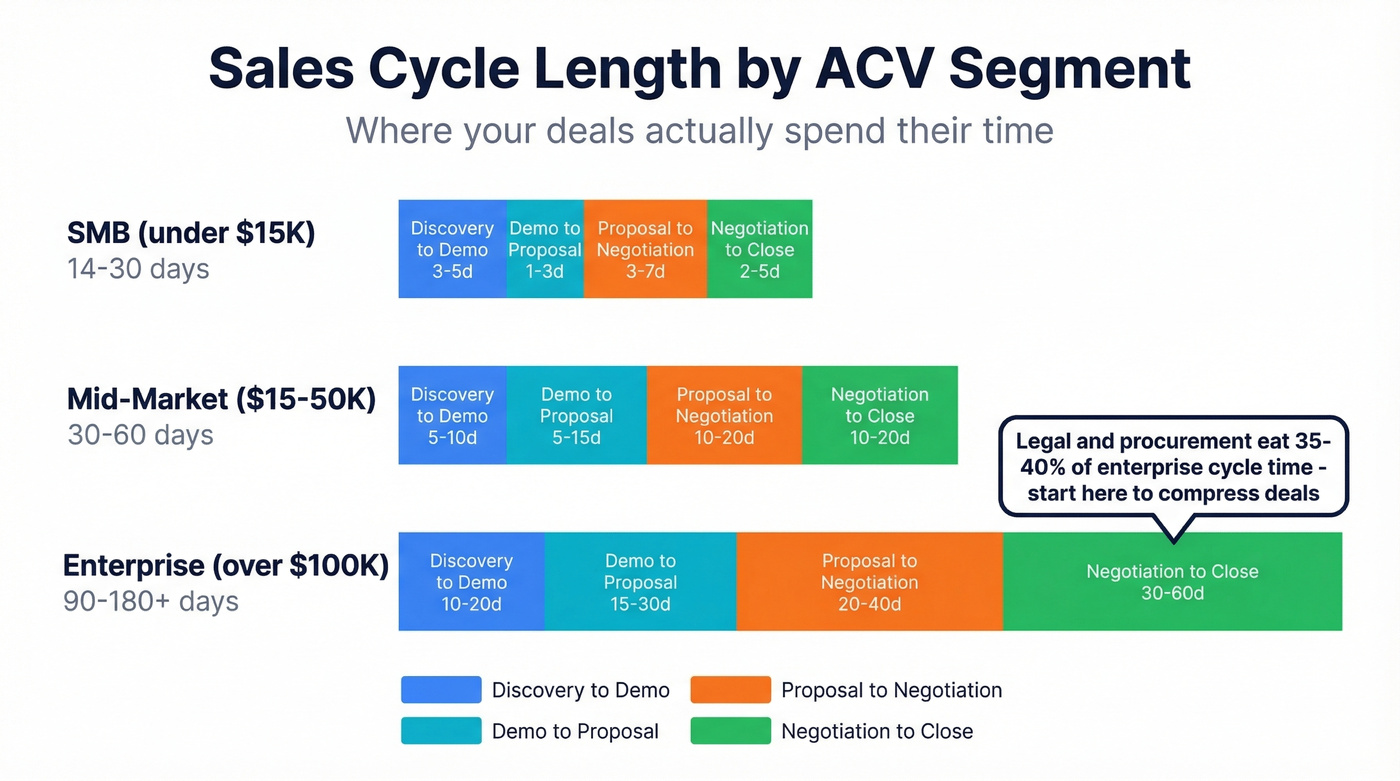
| ACV Segment | Cycle Length | Discovery → Demo | Demo → Proposal | Proposal → Negotiation | Negotiation → Close |
|---|---|---|---|---|---|
| SMB (<$15K) | 14-30d | 3-5d | 1-3d | 3-7d | 2-5d |
| Mid ($15-50K) | 30-60d | 5-10d | 5-15d | 10-20d | 10-20d |
| Enterprise (>$100K) | 90-180d+ | 10-20d | 15-30d | 20-40d | 30-60d |
For enterprise deals, Negotiation → Close eats 35-40% of total cycle time. Legal and procurement are the #1 delay drivers, not buyer indecision. If you're trying to compress enterprise cycles, start with procurement workflows - not faster demos.
Pipeline Coverage That Tells the Truth
Your VP says coverage is 4x. Your CRO asks how much has moved in 30 days. Silence.
Here's the stat that explains why: 61% of B2B marketers send all leads directly to sales, but only 21% are actually qualified. That's how pipelines get inflated with deals that'll never close.
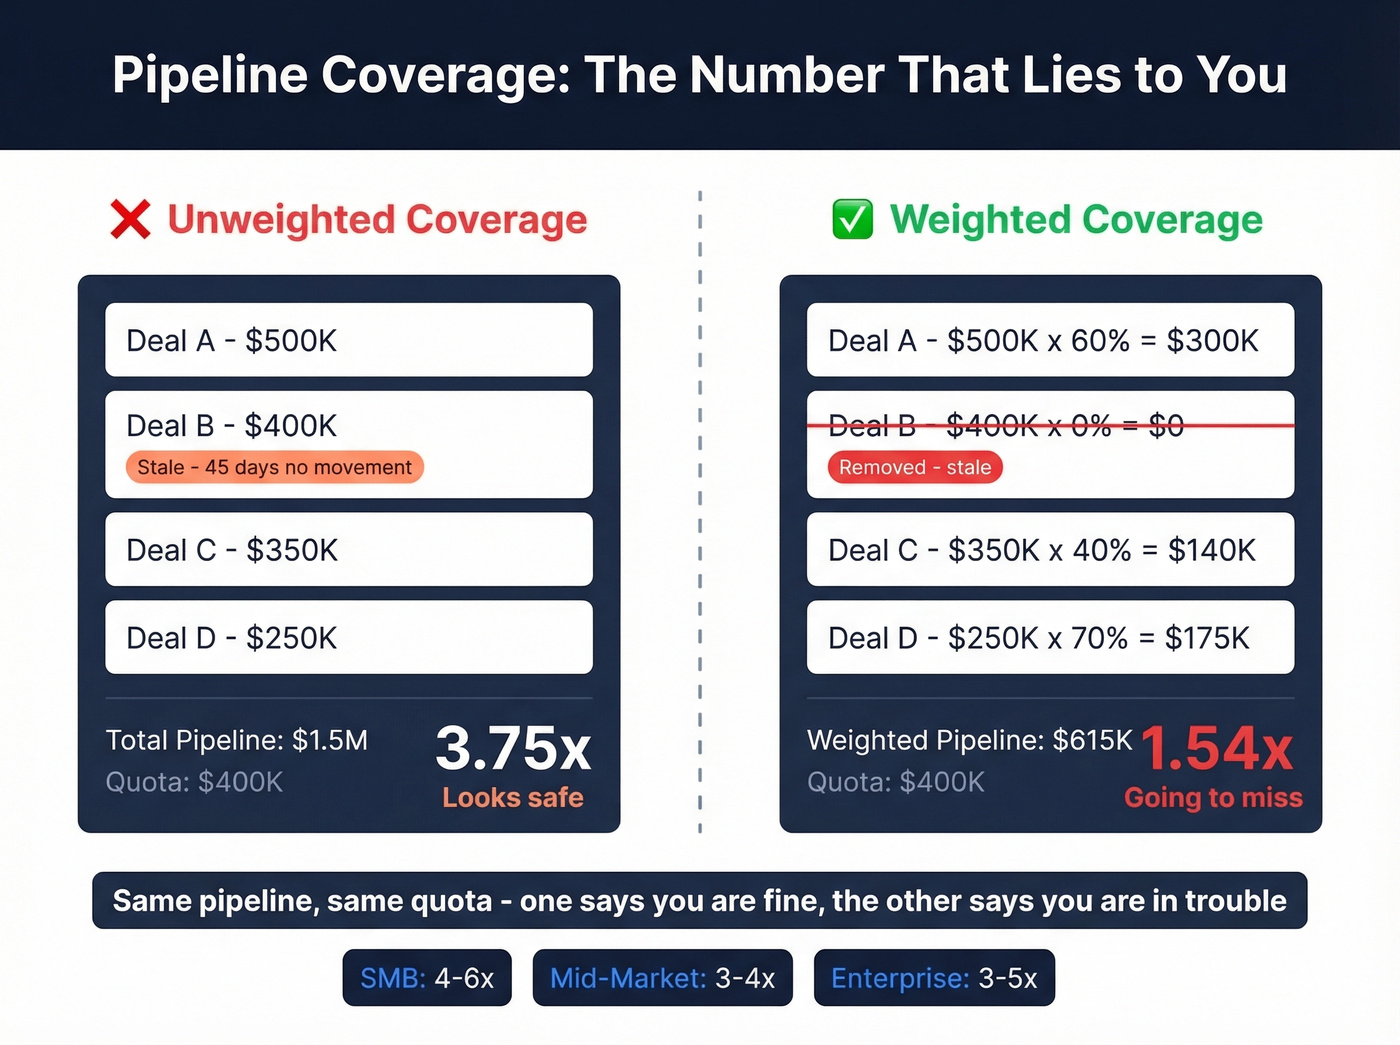
Enterprise deals with 6+ month cycles and 15-25% win rates need 3-5x coverage. Mid-market deals running 2-4 month cycles at 25-35% win rates need 3-4x. SMB velocity plays closing under 2 months at 30-45% win rates need 4-6x. New territory or product launches? Budget 5-7x.
The critical distinction is weighted vs. unweighted. Unweighted treats every deal as 100% likely to close. Weighted multiplies deal value by stage probability. If you're reporting unweighted, you're lying to yourself.
We've watched a $1.5M pipeline against a $400K quota look like comfortable 3.75x coverage - until we flagged $400K in deals that hadn't moved stages in 45 days. Real coverage: 2.75x. That's the difference between "we're fine" and "we're going to miss."
Pipeline coverage ratios lie when stale deals sit in your CRM. They lie even harder when 80% of your MQLs have bad emails. Prospeo's 7-day data refresh and 98% email accuracy mean every lead in your funnel is real - not a phantom inflating your coverage ratio.
Stop measuring a pipeline built on bad data.
Sales Velocity Formula
Formula: (Opportunities x Avg Deal Size x Win Rate) / Cycle Length = Revenue per Day
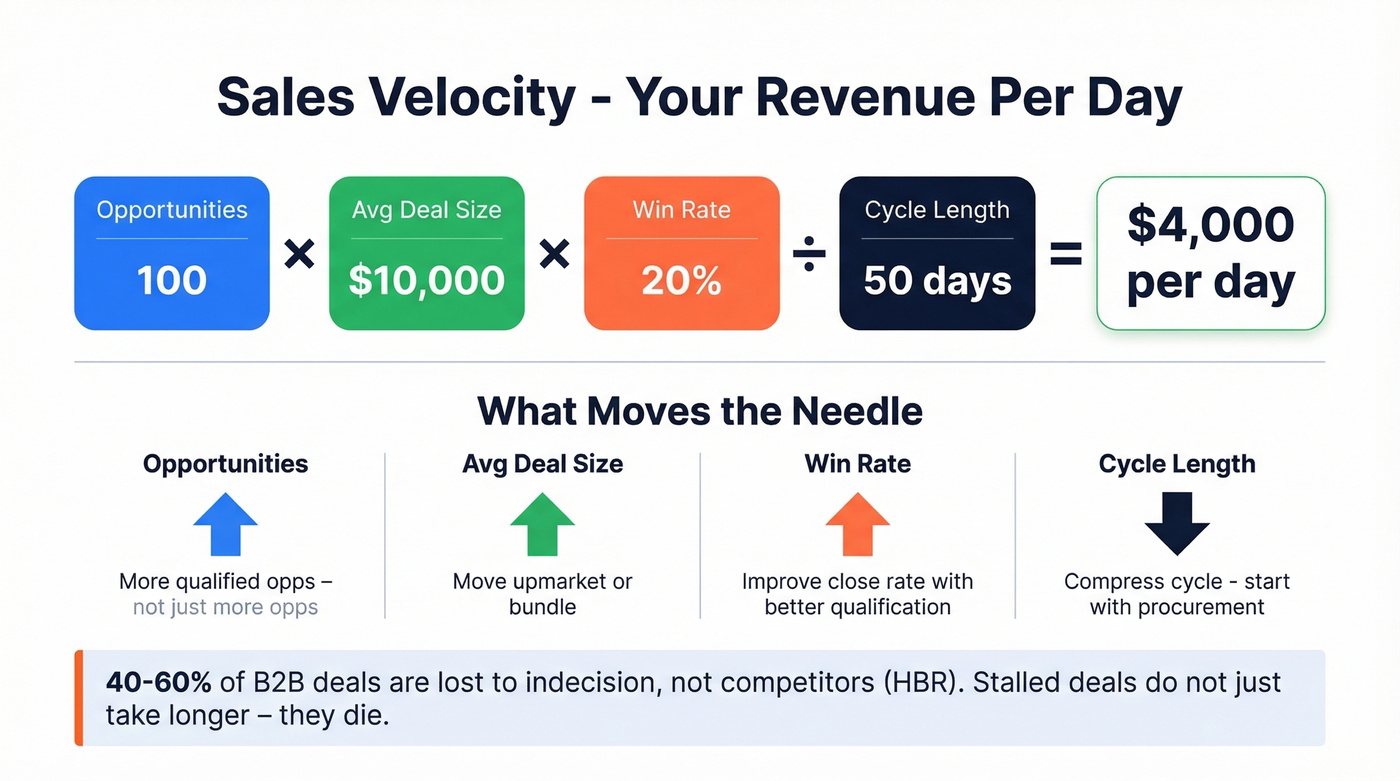
Worked example: 100 qualified opps x $10,000 ACV x 20% win rate / 50 days = $4,000/day.
There's no universal "good" velocity number. What matters is the trend. If velocity drops quarter over quarter, one of the four inputs is degrading and you need to find which one. Teams pushing further are tracking revenue per rep hour and contribution margin by region, but velocity is the foundation.
One stat worth internalizing: per HBR research, 40-60% of B2B deals are lost to indecision, not to competitors. Deals that stall don't just take longer. They die.
Unit Economics: LTV:CAC and Payback
Use the 3:1 LTV:CAC benchmark if you're a mature SaaS company with predictable churn. The Optifai dataset puts the median at 3.2:1 across 939 companies. Skip it if you're pre-PMF or selling into a new segment - CAC payback period is more actionable at that stage.
Target payback: SMB under 12 months, mid-market under 18, enterprise under 24. And if your LTV:CAC is 5:1 or higher, don't celebrate - that often signals you're under-investing in growth.
Vanity KPIs to Stop Tracking
A Morton Kyle poll asked sales leaders which metric is most dangerous to obsess over. 47% said CRM activity counts. 37% said pipeline size. They're right on both.
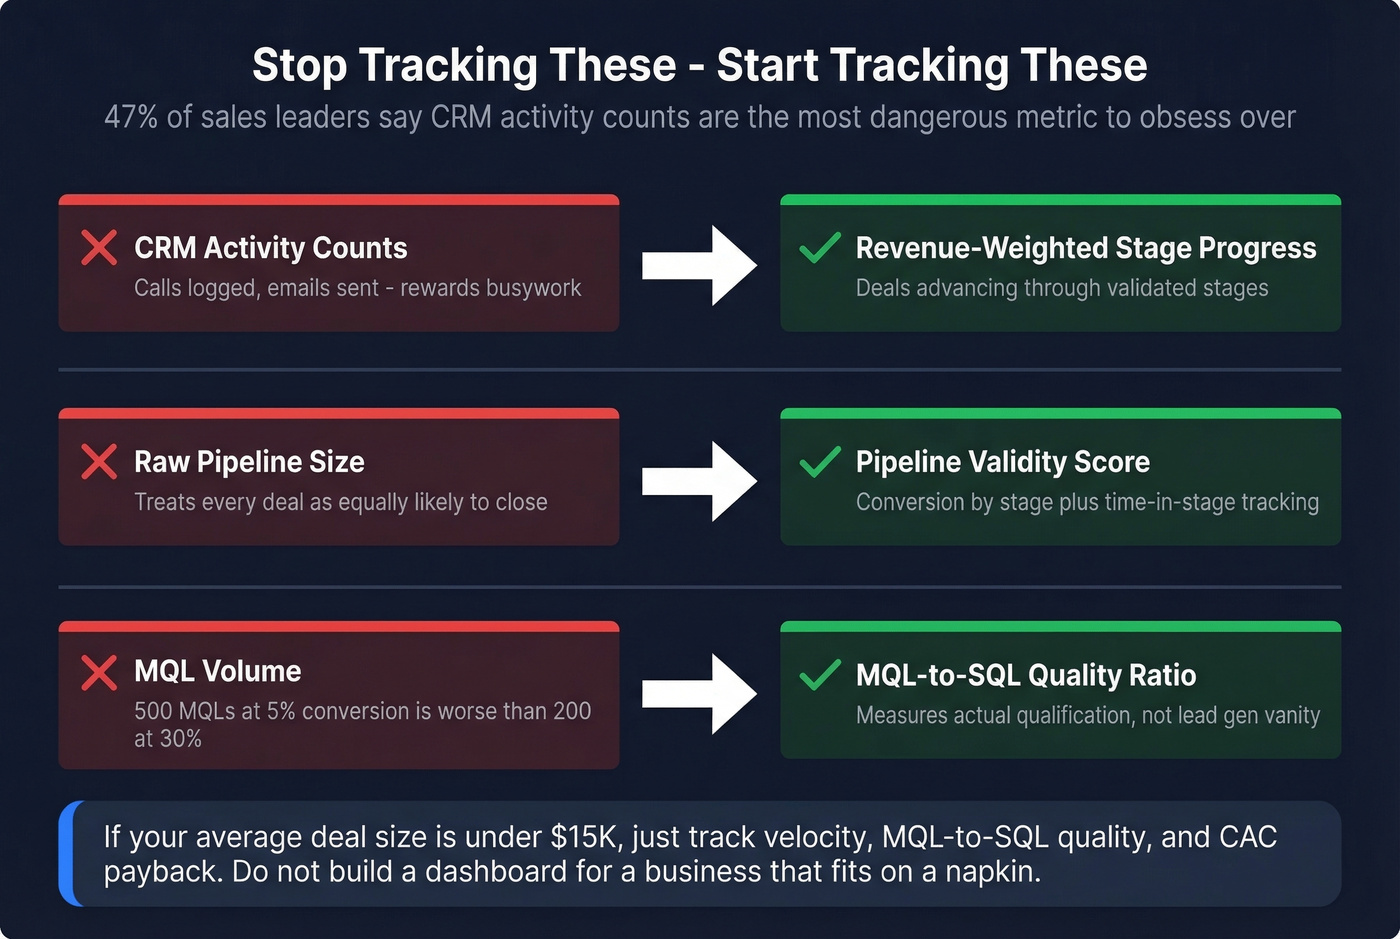
Three swaps to make today:
- Replace activity counts with revenue-weighted stage progress. Calls logged means nothing. Deals advancing through validated stages means everything.
- Replace raw pipeline size with pipeline validity. Track conversion by stage and time in stage.
- Replace MQL volume with MQL-to-SQL quality ratio. 200 MQLs converting at 30% crush 500 converting at 5%.
Let's be honest: if your average deal size is under $15K, you probably don't need half these metrics. Track velocity, MQL-to-SQL quality, and CAC payback. That's it. The seven-metric framework is for teams running multi-segment funnels with real pipeline complexity. Don't build a dashboard for a business that fits on a napkin.
Making Your Metrics Accurate
Keep your CRM dashboard to 5-7 reports - that's the cognitive limit before adoption drops. Tailor views by role: your VP sees pipeline coverage and velocity, reps see stage progress and next actions. Run joint sales and marketing reviews monthly to recalibrate MQL/SQL definitions, because definitions drift and when they do, your conversion rates become meaningless.
None of this matters if your underlying contact data is garbage. We've seen teams report 500 MQLs where 80% had bad emails - their MQL → SQL rate looked terrible, but the real problem was data quality, not qualification. Snyk's 50-person AE team saw bounce rates of 35-40% before switching to Prospeo; after, bounces dropped under 5% and AE-sourced pipeline jumped 180%. That's 200+ new opportunities per month that actually reflected real buyer engagement, not phantom leads inflating the top of funnel. With 98% email accuracy and a 7-day refresh cycle, your funnel conversion rates reflect actual buyer qualification - not bounced emails polluting every stage.
Once you've nailed these seven metrics, the next frontier is cohort analysis and multi-touch attribution. Get the foundation right first.
Your MQL-to-SQL rate tanks when reps waste hours chasing bounced emails and dead numbers. Snyk's 50 AEs cut bounce rates from 35% to under 5% with Prospeo - and AE-sourced pipeline jumped 180%. That's what happens when every metric in your funnel reflects real buyers.
Make every stage conversion rate actually mean something.
FAQ
What's a good MQL-to-SQL conversion rate?
Expect 15-38% depending on industry and channel. B2B SaaS averages 38%; broader B2B sits near 15%. SEO-sourced leads convert to SQL at 51% vs. 26% for PPC - channel segmentation matters more than a single blended number.
How do you calculate sales velocity?
Multiply qualified opportunities by average deal size by win rate, then divide by cycle length in days. Always segment by deal type - blending SMB and enterprise produces a number that describes neither accurately.
How does bad contact data distort funnel metrics?
If 35-40% of emails bounce, top-of-funnel inflates while mid-funnel conversion collapses. You diagnose a qualification problem when you actually have a data problem. Re-verifying contacts on a weekly cycle and maintaining 98%+ accuracy ensures your MQL → SQL rate reflects real qualification, not dead addresses.
What pipeline coverage ratio should B2B teams target?
Target 3-5x weighted coverage for enterprise deals (15-25% win rates), 3-4x for mid-market, and 4-6x for SMB velocity plays. Always use weighted coverage - unweighted treats every deal as equally likely to close and consistently overstates your position.