Cost to Acquire Customer: The 2026 Practitioner's Guide to Calculating, Benchmarking, and Reducing CAC
The cost to acquire a customer has surged roughly 40% in two years in ecommerce. The median SaaS company's New CAC Ratio rose 14% in 2024 to $2.00 - meaning the median company spent $2.00 to acquire $1.00 of new ARR. And the number on your board deck is almost certainly wrong, because most teams calculate a half-loaded version that makes their unit economics look twice as healthy as they actually are.
Here's everything you need to know about customer acquisition cost in 2026: how to calculate it honestly, what "good" looks like by industry and channel, and the specific levers that actually bring it down.
The Quick Version
The formula: CAC = Total Sales & Marketing Costs / New Customers Acquired . But "total" means fully loaded - salaries, tools, creative, overhead. Not just ad spend.
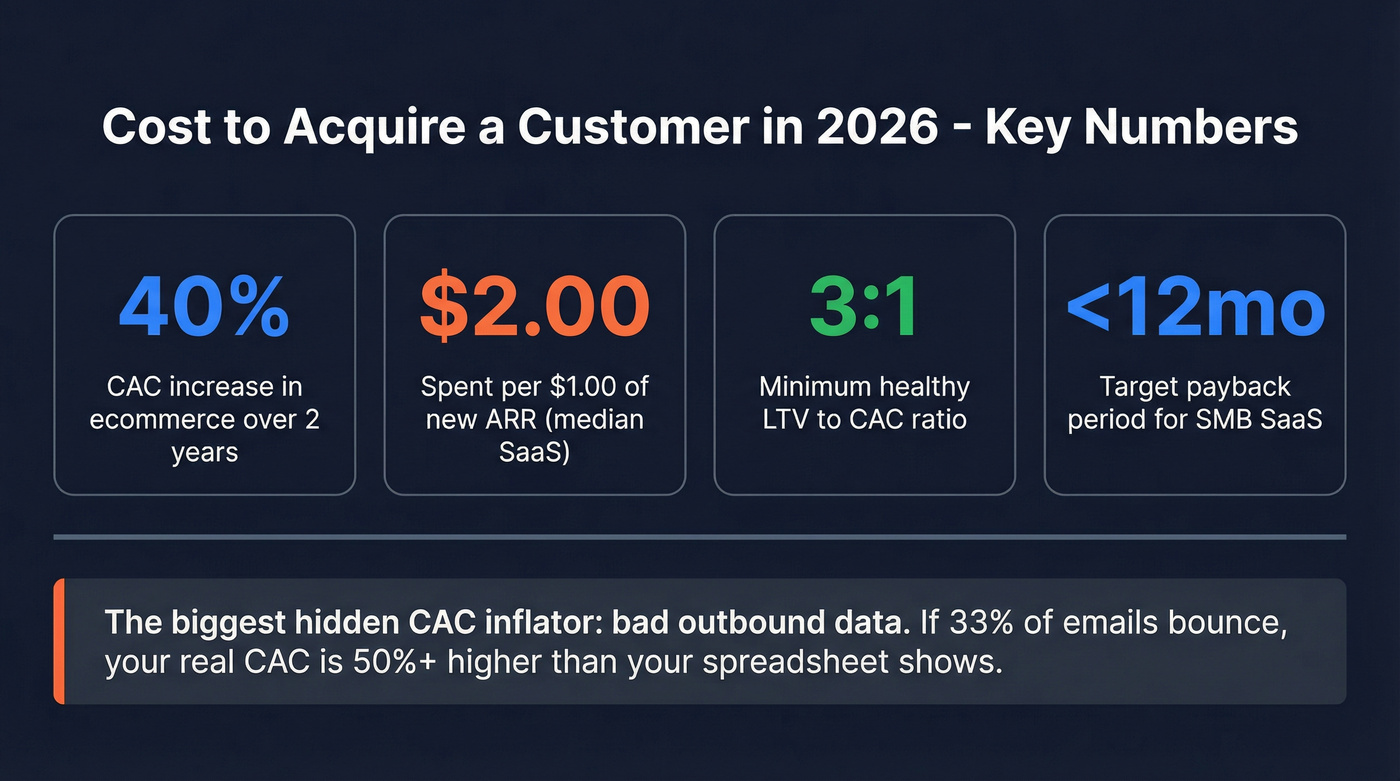
What "good" looks like: An LTV:CAC ratio of at least 3:1, with a payback period under 12 months for SMB and under 18 months for mid-market. Above those thresholds, you've got a problem - even if the board deck says otherwise.
The biggest hidden inflator most teams miss: Bad outbound data. If a third of your emails bounce, your real CAC is 50%+ higher than what your spreadsheet shows. Every bounced email still costs you SDR time, tool fees, and domain reputation.
2026 benchmarks: Jump to the industry table or the channel breakdown below.
What Is Customer Acquisition Cost?
Customer acquisition cost is the total amount you spend to turn a stranger into a paying customer. Not a lead. Not a trial signup. A customer who's given you money.
The formula is deceptively simple:
CAC = (Total Sales & Marketing Costs) / (Number of New Customers Acquired)
The hard part isn't the math - it's deciding what goes in the numerator. In practice, the most heated CAC debates aren't about the formula itself; they're about whether to include salaries, overhead, and tooling costs. That dividing line - fully loaded versus ad-spend-only - separates teams that understand their unit economics from teams that are fooling themselves.
CAC vs CPA
These get confused constantly, and the distinction matters for how you report to investors and optimize spend. If you need a deeper breakdown, see CAC vs CPA.
| CAC | CPA | |
|---|---|---|
| Measures | Cost per paying customer | Cost per any action |
| Actions counted | Closed-won deals only | Leads, signups, trials, downloads |
| Includes | All sales + marketing costs | Usually just campaign spend |
| Example | $600 per customer | $15 per demo request |
CPA is a campaign metric. CAC is a business metric. Your Facebook CPA might be $30, but your actual acquisition cost per customer - once you account for the sales team that closes those leads - could be $600. Conflating the two is one of the most common mistakes in SaaS finance, and it makes your unit economics look artificially healthy.
How to Calculate CAC the Right Way
The Fully Loaded Checklist
Here's what belongs in your CAC numerator:
- Advertising spend - Google, Meta, programmatic, sponsorships
- Salaries and benefits - SDRs, AEs, marketing team, demand gen, content
- Sales and marketing tools - CRM, sequencing, data providers, analytics
- Creative and production - design, video, copywriting, freelancers
- Agency fees - if you outsource any acquisition activity
- Platform and infrastructure fees - marketing automation, attribution tools
- Overhead allocation - the portion of rent, equipment, and admin that supports acquisition
If an SDR spends 80% of their time on new business acquisition, 80% of their fully loaded comp goes in the numerator. This is where most teams under-count.
New CAC vs Blended CAC
New CAC counts only net-new customers in the denominator and only acquisition-specific spend in the numerator. This is what investors care about and what you should use for growth planning.
Blended CAC divides all sales and marketing spend by all customers - including expansions, upsells, and renewals. It's useful for high-level efficiency tracking but terrible for decision-making because it dilutes the real cost to acquire new logos.
Stop obsessing over blended CAC. It's a vanity metric that makes everyone feel better. Channel-level new CAC is what actually changes decisions.
Worked Example
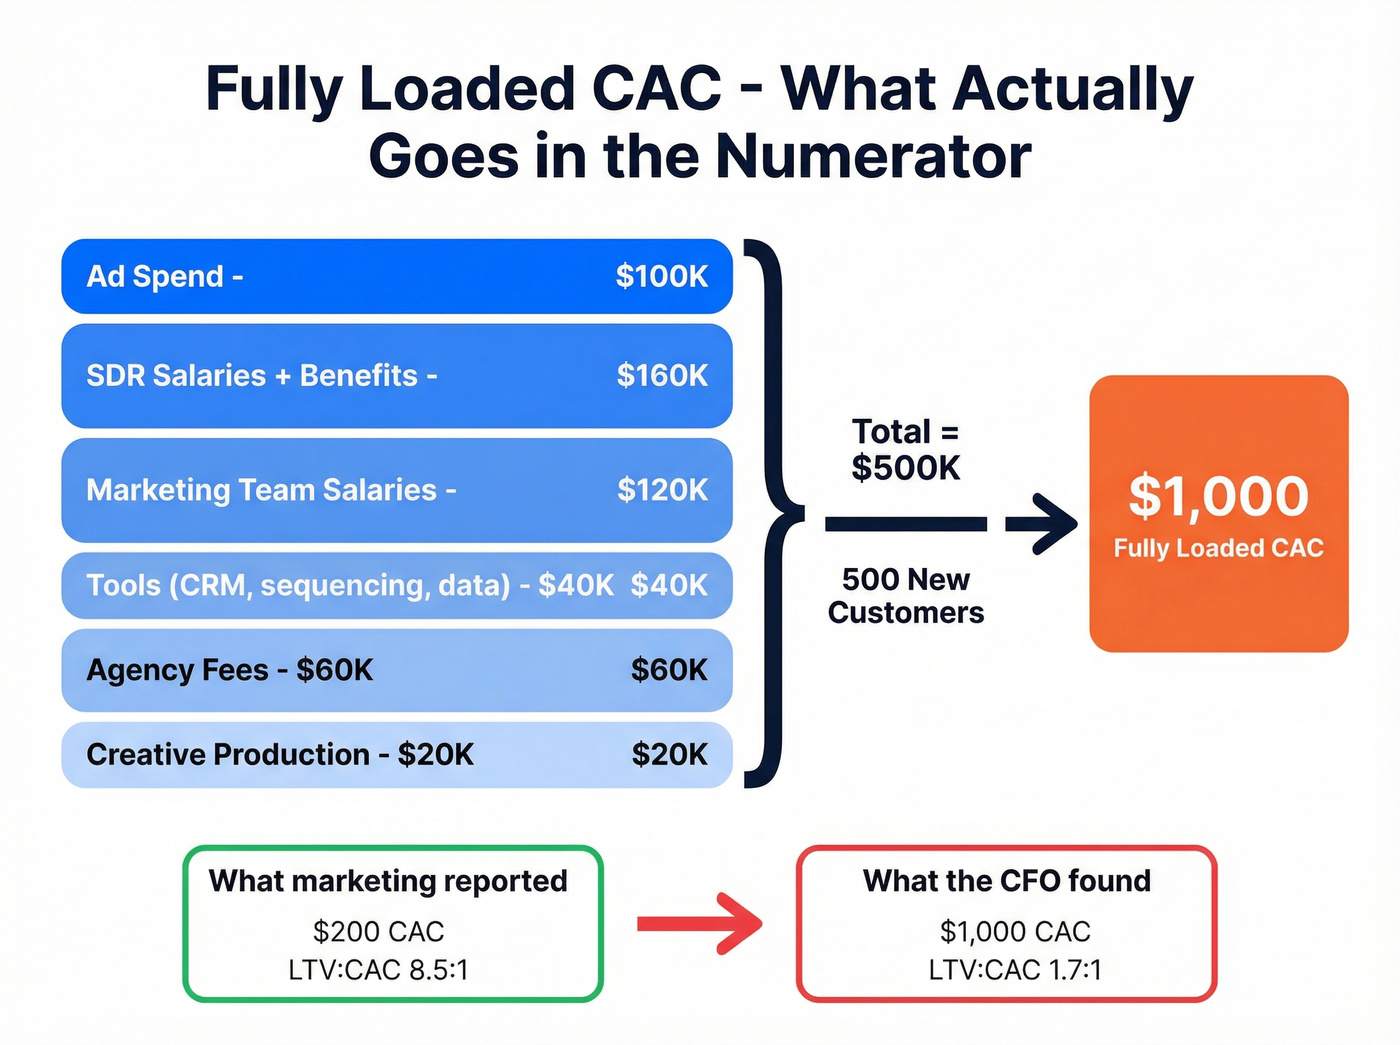
Your marketing team tells the board: "We spent $100K on ads and acquired 500 customers. CAC is $200." The board nods.
Then the CFO runs the real numbers. Ad spend was $100K, but the two SDRs cost $160K fully loaded, the marketing manager is $120K, tools run $40K/year, the agency bill was $60K, and creative production added $20K. That's $500K in total acquisition spend. $500K divided by 500 customers = $1,000 fully loaded CAC. If your average customer LTV is $1,700, your LTV:CAC ratio just dropped from a comfortable-sounding 8.5:1 to a concerning 1.7:1. Same business, same quarter - completely different story depending on which costs you include.
This is the gap that kills startups. Not bad products, not bad markets - bad math.
Average CAC by Industry (2026)
CAC by Industry
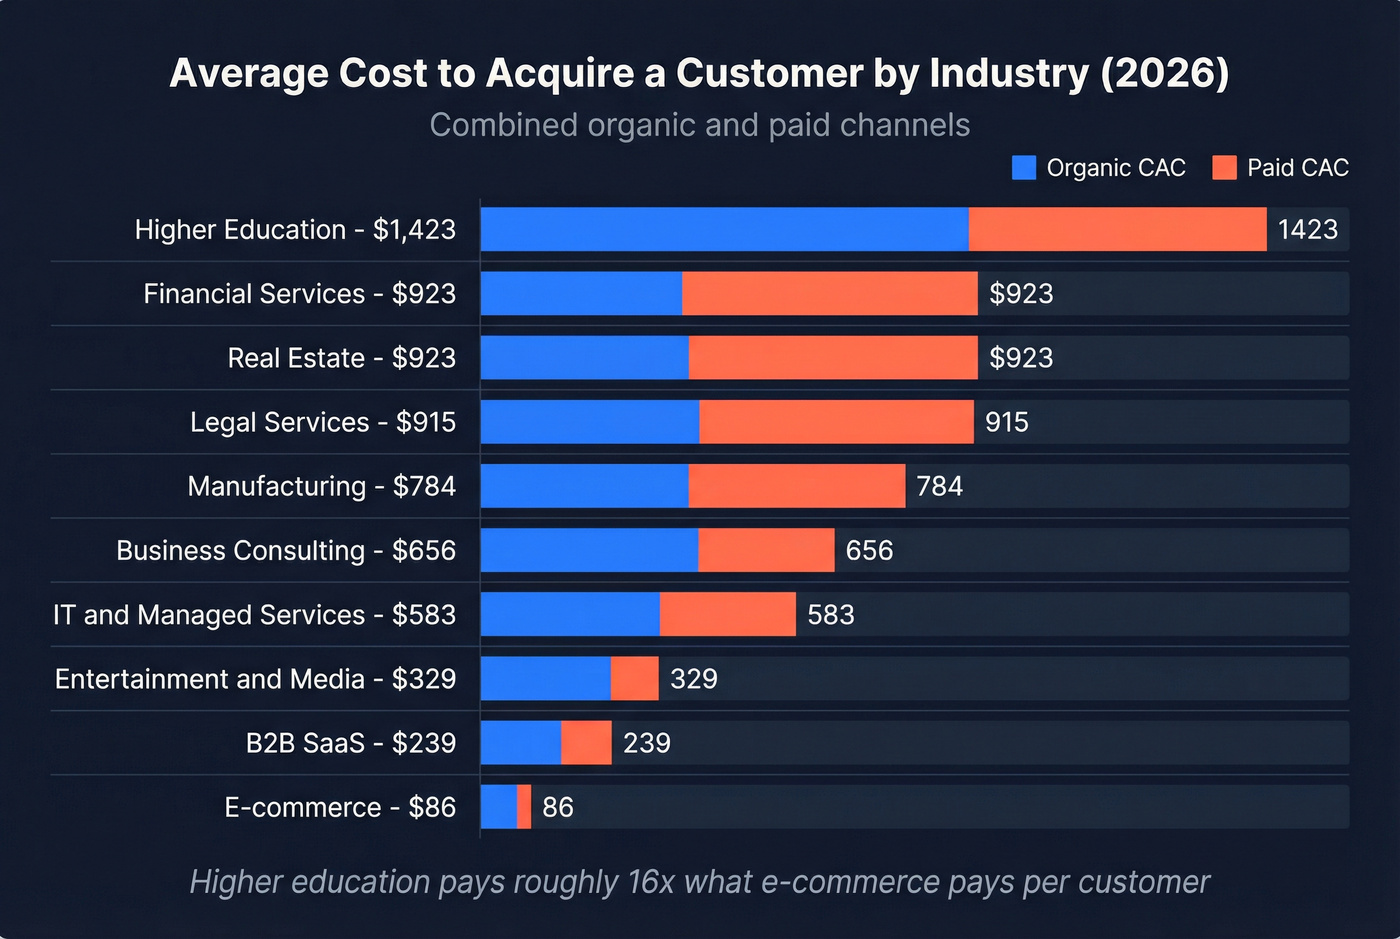
These benchmarks represent combined averages across organic and paid channels, compiled from FirstPageSage's industry dataset.
| Industry | Organic CAC | Paid CAC | Combined CAC |
|---|---|---|---|
| Higher Education | ~$862 | ~$1,985 | ~$1,423 |
| Financial Services | ~$644 | ~$1,202 | ~$923 |
| Legal Services | ~$584 | ~$1,245 | ~$915 |
| Real Estate | ~$660 | ~$1,185 | ~$923 |
| Manufacturing | ~$475 | ~$1,094 | ~$784 |
| Business Consulting | ~$410 | ~$901 | ~$656 |
| IT & Managed Services | ~$385 | ~$780 | ~$583 |
| Entertainment & Media | ~$190 | ~$468 | ~$329 |
| B2B SaaS | ~$205 | ~$341 | ~$239 |
| E-commerce | ~$87 | ~$81 | ~$86 |
The spread is massive. Higher education pays about 16x what e-commerce pays per customer. Benchmarking against "average CAC" without industry context is meaningless.
A note on conflicting benchmarks: You'll see other sources report B2B SaaS CAC closer to $1,200. The gap comes down to methodology - benchmarks that include organic customers in the denominator pull the average down significantly, while sources measuring only paid acquisition channels report much higher numbers. When you see a CAC benchmark, always ask: does this include organic?
SaaS CAC by Vertical
If you're in SaaS, the overall average hides enormous variation:
| SaaS Vertical | Combined CAC |
|---|---|
| Fintech | $1,450 |
| Insurance | $1,280 |
| Medtech | $921 |
| Security | $805 |
| Agtech | $712 |
| Cleantech | $674 |
| Design | $658 |
| Adtech | $560 |
| Engineering | $551 |
| Industrial | $542 |
| Proptech | $518 |
| Staffing & HR | $410 |
| Legaltech | $299 |
| eCommerce SaaS | $274 |
Fintech SaaS companies pay more than 5x what eCommerce SaaS companies pay per customer. Regulatory complexity, longer sales cycles, and higher compliance requirements all drive that gap. If you're a security SaaS company benchmarking against a generic SaaS average, you're setting yourself up for a rude surprise.
CAC by Channel
B2B SaaS Channel Benchmarks
The Optifai Sales Ops Benchmark (N=939 companies, Q1-Q3 2025) provides clean channel-level data:
| Channel | Avg CAC |
|---|---|
| Partner/Referral | $150 |
| Inbound - SEO, content | $200 |
| Paid Ads | $350 |
| Outbound - SDR-led | $400 |
| Events | $500 |
Events are the worst CAC channel for most B2B companies. Full stop. Unless you're selling six-figure enterprise deals where a handshake at a conference genuinely moves the needle, that $500/customer is hard to justify - especially when partner/referral delivers at $150.
The $400 outbound average is also misleading, because it assumes your data is clean. If a third of your emails bounce, your effective outbound CAC is closer to $600. We've seen teams cut that waste dramatically by switching to verified contact data with weekly refresh cycles - turning outbound from the second-most-expensive channel into something that competes with inbound on a per-customer basis.
B2B vs B2C by Channel
FirstPageSage's channel data, based on a 3-year average across ~120 firms, shows starker differences:
| Channel | B2B CAC | B2C CAC |
|---|---|---|
| PPC/SEM | $802 | $290 |
| SDRs | $1,980 | - |
| ABM | $4,664 | - |
SDR-led outbound at $1,980 per customer is eye-watering. And ABM at $4,664 only makes sense if your average deal size is well into six figures.
Here's the thing: if your average contract value is under $15K, you probably don't need ABM. You need a tighter inbound engine and cleaner outbound data. ABM is a luxury strategy that gets sold as a necessity.
The Optimal Channel Mix
Companies allocating 40-50% of budget to inbound and partnerships see roughly 30% lower overall CAC versus outbound-heavy strategies. A high-performing mix looks something like this:
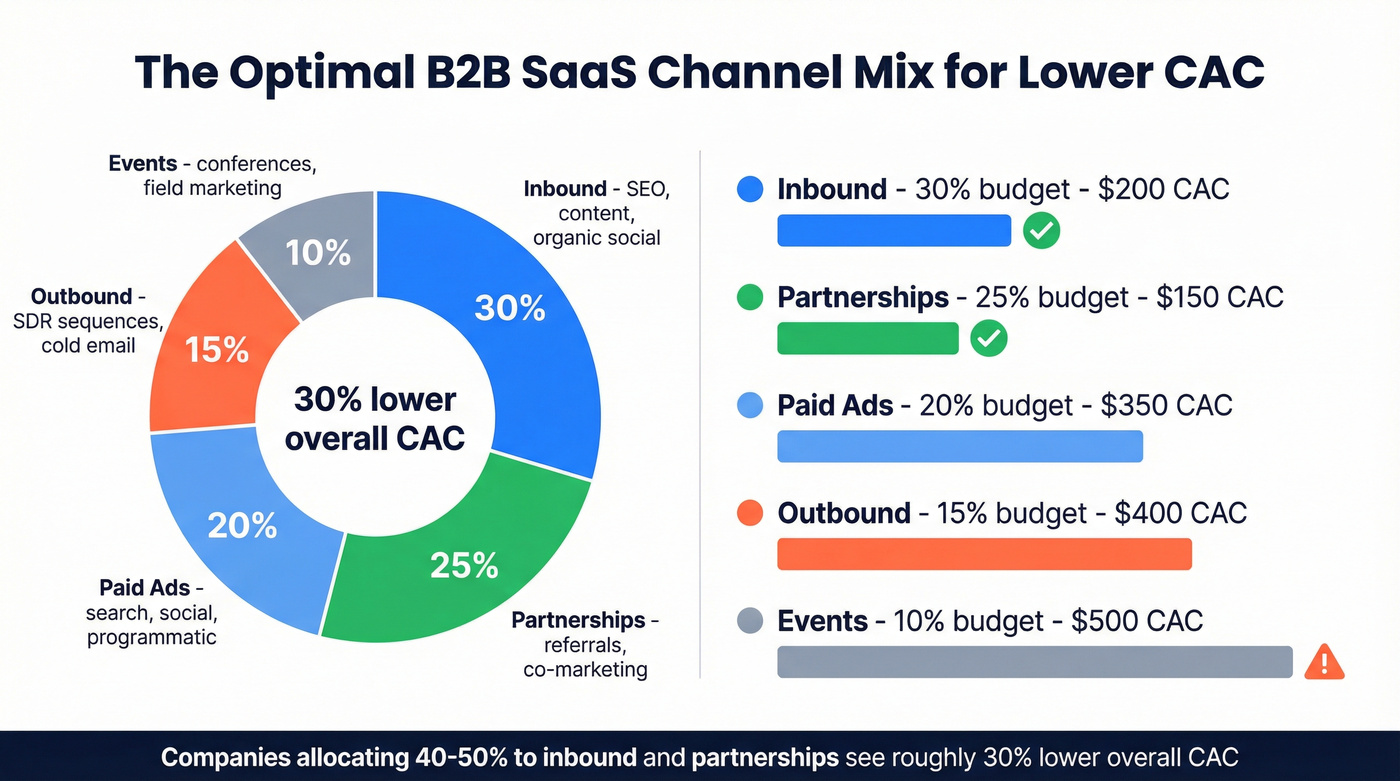
- 30% inbound - SEO, content marketing, organic social
- 25% partnerships - referrals, co-marketing, channel programs
- 20% paid ads - search, social, programmatic
- 15% outbound - SDR sequences and cold email
- 10% events - conferences and field marketing
This doesn't mean outbound is dead. It means outbound should be a precision instrument, not the default channel you throw budget at because it's the easiest to scale.
Every bounced email is wasted SDR time, burned domain reputation, and inflated CAC. Prospeo delivers 98% email accuracy with a 7-day data refresh - so your outbound spend converts instead of evaporating. At $0.01 per email, your cost-per-contact drops by 90% compared to ZoomInfo.
Stop paying $2 to acquire $1 of ARR. Fix your data first.
CAC Payback Period
CAC payback measures how many months it takes to recoup your acquisition spend from a customer's gross margin:
CAC Payback = CAC / (Monthly Revenue per Customer x Gross Margin %)
| Rating | Payback Period |
|---|---|
| Excellent | < 6 months |
| Good | 6-12 months |
| Warning | 12-18 months |
| Critical | > 18 months |
Segment-specific targets matter. SMB-focused SaaS should target under 12 months. Mid-market can tolerate up to 18. Enterprise, with its larger deal sizes and longer sales cycles, gets up to 24 months - but that's the ceiling, not the goal.
The average private SaaS company sits at 23 months payback. That's deep in "critical" territory. If yours is above 18 months, treat it as a fire drill - not a metric to "monitor." You're burning cash faster than customers are paying it back, and every month of churn compounds the problem.
LTV:CAC Ratio
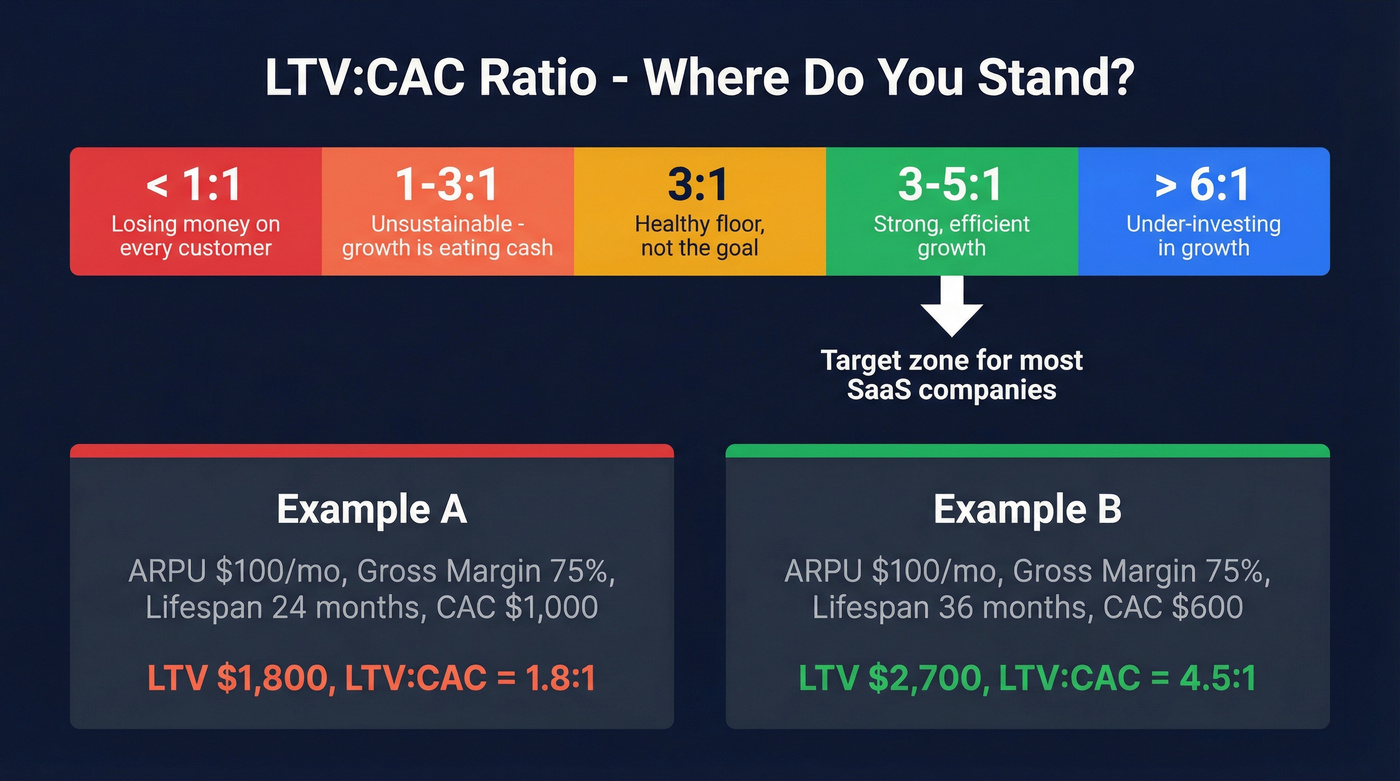
Lifetime value divided by CAC is the single most important unit economics metric. To calculate LTV, multiply your ARPU by gross margin percentage by average customer lifespan in months, then divide by your acquisition cost.
| LTV:CAC | What It Means |
|---|---|
| < 1:1 | Losing money on every customer |
| 1-3:1 | Unsustainable - growth is eating cash |
| 3:1 | Healthy floor, not the goal |
| 3-5:1 | Strong, efficient growth |
| > 6:1 | Under-investing in growth |
Let's be honest about 3:1. Too many teams celebrate hitting it like they've won something. In reality, 3:1 means you're spending a third of your customer's lifetime value just to acquire them. That leaves thin margins for product, support, and profit after you account for retention costs and churn. Aim for 4:1 or 5:1. And if you're above 6:1, you're probably leaving growth on the table by under-spending on acquisition.
Why Acquisition Costs Keep Rising
Four forces are compounding to push the cost to acquire a customer higher across every industry.
Ad costs keep climbing. Digital ad costs are up 5.13% market-wide, and global digital marketing spend is projected to grow from $526B to $936B by 2029 per Statista. More money chasing the same eyeballs means higher CPMs, higher CPCs, and higher CAC.
Privacy changes destroyed cheap targeting. iOS 14.5 gutted mobile attribution. Cookie deprecation is making retargeting less effective. The channels that used to deliver cheap, well-targeted acquisition now cost more and convert worse.
Retention is getting harder. 75% of software companies reported declining retention rates in 2024. When customers churn faster, you need to acquire more of them to maintain revenue - which pushes acquisition costs higher even if your per-customer spend stays flat. Net revenue retention below 100% is a CAC multiplier that doesn't show up in most dashboards.
The efficiency squeeze is real. The median New CAC Ratio rose 14% in 2024 to $2.00, meaning the median SaaS company spends $2 to acquire $1 of new ARR. Top-quartile companies spend $1.00 per dollar of new ARR. Fourth-quartile companies spend $2.82. That spread is widening, and if you're not actively optimizing, you're drifting toward the wrong end.
CAC Mistakes That Inflate Your Numbers
These seven errors show up in almost every CAC audit we've done:
Excluding salaries. If your SDRs spend 80% of their time on acquisition, 80% of their fully loaded comp belongs in the numerator. Most teams only count ad spend and wonder why their CAC looks too low.
Confusing CAC with CPL or CPA. Your cost per lead isn't your cost per customer. A $50 CPL with a 5% close rate means your CAC is $1,000 - not $50.
Not segmenting by customer type or channel. Blended CAC hides the channels that are bleeding money. Break it out by channel, segment, and deal size.
Ignoring time lag between spend and conversion. B2B sales cycles run 3-9 months. If you attribute January's spend to January's closes, you're matching the wrong costs to the wrong customers. Fixing this requires cohort-based attribution rather than simple monthly division.
Including organic customers in paid CAC. If someone finds you through SEO and you count them in your paid acquisition denominator, you're artificially deflating your paid CAC.
Treating all customers equally. A customer worth $500 in LTV and one worth $50,000 shouldn't be averaged together. Segment your CAC by customer value tier.
Overlooking the long B2B acquisition journey. Enterprise deals touch 6-10 stakeholders across multiple channels over months. Single-touch attribution will always undercount your real CAC.
How to Reduce Acquisition Cost
Shift Budget to Low-CAC Channels
The data is clear: partner and referral channels deliver customers at $150 versus $500 for events. Companies allocating 40-50% of budget to inbound and partnerships see roughly 30% lower overall CAC. If you're spending more than 20% of your acquisition budget on events without clear attribution to closed revenue, reallocate.
Fix Your Data Before Scaling Outbound
Here's the math that should scare every outbound leader: you send 10,000 cold emails. If 35% bounce - common with stale data - only 6,500 actually reach an inbox. But you've already paid for 10,000 emails worth of SDR time, sequencing tool credits, and domain warm-up. Your real cost per delivered email is 54% higher than what your spreadsheet shows.
Snyk's team of 50 AEs saw their bounce rate drop from 35-40% to under 5% after switching to Prospeo's verified email data, and AE-sourced pipeline jumped 180%. That's not a marginal improvement - it's a structural reduction in outbound CAC. The consensus on r/sales tends to agree: data quality is the single cheapest lever for lowering outbound costs, yet it's the last thing most teams audit.
Invest in Retention Over Acquisition
Acquiring a new customer costs 5-25x more than retaining an existing one. A 5% increase in retention correlates with a 25-95% increase in profitability. And the probability of selling to an existing customer is 60-70%, versus 5-20% for a new prospect.
Every dollar you move from acquisition to retention lowers your CAC indirectly. Fewer churned customers means fewer replacements to acquire. If your net revenue retention is below 100%, fixing that will do more for your unit economics than any acquisition optimization.
Personalize at Scale
Generic outbound and one-size-fits-all landing pages are CAC killers. AVON saw a 78% conversion boost from personalized banners. MAXAROMA generated $2.3M in incremental revenue from their personalization program. Higher conversion rates at every stage of the funnel mean fewer touches, fewer dollars, and lower overall acquisition spend.
Build a Referral Engine
Partner and referral is the cheapest acquisition channel at $150 per customer. Yet most B2B companies treat referrals as something that happens organically rather than building a systematic program.
Structured referral incentives, partner co-marketing, and channel programs deserve dedicated budget and headcount. The companies with the lowest CAC in the Optifai dataset almost universally had formalized referral programs - not just a "refer a friend" link buried in the footer.
Shorten Sales Cycles
Every week your sales cycle runs, you're accumulating SDR time, AE time, and tool costs against that deal. Faster ramp means lower CAC per rep. GreyScout cut rep ramp time from 8-10 weeks to 4 weeks by giving new reps access to verified prospect data from day one - reps were booking meetings in their first month instead of their third. If you're trying to operationalize this, start with a tighter SaaS sales cycle definition and stage-by-stage benchmarks.
Skip this tactic if your sales cycle is already under 30 days. The ROI on cycle compression is highest for teams running 60+ day averages.
Track CAC by Channel, Not Blended
Blended CAC is useless for optimization. You can't fix what you can't see. If your outbound CAC is $1,200 and your inbound CAC is $180, the blended number of $450 tells you nothing actionable. Break it out by channel, run the numbers monthly, and shift budget toward what's working. In our experience, this is the single highest-leverage reporting change most teams can make. For a practical setup, use CRM lead source tracking and a simple sales reporting dashboard.
The worked example above shows how tool costs inflate your fully loaded CAC. Prospeo replaces expensive data providers at a fraction of the cost - 300M+ profiles, 125M+ verified mobiles, and 30+ filters to target only in-market buyers. Teams using Prospeo book 35% more meetings than Apollo users.
Reduce your biggest hidden CAC inflator - bad outbound data - starting today.
CAC FAQ
What is a good cost to acquire a customer?
Target an LTV:CAC ratio of at least 3:1 with payback under 12 months for SMB and under 18 months for mid-market. B2B SaaS averages ~$239 combined; e-commerce sits around ~$86. If your payback exceeds 18 months, your acquisition cost is too high regardless of the absolute number.
What's the difference between CAC and CPA?
CAC measures the fully loaded cost to acquire a paying customer - salaries, tools, overhead, everything. CPA measures the cost per any conversion action like a lead, signup, or trial. CAC is always higher because not every action converts to revenue. Use CPA for campaign optimization and CAC for unit economics.
Should I use new CAC or blended CAC?
Use new CAC for growth planning and investor reporting - it isolates what you're actually spending to acquire net-new logos. Blended CAC is fine for high-level efficiency tracking but don't use it for decisions, because expansion revenue masks an expensive acquisition engine.
Which marketing channel has the lowest CAC?
Partner and referral channels average $150 per customer in B2B SaaS, making them the cheapest by a wide margin. Inbound averages $200, paid ads $350, and events top $500. Companies allocating 40-50% of budget to inbound and partnerships see roughly 30% lower overall CAC.
How does bad data increase acquisition costs?
If 35% of your outbound emails bounce, you're paying for SDR time, sequencing tools, and domain warm-up that reaches nobody - inflating your real CAC by over 50%. Teams like Snyk cut bounce rates from 35% to under 5% by switching to verified contact data, directly lowering their per-customer acquisition cost.