How to Choose the Right Competitive Landscape Framework
Your CEO asks for a competitive landscape before the board meeting. You've got five days, no budget, and the last analysis was done 18 months ago by someone who left. Every guide you find lists the same six models without telling you which one to actually use.
The real problem isn't that frameworks are hard to understand. It's that nobody tells you which ones matter for your specific situation, in what order, and what to deliver at the end.
What You Need (Quick Version)
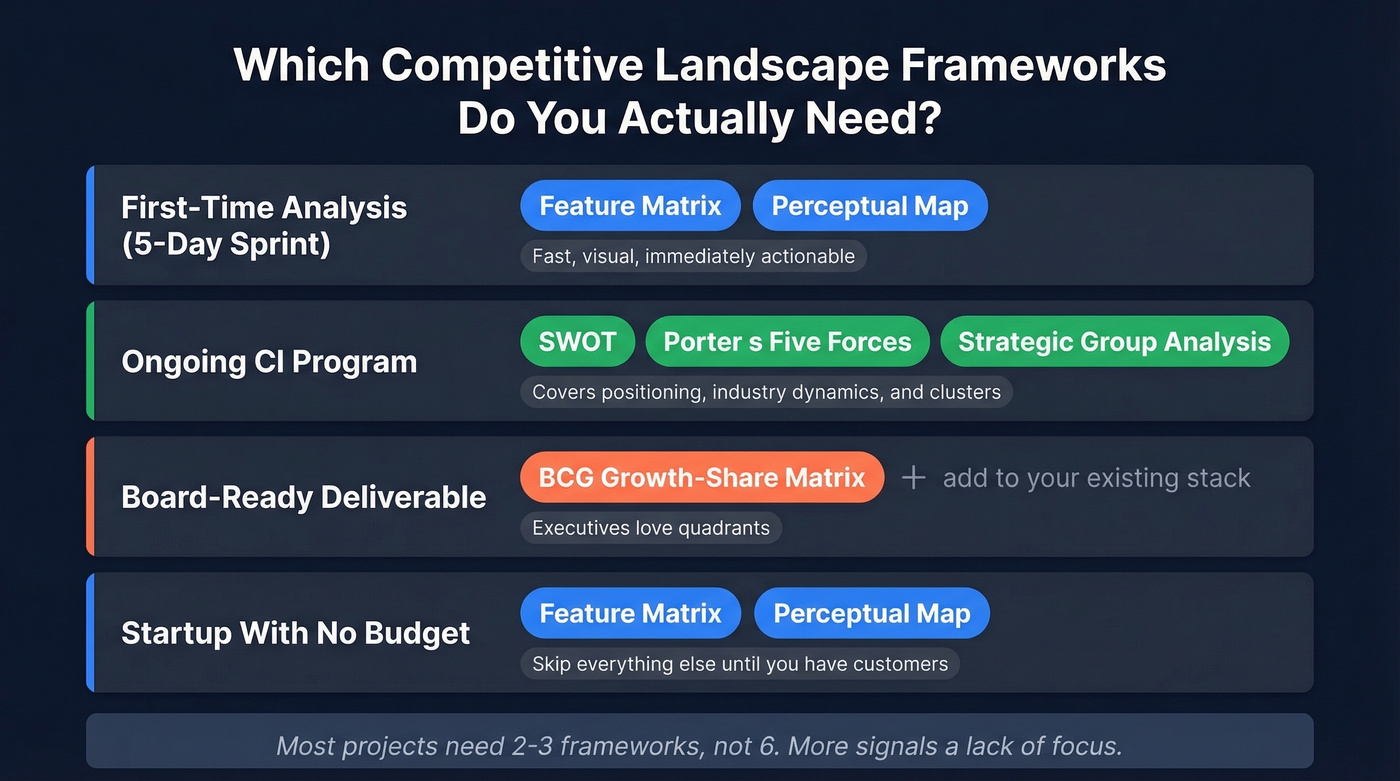
Most projects need two to three frameworks, not six. More signals a lack of focus.
Here's the cheat sheet by situation:
- First-time analysis (5-day sprint): Feature Matrix + Perceptual Map. Fast, visual, immediately actionable.
- Ongoing CI program: SWOT + Porter's Five Forces + Strategic Group Analysis. Covers internal positioning, industry dynamics, and competitive clusters.
- Board-ready deliverable: Add a BCG Growth-Share Matrix to whatever you're already running. Executives love quadrants.
- Startup with no budget: Feature Matrix + Perceptual Map. Skip everything else until you have customers to validate against.
What Is a Competitive Landscape Framework?
A competitive landscape framework is a structured model for mapping who you compete with, how each player wins, and where the gaps are. It's a point-in-time snapshot - not to be confused with competitive intelligence, which is the ongoing discipline of collecting, analyzing, and distributing that information continuously.
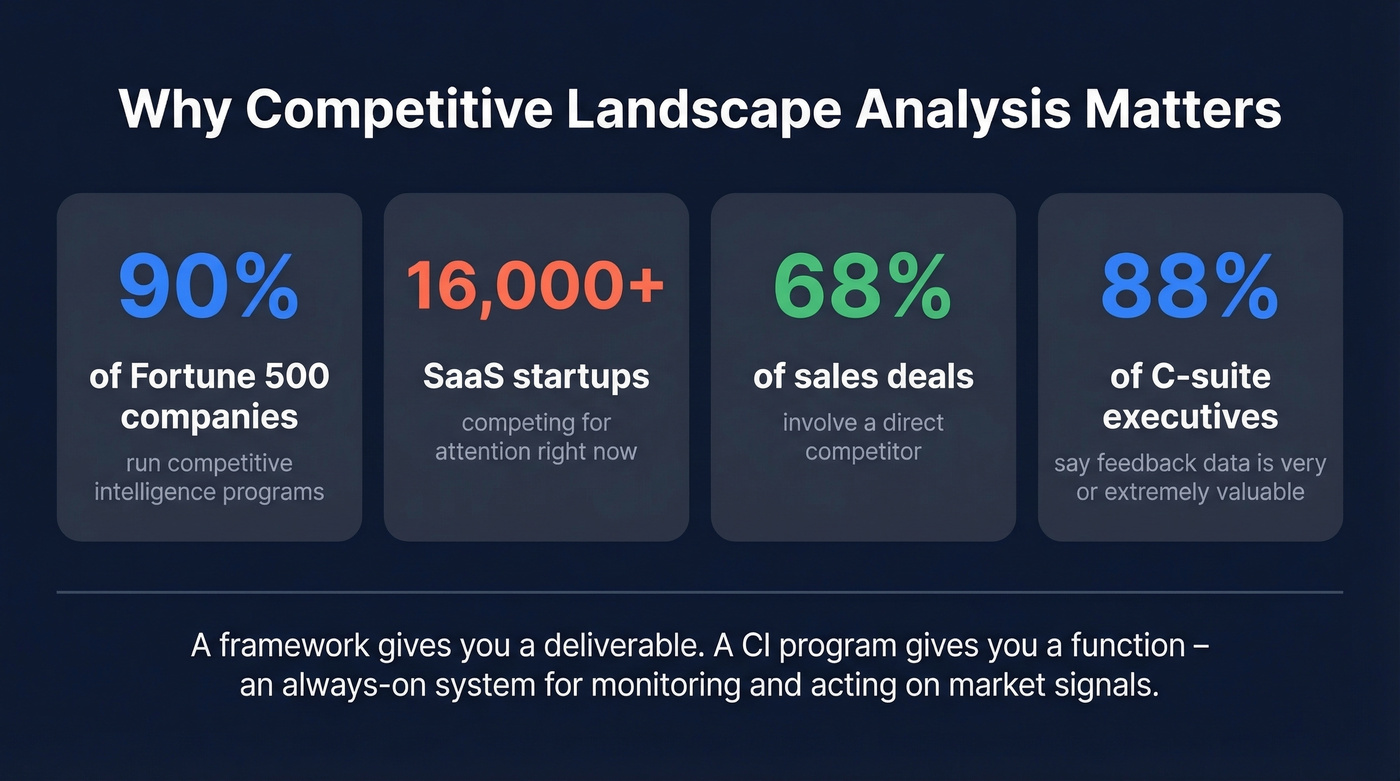
The distinction matters. A competitive landscape analysis framework gives you a deliverable. A competitive intelligence framework gives you a function - an always-on system for monitoring, interpreting, and acting on market signals. 90% of Fortune 500 companies run CI programs, and 73% of businesses allocate a portion of their tech budgets to competitive analysis functions. But most mid-market and startup teams treat competitive analysis as a one-off project that gets stale the moment it's finished.
The stakes are real. SaaS alone has over 16,000 startups competing for attention. In 2000, Netflix offered to sell itself to Blockbuster for $50 million - Blockbuster declined. By 2021, Netflix was worth over $250 billion and exactly one Blockbuster remained. That's what happens when you misread the landscape. Blockbuster didn't fail because they lacked data. They failed because they didn't have a model for interpreting what the data meant.
The 6 Core Analysis Frameworks
Not every framework fits every question. The table below maps the business question you're actually trying to answer to the model that answers it.
| Business Question | Framework | Output | Best For |
|---|---|---|---|
| Where are we strong/weak? | SWOT | Quantified 4-quadrant view | Any company, any stage |
| How attractive is this industry? | Porter's Five Forces | Industry profitability map | Market entry, investment |
| How do customers see us? | Perceptual Mapping | 2x2 positioning visual | Repositioning, launches |
| Who competes most directly? | Strategic Group Analysis | Cluster map by strategy | Crowded markets, M&A |
| What external forces shape us? | PEST/PESTLE | Macro-environment scan | Regulated industries |
| Where should we invest? | BCG Matrix | Growth-share quadrant | Multi-product portfolios |
SWOT Analysis
SWOT maps strengths, weaknesses, opportunities, and threats into four quadrants. The problem is that most teams fill it with vague platitudes. A SWOT that says "strong brand" under Strengths is worthless. Quantify every cell or don't bother.
Here's what a quantified SWOT looks like for a mid-market CRM:
Strengths: 72% aided recall, 15 points above nearest competitor. 94% uptime SLA exceeded for 18 consecutive months. Weaknesses: 18% annual churn rate - 3x the category average. Mobile app rated 2.8/5 on app stores. Opportunities: Mid-market segment growing 22% YoY; only two incumbents serve it. Integration marketplace has 40% fewer connectors than top competitor. Threats: Top competitor raised $200M Series D and is hiring 50 enterprise reps. Open-source alternative hit 10,000 GitHub stars in six months.
That's the difference between a SWOT that collects dust and one that drives decisions.
Porter's Five Forces
Michael Porter's framework analyzes five structural forces that determine industry profitability: competitive rivalry, supplier power, buyer power, threat of substitutes, and threat of new entrants. It answers "should we enter this market?" or "why are margins compressing?" - not "how do we beat Competitor X on Tuesday."
Use it when you need to explain market dynamics to investors or a board. Skip it when you need to build a battlecard.
Perceptual Mapping
Perceptual maps plot competitors on two axes based on how customers perceive them - not how the companies describe themselves. Common axes include price vs. features, simplicity vs. power, or niche vs. broad.
Here's the thing: if you're filling this in based on your own opinions instead of customer surveys or review data, you're building a fiction map. Use G2 reviews, win/loss interviews, and customer feedback to anchor the positions. Plot both your current position and your target position on the same map - the gap between them becomes your positioning roadmap.
Strategic Group Analysis
Strategic Group Analysis clusters competitors by similar strategies - pricing model, target segment, distribution channel, geographic focus. It's the right model for crowded markets where you need to see which competitors actually overlap with you versus which ones just look similar from the outside. Particularly useful for M&A analysis and for identifying which cluster you want to move into.
PEST/PESTLE Analysis
PESTLE scans political, economic, social, technological, legal, and environmental forces shaping your market. If you're in a regulated industry, expanding internationally, or operating in a market where government policy shifts the playing field, PESTLE isn't optional - it's the first thing you should run. For pure SaaS in a stable domestic market, you can usually skip it.
BCG Growth-Share Matrix
The BCG Growth-Share Matrix plots products or business units on a growth-vs.-market-share grid, producing four categories: Stars, Cash Cows, Question Marks, and Dogs. It's a portfolio tool, not a competitive tool. If you're a single-product startup, this doesn't apply to you yet. If you're presenting to a board that manages a portfolio, it's the model they expect to see.
How to Sequence Frameworks
Running three frameworks simultaneously produces noise. Sequencing them produces insight. We've seen teams skip the diagnostic phase and end up redoing their SWOT within a month.
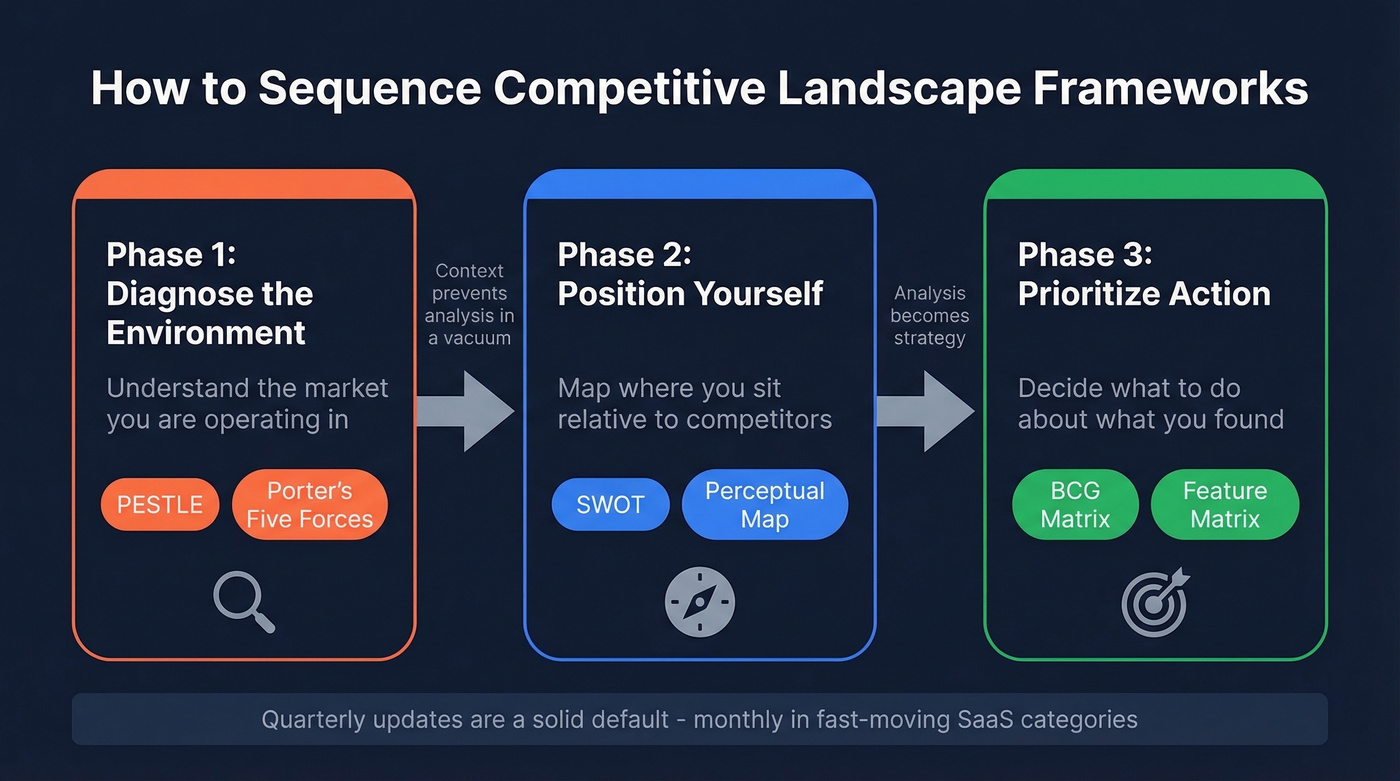
Phase 1: Diagnose the environment. Run PESTLE or Porter's Five Forces to understand the market you're operating in. This gives you the context layer that prevents your later analysis from happening in a vacuum.
Phase 2: Position yourself within it. Layer on SWOT or a perceptual map to understand where you sit relative to competitors. The diagnostic phase ensures you're mapping against the right dimensions.
Phase 3: Prioritize action. Add a BCG Matrix or feature matrix to decide what to do about what you've found. This is where analysis becomes strategy.
Before you pick frameworks, understand what kind of market you're in. BCG's Strategy Palette identifies five environment types: Classic environments reward scale and differentiation, adaptive environments reward experimentation and speed, visionary environments reward being first, shaping environments reward orchestrating ecosystems, and renewal environments demand pragmatic turnaround. The environment type determines how you run strategy - and your competitive analysis cadence should match how fast your market moves. Quarterly updates are a solid default. In fast-moving SaaS categories, monthly updates are necessary.
A competitive landscape framework is only as good as the data behind it. Prospeo tracks 300M+ professional profiles with 30+ filters - buyer intent, technographics, headcount growth, funding, and revenue - so you can populate every quadrant with real signals, not guesswork.
Stop building frameworks on stale data. Build them on 7-day-fresh intelligence.
Step-by-Step Process
Frameworks are useless without a process for filling them with real data. Sellers face competitors in 68% of their deals. If you don't know who those competitors are and how they position, you're losing winnable revenue.
Define Scope and Pick 5 Competitors
Pick five competitors, not fifteen. Three direct, one indirect, one aspirational. Deep analysis of five beats shallow scans of fifteen every time.
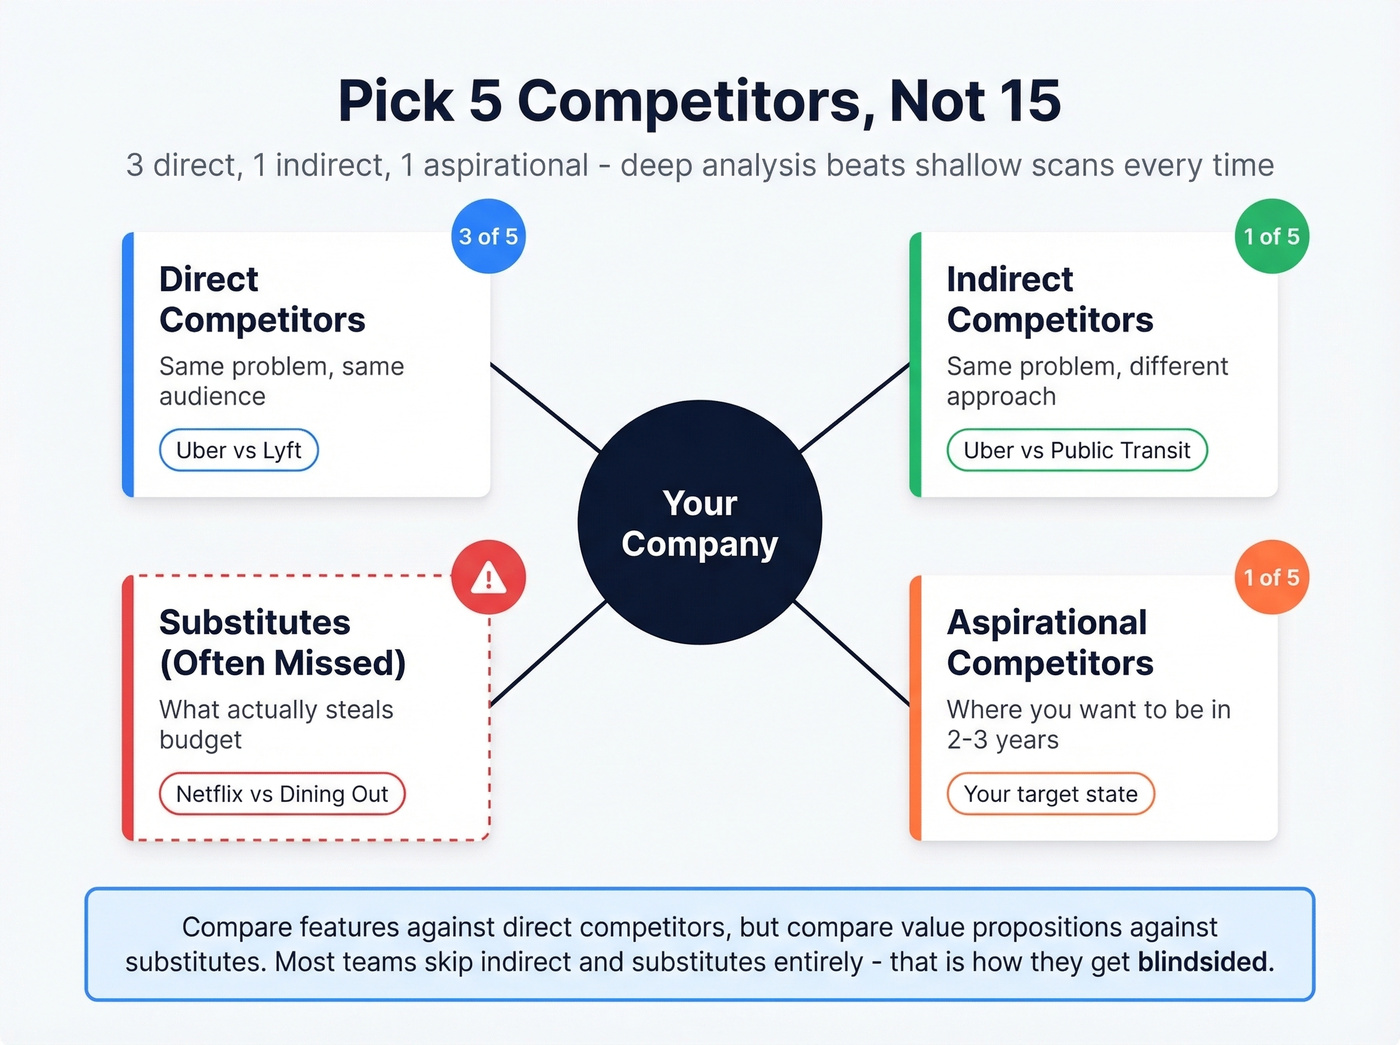
Direct competitors solve the same problem for the same audience - Uber and Lyft. Indirect competitors solve the same problem differently - Uber and public transit. Aspirational competitors are where you want to be in two to three years. Define the scope before you start gathering data. Otherwise you'll spend three weeks building a 30-slide deck that nobody reads.
Categorize Them
Sort your five into four categories: direct, indirect, perceived, and aspirational. Then add a substitutes lens so you don't miss what actually steals budget - Netflix vs. dining out, for example.
This categorization matters because each type requires different analysis. You compare features against direct competitors, but you compare value propositions against substitutes. Most teams skip indirect and substitutes entirely, which is how they get blindsided.
Gather Competitive Intelligence Data
Your landscape is only as good as your data. Start with public sources: competitor websites, pricing pages, G2 and Capterra reviews, job postings that reveal strategic priorities, and tech stack tools like BuiltWith. Then go deeper - run competitor product demos, subscribe to their newsletters, and monitor their support channels.
For the highest-signal input, talk to people. In a study of 250 C-suite executives, 88% said feedback data is very or extremely valuable for decision-making. To identify decision-makers at competitor companies or source contacts for win/loss interviews, a B2B data platform like Prospeo turns the "gather data" step from a week-long slog into an afternoon - 300M+ profiles, 98% email accuracy, and intent data tracking 15,000 topics on a 7-day refresh cycle.
Map Positioning
Build a feature matrix in a spreadsheet - rows are competitors, columns are the dimensions that matter to your buyers. Then translate that matrix into a perceptual map. Pick two axes that reflect how customers actually make decisions. Price vs. features is the obvious choice, but simplicity vs. power or niche vs. broad often reveals more interesting positioning gaps.
The matrix is for your product team. The map is for your executives.
Synthesize and Operationalize
Raw data isn't a deliverable. Synthesize your findings into the specific outputs your stakeholders need - battlecards for sales, positioning maps for strategy, roadmap inputs for product. We've seen teams spend weeks on analysis that never gets used because nobody defined the output format upfront. Decide what you're delivering before you start gathering data, not after.
Five Mistakes That Kill Your Analysis
You spent three weeks on a 30-slide deck. The VP of Sales glanced at it for 90 seconds and asked, "So who do we lose to and why?" Here are the five mistakes that lead to that moment.
1. Price-only mapping. The VP hands you a spreadsheet sorted by price tier and calls it a competitive landscape. Price-only framing pushes teams toward incremental feature parity and misses the real competition entirely. Customers compare across categories and budgets, not just price bands. A thread on r/marketing put it bluntly: if your competitive analysis is just a pricing table, you've already lost the positioning battle.
2. Ignoring indirect competitors. Your project management tool doesn't just compete with other PM tools. It competes with email, spreadsheets, sticky notes, and the inertia of doing nothing. If you only map direct competitors, you'll miss the substitutes that actually kill your deals.
3. Feature-only focus without customer perception. A feature matrix tells you what competitors built. It doesn't tell you what customers care about. Layer in review sentiment, win/loss data, and NPS signals. The consensus on r/SaaS is clear: customer complaints are the highest-signal input for differentiation.
4. Treating it as one-time. Competitive landscapes decay fast. Schedule quarterly reviews for fast-moving SaaS markets, monthly monitoring check-ins between formal updates. If your last analysis is more than six months old, it's a historical document, not a strategic tool.
5. Unclear deliverables. In our experience, the number-one reason competitive decks get ignored is that nobody defined the output before starting the work. "Own competitive analysis" with zero guidance on format is how you end up with a deck nobody uses. Define the deliverable - battlecard, positioning map, executive brief - before you open a single spreadsheet.
Most Teams Don't Need More Frameworks
Let's be honest: if your average deal size is under $10K, you probably don't need a formal CI program or a five-framework stack. A feature matrix, a perceptual map, and a quarterly calendar reminder to update them will outperform 90% of the bloated competitive decks sitting untouched in shared drives.
The teams that win aren't the ones with the most frameworks. They're the ones that actually operationalize two of them.
What to Actually Deliver
If your competitive deck has more than 10 pages, nobody will read it. Match the deliverable to the audience.
| Deliverable | When to Use | Audience |
|---|---|---|
| Battlecards | Active selling vs. known competitors | Sales reps |
| Positioning Map | Strategy, repositioning | Leadership, product |
| Feature Matrix | Build vs. buy, roadmap | Product, engineering |
| Executive Brief | Board meetings, investors | C-suite, board |
| Roadmap Inputs | Quarterly planning | Product management |
Battlecards deserve special attention. Crayon reports 93% of teams using battlecards saw win rate increases exceeding 20%. That's not a marginal improvement - it's the difference between hitting quota and missing it.
Cascade Insights ran a competitive landscape project that involved 40 in-depth interviews with target personas - data scientists, engineers, senior architects. The output wasn't a generic SWOT. It was competitor pricing intelligence, positioning analysis, and persona resonance data that directly informed product and GTM decisions. That's the level of specificity your deliverables should aim for.
On the enterprise side, BTG delivered a competitive landscape for a global F100 food and beverage company using scenario-based modeling to project retail landscape shifts. The output included customer and channel analyses tied to specific GTM capabilities. Different company, different deliverable - same principle: the output has to match the decision it's informing.
Tools for Competitive Analysis
Klue and Crayon are worth it for mid-market and enterprise CI programs. For everyone else, a spreadsheet, a B2B data platform, and quarterly discipline get you 80% of the value.
CI Platforms: Klue runs around ~$16,000/year (G2 rating: 4.8/5) and excels at battlecard automation and competitive content distribution. Crayon starts at $15,000+/year with a median contract around $30,000/year (G2: 4.6/5), strong on monitoring and alerting. Both follow the AI-powered workflow of Monitor, Aggregate, Analyze, Distribute. Worker access to AI rose 50% in 2025, and 66% of companies report productivity gains - expect these platforms to get sharper fast.
SEO & Traffic Tools: Semrush (~$130-$500/mo) and Ahrefs (~$99-$449/mo) are essential for understanding competitor content strategy, organic visibility, and keyword positioning. SimilarWeb offers a free tier for traffic estimates. BuiltWith is free for basic lookups. Crunchbase covers funding and org data. G2 and Capterra give you access to the customer sentiment that makes your perceptual maps accurate instead of fictional.
B2B Data Platforms: For sourcing competitor contacts, running win/loss interviews, and tracking hiring signals that reveal strategic priorities, Prospeo covers 300M+ profiles with 98% email accuracy and intent data on 15,000 topics. The free tier gives you 75 emails/month with no contracts, and paid plans start at roughly $0.01 per email - which makes it practical even for teams without a CI budget. If you’re comparing options, start with B2B contact databases and buyer intent tools.
Strategic Group Analysis and Perceptual Mapping require knowing who's actually hiring, growing, and investing. Prospeo's intent data covers 15,000 topics, and every record refreshes every 7 days - not the 6-week industry average. Your competitive landscape stays current without the manual work.
Turn your competitive framework from a one-off snapshot into a living system.
FAQ
How often should you update a competitive landscape analysis?
Quarterly for fast-moving SaaS markets, semiannually for stable industries. Between formal updates, run monthly monitoring - competitor alerts, new G2 reviews, job postings, and pricing page changes. If your market moves faster than your update cycle, you're flying blind.
What's the difference between a competitive landscape framework and competitive intelligence?
A competitive landscape framework is a structured model you apply at a point in time - a deliverable for a specific decision or meeting. Competitive intelligence is the ongoing discipline of collecting, analyzing, and distributing competitor information across your organization. One is a project; the other is a function.
How many competitors should you include?
Five is the sweet spot: three direct, one indirect, one aspirational. Deep analysis of five competitors produces sharper insights than shallow scans of fifteen. You can always expand later, but starting broad dilutes focus and delays delivery.
Which framework is best for startups?
Start with a Feature Matrix and Perceptual Map - they're fast, visual, and actionable without enterprise budgets. Add Porter's Five Forces only if you're pitching investors who want industry-level context. Skip BCG and PESTLE until you have a portfolio to manage or a regulatory environment to navigate.
How do you gather competitive data without a big budget?
Use free tiers: SimilarWeb for traffic estimates, G2 for customer reviews, BuiltWith for tech stacks, and competitor websites for pricing. Prospeo's free plan (75 emails/month) lets you source contacts for win/loss interviews, while competitor job postings reveal strategic priorities faster than press releases.