Email Deliverability Report: Metrics, Benchmarks & Tools for 2026
Your ESP says 98% of your emails were delivered. Your open rates tell a different story. That gap between SMTP acceptance and actual inbox placement is where an email deliverability report earns its keep. Across millions of tests, only 60% of emails reached a visible mailbox. Another 36% landed in spam. Technical delivery success overstates real inbox reach by roughly 40%.
A proper deliverability report tells you what actually happened after the server said "250 OK."
What Is a Deliverability Report?
A campaign performance report tracks opens, clicks, and revenue. A deliverability report tracks the infrastructure and reputation signals that determine whether your emails reach the inbox at all - authentication health, inbox placement rates, blacklist status, and sender reputation scores across major ISPs.
Most teams only have the campaign report. They see a 22% open rate and assume deliverability is fine, while 30%+ of their emails sit in spam folders, invisible to recipients and invisible to their reporting. Consistent deliverability reporting closes that blind spot.
What You Need (Quick Version)
For teams who just want to act:
- North-star metric: Inbox placement rate, not delivery rate. If you're only tracking the number your ESP gives you, you're flying blind.
- Free tool stack: Google Postmaster Tools for Gmail reputation, Microsoft SNDS for Outlook reputation, and Mail-Tester for quick spam score checks. These three cover your baseline.
- Paid tool worth the money: GlockApps at $59/mo - the most complete inbox placement testing tool at a reasonable price point.
- The upstream fix most people skip: Verify your list before you send. Email lists decay at 22.71% per year. Prospeo catches invalid addresses, spam traps, and honeypots before they tank your sender reputation, and the free tier covers 75 verifications/month.
Now let's break down each piece.
Key Metrics to Track
Here's what belongs in every deliverability report:
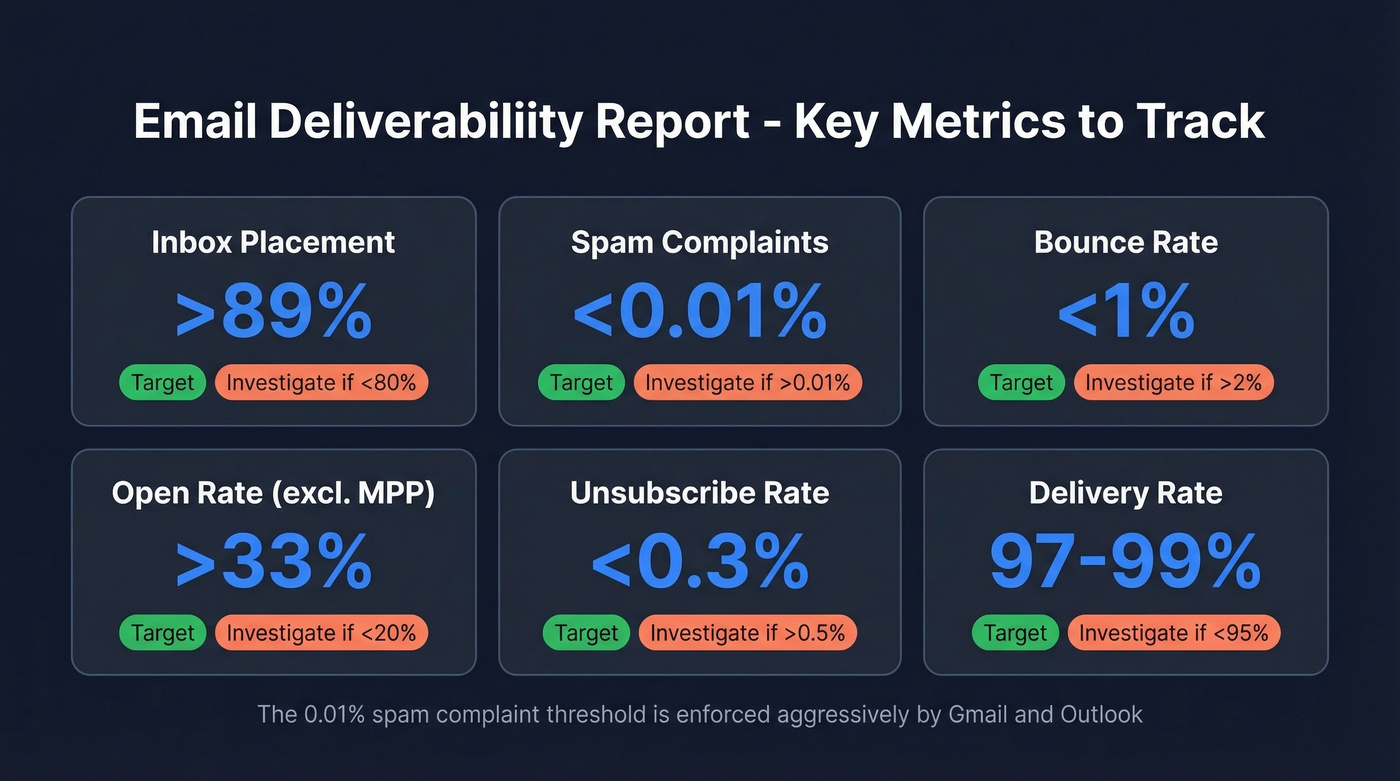
| Metric | Target | Investigate If |
|---|---|---|
| Inbox placement | >89% | <80% |
| Spam complaints | <0.01% | >0.01% |
| Bounce rate | <1% | >2% |
| Open rate (excl. MPP) | >33% | <20% |
| Unsubscribe rate | <0.3% | >0.5% |
| Delivery rate | 97-99% | <95% |
The spam complaint threshold catches people off guard. 0.01% sounds impossibly low, but major mailbox providers enforce it aggressively. Google will throttle your sending if you consistently exceed it, and there's no appeals process that reliably reverses the damage.
Your report should also cover authentication pass rates for SPF, DKIM, and DMARC, plus blacklist status across major blocklists. Monitor list decay rate too - a list that was clean six months ago has already lost roughly 11.4% of its valid addresses. Keeping bounce rates under 1% requires verification before every major send, not just at list import.

Engagement metrics round out the picture. Track reply rates, click-to-open ratios, and - if you're in e-commerce - revenue per email. A report without engagement context is just infrastructure monitoring. You need both layers: placement data showing where emails land, and engagement data showing how subscribers interact once they arrive.
2026 Deliverability Benchmarks
Let's put numbers on what "good" looks like right now. Against the global baseline of 60% visible mailbox / 36% spam / 4% blocked or missing, here's how individual ISPs and industries compare.
ISP Inbox Placement
| Provider | Inbox | Spam | Missing |
|---|---|---|---|
| Gmail | 89.8% | 6.4% | 3.8% |
| Microsoft | 77.4% | 15.1% | 7.5% |
| Yahoo | 87.3% | 6.4% | 6.3% |
| Apple | 82.0% | 10.8% | 7.2% |
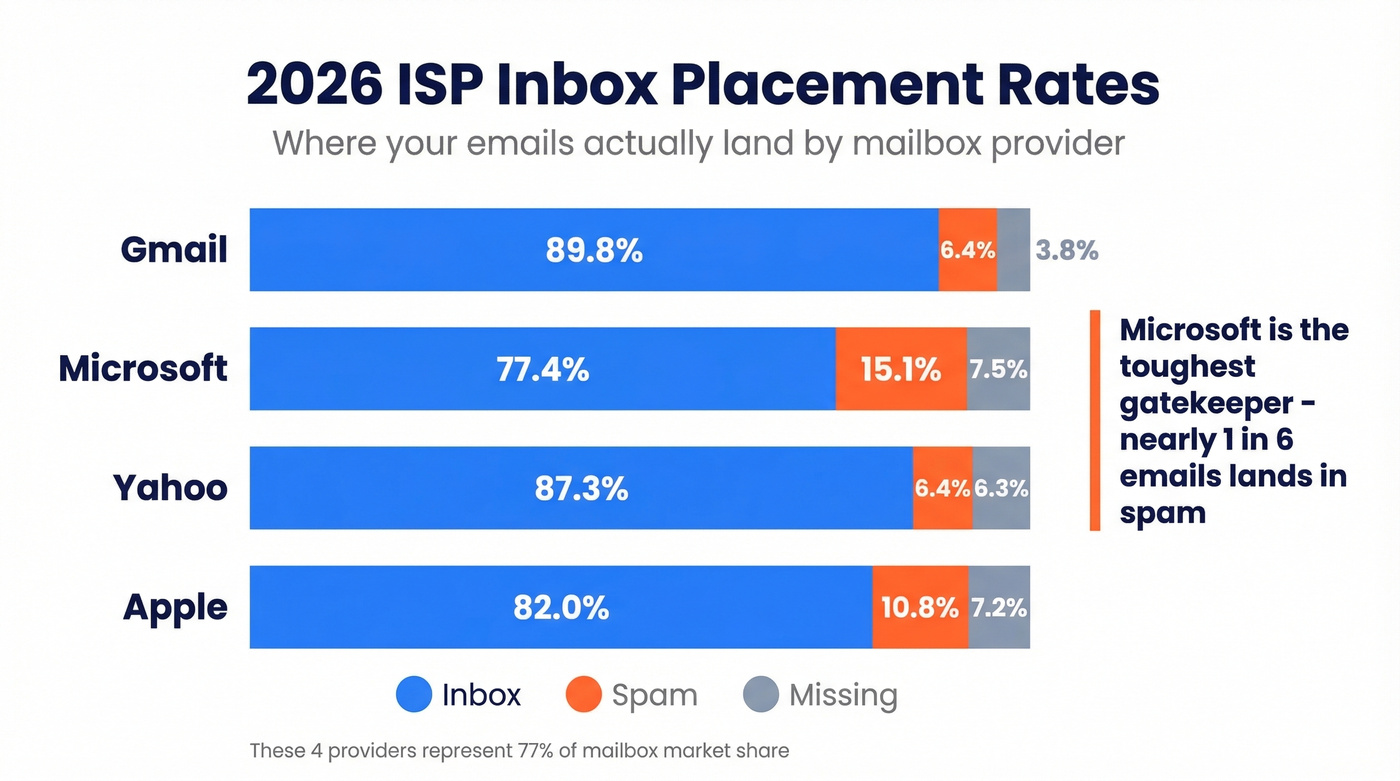
These figures come from EmailTooltester's deliverability statistics roundup, summarizing mailbox-provider benchmark data. Individual sender results vary widely based on reputation and list quality. The four providers above represent 77% of mailbox market share.
Microsoft is the toughest gatekeeper - nearly 1 in 6 emails lands in spam. If your audience skews toward corporate Outlook addresses, your deliverability numbers will look worse than a team sending primarily to Gmail. That's a structural reality, not necessarily a flaw in your sending practices.
Deliverability also varies significantly by ESP. Top performers like ActiveCampaign hit 94%+ deliverability rates in testing, while others fall below 80%. If you're evaluating ESPs, ask for their deliverability data broken down by ISP - the aggregate number hides massive variation.
Industry Benchmarks
| Industry | Inbox Rate |
|---|---|
| Travel & Hospitality | ~68% |
| Retail / E-commerce | ~62% |
| Education | ~61% |
| Media / Publishing | ~59% |
| Software / Tech | ~58% |
| Financial Services | ~57% |
The spreads are wide - Travel & Hospitality sees ±10% variance, while Financial Services is tighter at ±2%. If you're a SaaS company hitting 58% inbox placement, you're roughly average. Not great, but not an emergency.
Here's the thing: across the full dataset, authentication adoption was high (SPF 92%, DKIM 88%, DMARC 69%), yet spam placement still exceeded 30% even with full authentication in place. Authentication gets you in the door. Reputation, content quality, and list hygiene determine whether you stay.
Most teams obsess over authentication setup and ignore list quality. If your bounce rate is above 2%, you could have perfect SPF, DKIM, and DMARC alignment and still watch your inbox placement crater. Fix the data before you touch the DNS records.
Lists decay at 22.71% per year. Every invalid address chips away at your sender reputation - the metric that actually controls inbox placement. Prospeo's 5-step verification catches spam traps, honeypots, and dead addresses before they hit your ESP, keeping bounce rates under 1%.
Fix your list quality before you touch another DNS record.
2026 Authentication Requirements
Authentication is table stakes in 2026, not a competitive advantage. With 92% SPF adoption already in the wild, having proper records doesn't differentiate you - but missing them will get you blocked.
The big shift came in waves. Google and Yahoo enforced bulk sender requirements starting in 2024, mandating SPF, DKIM, and DMARC alignment plus easy unsubscribe and low complaint rates for anyone sending at scale. Then Microsoft followed in May 2025, requiring SPF, DKIM, and DMARC (at least p=none) for domains sending over 5,000 emails per day to Outlook.com addresses. Microsoft's enforcement started with routing non-compliant messages to Junk, with full 550 rejection planned - the rejection code is explicit: "550; 5.7.515 Access denied, sending domain does not meet the required authentication level."
Your deliverability report should flag authentication status as a binary pass/fail. Either you're compliant or you're not. Spend your analytical energy on the metrics that actually move - inbox placement, engagement, and list quality.
How to Build Your Own Report
What to Include
The best deliverability reports follow a simple framework. A thread on r/Emailmarketing from an email marketing agency laid out a clean monthly audit structure: campaigns sent, total emails, inbox/promotions/spam placement breakdown, bounce rate, unsubscribes, subscriber growth, revenue, and actionable recommendations.
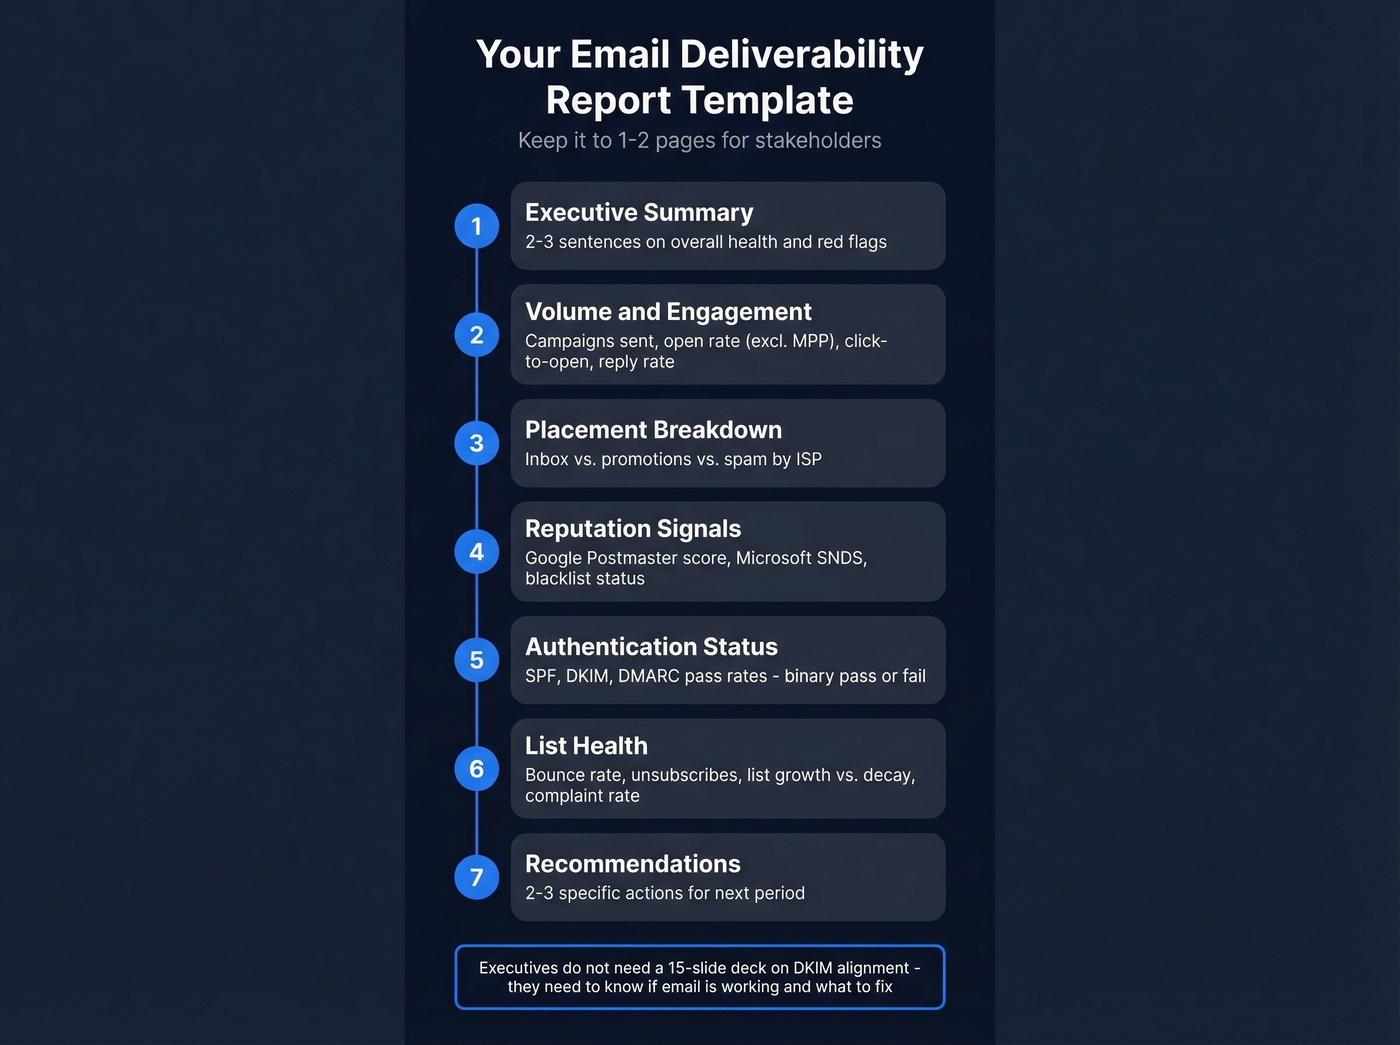
Here's a template you can adapt today:
- Executive summary - 2-3 sentences on overall deliverability health and any red flags
- Volume & engagement - campaigns sent, total emails, open rate (excl. MPP), click-to-open ratio, reply rate
- Placement breakdown - inbox vs. promotions vs. spam percentages by ISP
- Reputation signals - Google Postmaster domain reputation, Microsoft SNDS score, blacklist status
- Authentication status - SPF/DKIM/DMARC pass rates (binary: all passing or not)
- List health - bounce rate, unsubscribe rate, list growth vs. decay, complaint rate
- Recommendations - 2-3 specific actions for next period
Keep it to 1-2 pages for stakeholders. Executives don't need a 15-slide deck on DKIM alignment - they need to know whether email is working and what to fix.
Building a Live Dashboard
Beyond the static report, consider setting up a live email deliverability dashboard that pulls data from Google Postmaster Tools, your ESP, and GlockApps into a single view. Tools like Google Looker Studio or Databox can aggregate these sources so you're not logging into five platforms every morning. The dashboard handles real-time monitoring; the monthly report handles analysis and recommendations.
How Often to Review
| Frequency | What to Check |
|---|---|
| Daily | Open rate, bounce rate, soft bounces |
| Weekly | Campaign performance, spam complaints, unsubscribes, active audience trend |
| Monthly | Inbox placement test, spam score, list health audit, revenue per customer, email client share |
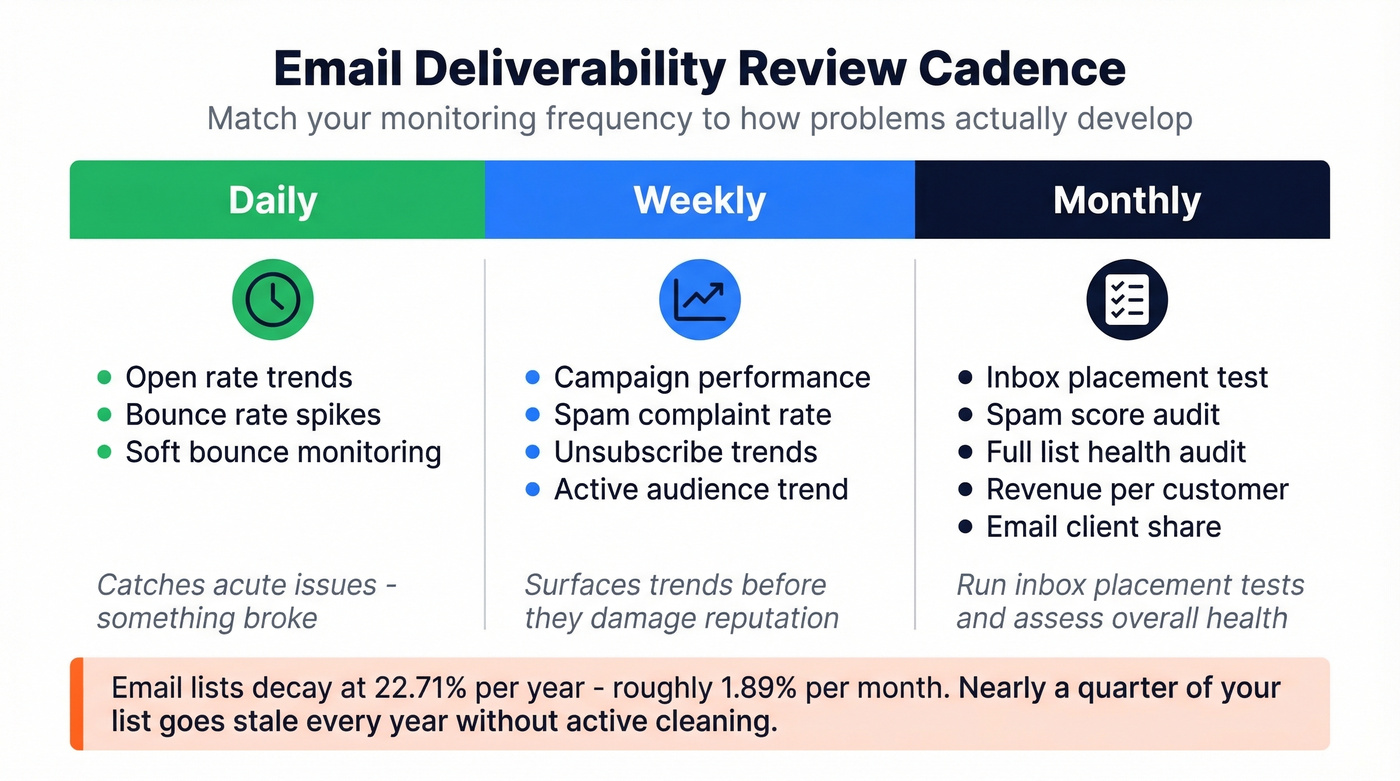
This cadence framework draws from Bloomreach's analytics deep-dive, and it maps well to how deliverability problems actually develop. Daily checks catch acute issues - a sudden bounce spike means something broke. Weekly reviews surface trends and let you spot engagement decay before it damages reputation. Monthly audits are where you run inbox placement tests and assess overall list health.
One stat that should inform your cadence: email lists decay at 22.71% annually, roughly 1.89% per month. If you're not actively cleaning your list, nearly a quarter of it goes stale every year.
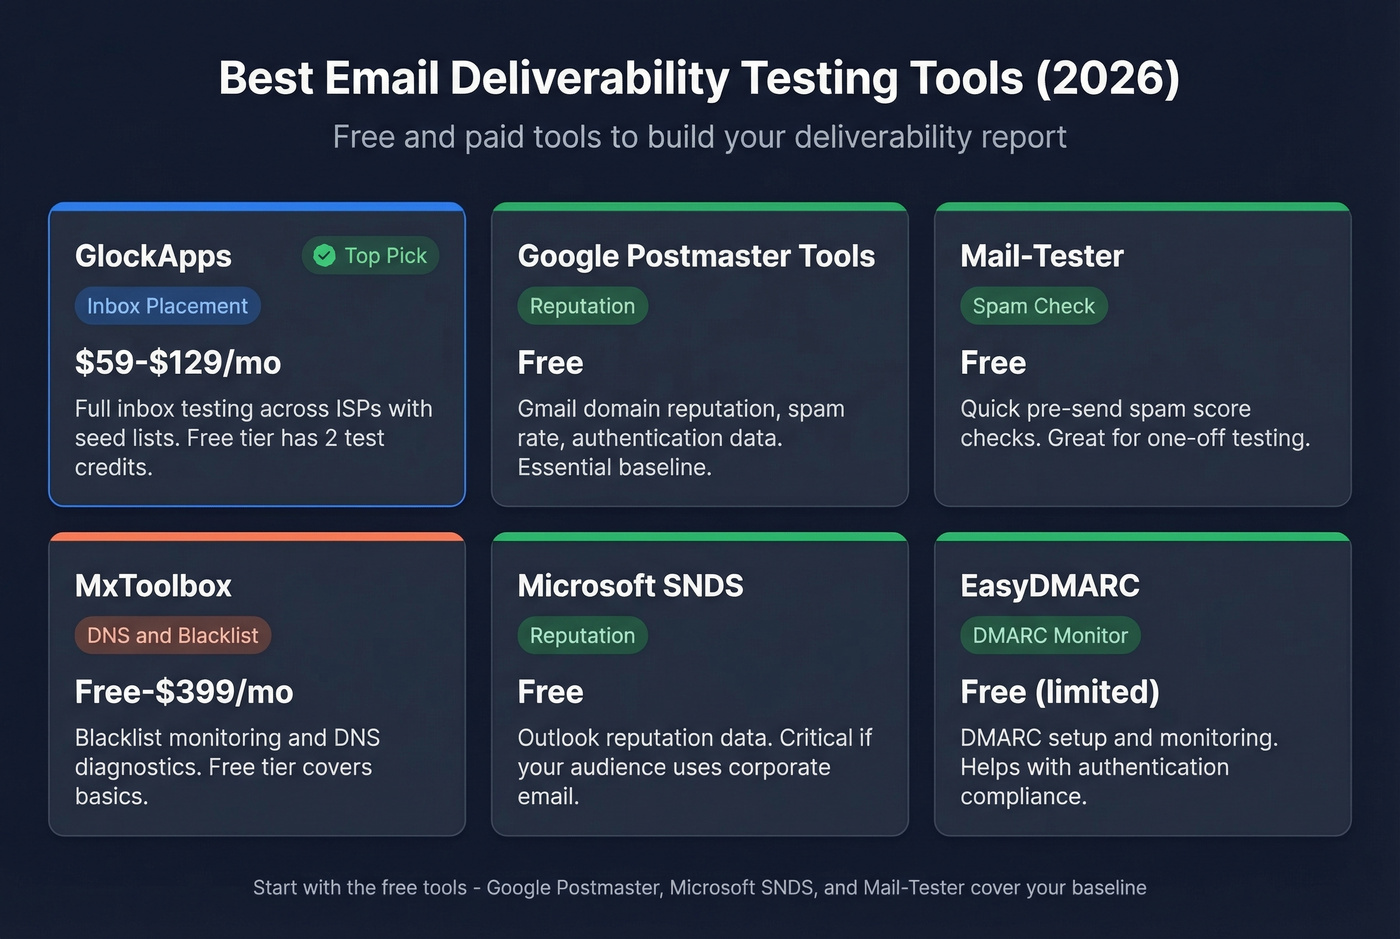
Best Deliverability Testing Tools
| Tool | Type | Price | Best For |
|---|---|---|---|
| GlockApps | Inbox placement | Free-$129/mo | Full inbox testing |
| Google Postmaster | Reputation | Free | Gmail reputation |
| Mail-Tester | Spam check | Free | Pre-send checks |
| MxToolbox | DNS/blacklist | Free-$399/mo | Blacklist monitoring |
| Microsoft SNDS | Reputation | Free | Outlook reputation |
| EasyDMARC | DMARC monitor | Free (limited) | DMARC setup |
GlockApps
If we had to pick one paid deliverability tool, it's GlockApps. The Essential plan at $59/month gives you 360 spam test credits, monitoring across 50+ blocklists, DMARC monitoring with 600,000 messages included, and spam scoring from Google, Barracuda, and SpamAssassin.
What earns its price is real inbox placement testing across ISPs. You send to their seed list, they tell you exactly where your email landed - inbox, spam, promotions, or missing - broken down by Gmail, Outlook, Yahoo, and others. The free tier gives you 2 test credits to try it out. Growth ($99/mo) and Enterprise ($129/mo) tiers add more credits and sending accounts for agencies or multi-brand teams.
Google Postmaster Tools
Non-negotiable for any team sending to Gmail addresses. It's free, it shows your domain reputation on a four-tier scale, and it surfaces spam rate data that you can't get anywhere else. The authentication dashboard confirms whether your SPF, DKIM, and DMARC records are passing in production - not just configured, but actually working.
The limitation is scope. Postmaster Tools only shows Gmail data. You get zero visibility into Microsoft, Yahoo, or Apple inboxes. We've seen teams rely solely on Postmaster Tools and miss that their Outlook deliverability had cratered - Gmail was fine, but 40% of their audience was on Microsoft. Pair it with SNDS and GlockApps for full coverage.
Mail-Tester
Free, fast, and useful for one-off pre-send checks. Send a test email to their generated address, get a spam score based on SpamAssassin, and see what's flagging. It won't give you inbox placement data across ISPs, but it catches obvious content and authentication issues before you hit send. Daily limits apply on the free tier, so it's a spot-check tool, not a monitoring solution.
Skip this if you're already running GlockApps - it's redundant for most workflows at that point.
MxToolbox
The go-to for blacklist monitoring and DNS diagnostics. The free version handles basic lookups: check if your IP or domain is on any major blocklists, verify your MX records, test SPF syntax. Paid plans include a $129 Delivery Center tier and a $399 Plus tier for continuous monitoring and alerting. Best for ops teams who need infrastructure-level visibility rather than campaign-level testing.
Other Tools Worth Knowing
EasyDMARC helps with DMARC setup and monitoring, and it also offers a free inbox placement test with a daily limit. Microsoft SNDS (Smart Network Data Services) is free and gives you reputation data for your sending IPs against Outlook/Hotmail - the Microsoft equivalent of Google Postmaster Tools. MailGenius offers a free deliverability/spam checker that simulates checks across major providers and flags common authentication, DNS, and blacklist issues. All three fill specific gaps and are worth bookmarking.
Why Tools Give Different Results
Here's a frustration that comes up constantly on r/Emailmarketing: you run the same email through three deliverability tools and get three different verdicts. One says inbox, another says promotions, a third says spam.
This isn't a bug - it's how seed-list testing works. Each tool uses different seed addresses, different mailbox configurations, and different scoring models. Timing matters too. Run the same test an hour apart and results shift because ISP filtering is dynamic.
Stop chasing a perfect score from any single tool. Pick 2-3 tools, run them consistently, and track trends over time. A GlockApps score dropping from 85% to 72% inbox placement over three months is a meaningful signal regardless of whether the absolute number is "right." The trend is what matters, not the snapshot.
How to Improve Your Results
Fix Your Data First
Most deliverability problems start upstream, before you write a single subject line. Bad email addresses cause bounces. Bounces damage sender reputation. Damaged reputation tanks inbox placement. It's a cascade, and the fix is at the top of the funnel.
With lists decaying at 22.71% annually, even a clean list from six months ago has significant rot. Prospeo's 5-step verification process catches invalid addresses, spam traps, and honeypots before they hit your sending infrastructure - the 98% email accuracy rate and 7-day data refresh cycle mean you're working with current data, not stale records from a database that updates every six weeks. Stack Optimize built from $0 to $1M ARR using Prospeo-verified data, keeping client deliverability above 94% with bounce rates under 3% and zero domain flags across all clients.
If your bounce rate is above 2%, no amount of content optimization or authentication tweaking will save your deliverability. Fix the data first.
Authentication & Content Checklist
Once your list is clean, work through these items. Each one is a direct lever on inbox placement.
SPF, DKIM, DMARC alignment - all three passing, DMARC at p=quarantine or p=reject. Having p=none satisfies minimum requirements but doesn't protect your domain from spoofing.
List-Unsubscribe header - only 14% of emails in the Unspam dataset had a compliant List-Unsubscribe header. This is the easiest win available, and major providers now require it for bulk senders.
HTML structure - 74% of tested emails had structural issues, and poor HTML made emails 18-25% more likely to land in spam. Validate your templates with a tool like Litmus or Email on Acid before every template change.
Link integrity - 1 in 8 emails had broken or unreachable links. Check every link before every send. Broken links are a spam signal.
IP warming - if you're sending from a new IP or domain, warm up gradually. Start with your most engaged segments and scale volume over 2-4 weeks. Jumping straight to full volume on a cold IP is one of the fastest ways to land on a blocklist.
Feedback loops - register for ISP feedback loops from Microsoft, Yahoo, and others so you receive notification when recipients mark your email as spam. This data feeds directly into your reporting and helps you identify problematic campaigns or segments before the damage compounds.
Your deliverability report is only as good as the data feeding your campaigns. Prospeo refreshes 300M+ profiles every 7 days - not every 6 weeks like competitors - so you're never sending to addresses that decayed since your last audit. At $0.01 per verified email, clean data costs less than one spam complaint.
Stop diagnosing deliverability problems you could prevent entirely.
FAQ
What should an email deliverability report include?
It should cover inbox placement rates by ISP, spam complaint rate, bounce rate, authentication pass/fail status for SPF, DKIM, and DMARC, blacklist checks, and engagement metrics like open rate and click-to-open ratio. The best reports add a recommendations section with specific actions - for example, "bounce rate hit 2.3%, verify list before next send."
What's a good inbox placement rate?
Above 89% is good; above 95% is excellent. Below 80% signals a problem needing immediate attention. Don't confuse this with your ESP's "delivery rate," which typically shows 97-99% and measures SMTP acceptance - not whether your email actually reached the inbox. The two numbers can differ by 30+ percentage points.
How often should I run deliverability tests?
Run inbox placement tests before major campaigns and at least monthly for ongoing monitoring. Check Google Postmaster Tools daily to watch for reputation shifts and spam rate spikes. Review a full report combining placement data, authentication status, and engagement metrics on a weekly cadence at minimum.
Can email verification improve deliverability?
Yes - it's the single highest-leverage fix. Lists decay at 22.71% per year, and sending to invalid addresses spikes bounce rates, which directly damages sender reputation. Verification that includes spam-trap and honeypot removal keeps bounces under 1%, and that alone can shift inbox placement by double digits.