How to Build a Google Sheets Sales Tracker That Actually Survives Past Week One
It's Monday morning. You open the team's pipeline spreadsheet and find three different spelling variations of "Negotiation," a deal marked "Closed Won" with no dollar value, and a row someone inserted that broke every formula below it. 32% of sales reps spend over an hour per day on manual data entry - most of it wasted fighting a Google Sheets sales tracker that was never built properly in the first place.
Stop downloading templates. Build your own in 30 minutes. Templates break the moment you customize them because you don't understand the formulas underneath. Building from scratch means you'll actually maintain it - and you'll know exactly what to fix when something goes sideways. There's a recurring thread in r/CRM of people asking for simpler alternatives to full CRM software, and a well-built Sheets tracker is the most common answer for keeping track of business sales without paying for a tool you'll never fully use.
What Your Tracker Needs
Here's the full build at a glance:
- 11 columns covering every field a deal needs (schema below)
- Core formulas for pipeline value, win rate, weighted forecasting, overdue flags, and average deal size
- Data validation dropdowns on 4 columns to prevent the inconsistent-entry problem that kills every tracker
- Weighted pipeline forecasting - the reason your pipeline number is probably a lie if you only report unweighted totals
- Build time: ~30 minutes if you follow the sections in order
The weighted forecasting piece is the differentiator. A $140K pipeline isn't $140K of revenue. If you're reporting unweighted numbers to your VP, you're setting yourself up for a bad quarter.
Set Up Your Columns
Your tracker needs 11 columns. Not 7 (too sparse to forecast), not 20 (you'll stop updating it by Wednesday). We've rebuilt enough broken trackers to know this is the sweet spot:
| Column | Letter | Purpose | Example |
|---|---|---|---|
| Deal ID | A | Unique key for lookups | D-0042 |
| Date Created | B | Track pipeline age | 2026-03-15 |
| Contact Name | C | Who you're selling to | Sarah Chen |
| Company | D | Account-level view | Acme Corp |
| Email / Phone | E | Reachable contact info | sarah@acme.com |
| Deal Value | F | Revenue if closed | $24,000 |
| Stage | G | Where the deal sits | Demo/Proposal |
| Probability % | H | Auto-calculated weight | 50% |
| Expected Close | I | Forecast timing | 2026-04-30 |
| Status | J | Open vs. Closed | Open |
| Source | K | Attribution | Webinar |
Deal ID matters more than people think. Without it, every VLOOKUP and automation you add later breaks when someone sorts the sheet or deletes a row. Use a simple prefix-number format (D-0001, D-0002) and increment manually or with a formula.
The Source column is the one most people skip and most regret skipping. Without it, you can't answer "which channel produces our best deals?" - and that's the question your CEO will ask at the end of the quarter. In our experience, it's the column that pays for itself every single time.
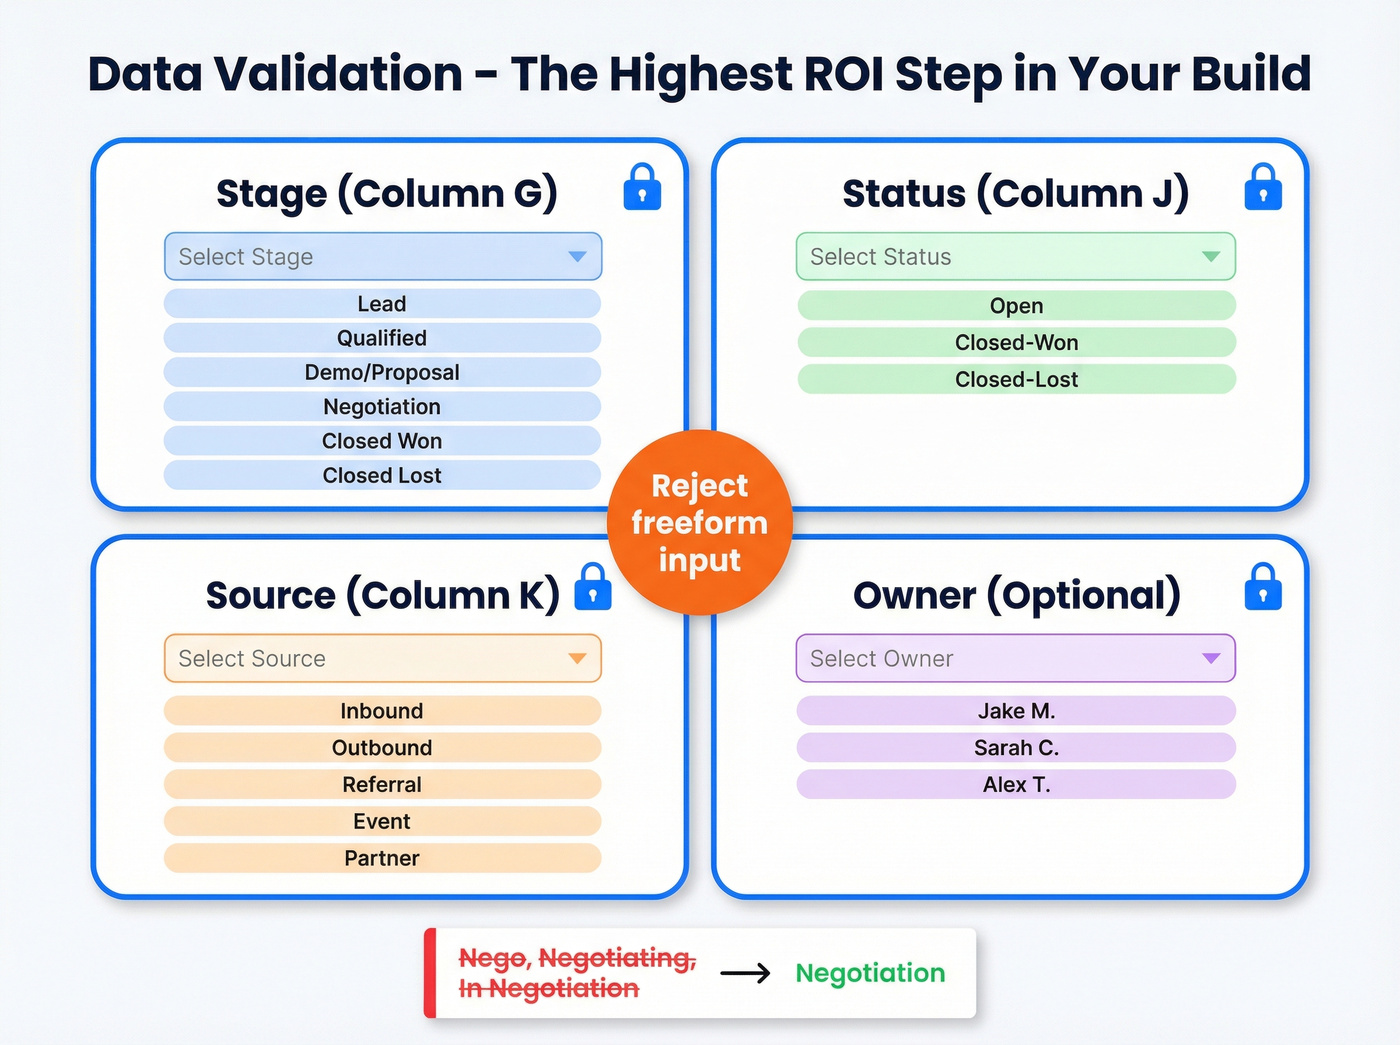
Lock It Down with Data Validation
Inconsistent data entry is the number one reason sales trackers die. Someone types "Nego" instead of "Negotiation," and suddenly your SUMIF formulas miss an entire deal stage. Dropdowns fix this permanently.
- Select the entire Stage column (click the column header).
- Go to Data > Data validation.
- Choose List of items.
- Enter your stages:
Lead, Qualified, Demo/Proposal, Negotiation, Closed Won, Closed Lost. Keep it to 4-6 stages - more than that and reps won't bother categorizing correctly. - Turn on Reject input so nobody can type a freeform value.
Now repeat for three more columns:
- Status (column J):
Open, Closed-Won, Closed-Lost- this is separate from Stage and lets your dashboard formulas cleanly split active pipeline from historical results. - Source (column K):
Inbound, Outbound, Referral, Event, Partner- customize to your channels, but lock it down.
For rep-level views inside the same tracker, add an Owner column and validate it the same way. This prevents "Jake," "Jake M," and "J. Martinez" from showing up as three different people in your reports.
Five minutes of dropdown setup saves you hours of data cleanup later. Dropdowns aren't optional - they're structural. This is the single highest-ROI step in the entire build, and it's what separates a real sales activity tracking spreadsheet from a messy contact list.
Formulas That Power the Tracker
Here are the formulas that make it work. Column letters match the 11-column schema above.
Stage-to-probability auto-mapping (put this in the Probability column, H2):
=IF(G2="Lead",0.1,IF(G2="Qualified",0.25,IF(G2="Demo/Proposal",0.5,IF(G2="Negotiation",0.75,IF(G2="Closed Won",1,0)))))
This eliminates manual probability entry. When a rep changes the Stage dropdown, probability updates automatically.
Weighted deal value (put this in a new helper column if you want it visible, or calculate it on the dashboard):
=F2*H2
Simple multiplication - deal value times probability. This is the building block for your forecast.
Overdue flag (checks if expected close date has passed on an open deal):
=IF(AND(I2<TODAY(), G2<>"Closed Won", G2<>"Closed Lost"), "OVERDUE", "")
Total open pipeline (sum Deal Value where Status is Open):
=SUMIF('Sales Log'!J:J, "Open", 'Sales Log'!F:F)
Win rate (with error handling for zero closed deals):
=IFERROR(COUNTIF(J:J,"Closed-Won") / (COUNTIF(J:J,"Closed-Won") + COUNTIF(J:J,"Closed-Lost")), "N/A")
Average deal size (closed-won only):
=IFERROR(AVERAGEIF(J:J,"Closed-Won",F:F), 0)
Two more formulas worth adding from day one: pipeline by stage =SUMIF(G:G, "Demo/Proposal", F:F) and deals per stage =COUNTIF(G:G, "Demo/Proposal"). Repeat for each stage.
Drag these formulas down the entire column so new rows auto-calculate, or wrap them in ARRAYFORMULA so they extend automatically.
Add Weighted Pipeline Forecasting
Your unweighted pipeline number is fiction. A deal in Discovery and a deal in Negotiation don't carry the same weight, but an unweighted total treats them identically. Weighted forecasting is what separates a useful tracker from a glorified contact list.
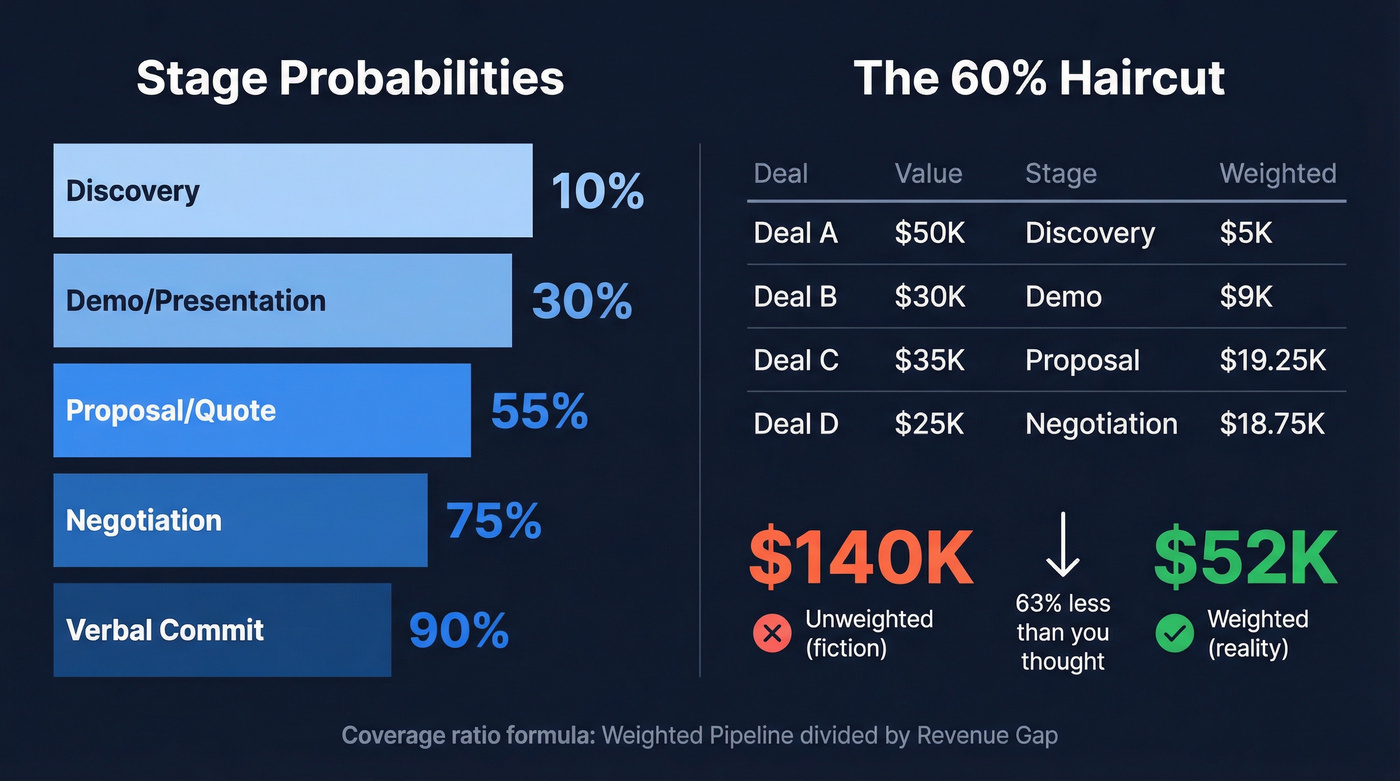
Software Equity Group's benchmarks for B2B SaaS stage probabilities:
| Stage | Probability |
|---|---|
| Discovery | 10-15% |
| Demo/Presentation | ~30% |
| Proposal/Quote | 50-60% |
| Negotiation | 75-80% |
| Verbal Commit | 90-95% |
A worked example from Forecastio makes this concrete: $140K in unweighted pipeline across four deals becomes $56K weighted after applying stage probabilities. That's a 60% haircut - and it's the realistic number you should be forecasting against.
The formula you already built (=F2*H2) handles this per deal. Sum that weighted column for your total weighted pipeline.
Now for the coverage ratio - the metric that tells you whether you have enough pipeline to hit your number:
Weighted Pipeline / Revenue Gap = Coverage Ratio
Say your quarterly target is $200K and you've closed $80K. Your revenue gap is $120K. A weighted pipeline of $180K gives you 1.5x coverage. For SMB teams with fast sales cycles, 1.5-2x coverage is comfortable. Enterprise teams with longer cycles need 4-5x. When your founder asks "are we going to hit the number?" - this formula gives the honest answer.
Let's be honest: if your average deal is under five figures, you probably don't need a CRM at all. A weighted Sheets tracker with proper data validation will outperform a half-configured HubSpot instance every time. The tool you actually update beats the tool you abandon after the onboarding call.
A tracker with empty email and phone columns is just a wish list. Prospeo fills those fields with 98% accurate emails and verified direct dials from 300M+ profiles - at $0.01 per email.
Stop tracking deals you can't actually reach.
Build a Self-Updating Dashboard
Your raw data sheet shouldn't be your reporting view. Create a second tab called "Dashboard" and pull everything in with formulas. Before you start experimenting, make a copy of your tracker - one for testing, one for live data.
In column A of the dashboard, list your stages. In column B, use COUNTIF to count deals per stage:
=COUNTIF('Sales Log'!G:G, A2)
Select that table, go to Insert > Chart, and pick a bar chart. This gives you a visual pipeline shape that updates every time a rep changes a deal stage. If you're used to building charts and graphs for sales reports in Excel, the workflow in Sheets is nearly identical - select your data range, choose a chart type, and customize labels.
Add KPI cells at the top of the dashboard:
- Total Pipeline (open deals):
=SUMIF('Sales Log'!J:J, "Open", 'Sales Log'!F:F) - Total Revenue (closed-won):
=SUMIF('Sales Log'!J:J, "Closed-Won", 'Sales Log'!F:F) - Deals Won:
=COUNTIF('Sales Log'!J:J, "Closed-Won") - Win Rate: the same IFERROR/COUNTIF formula from earlier
- Average Deal Size:
=IFERROR(AVERAGEIF('Sales Log'!J:J,"Closed-Won",'Sales Log'!F:F), 0)
For visual urgency, add conditional formatting to your expected close dates: red for overdue, orange for today, grey for future. Select the close date column, go to Format > Conditional formatting, and set rules using custom formulas like =$I2<TODAY().
Create filtered views per rep. Go to Data > Create a filter view, filter the Owner column to one rep, and name the view. Each rep gets their own clean view without messing up anyone else's filters.
Keep Your Contact Data Clean
Every guide on building a sales tracker assumes you have accurate contact data. Nobody addresses what happens when half your emails bounce and a quarter of your phone numbers are disconnected. That's phantom pipeline - deals that look active but are completely unreachable.
Before any contact enters your tracker, verify the email. Prospeo handles this in bulk - upload a CSV of your prospect list, and it returns verified results at 98% email accuracy with a 7-day refresh cycle. The free tier covers 75 email verifications per month, no credit card required. It's the difference between a pipeline full of real conversations and a pipeline full of ghosts.
Automate What Hurts
Three levels of automation, matched to your technical comfort:
| Approach | Effort | Self-Updating? |
|---|---|---|
| Manual CSV import | Low | No |
| No-code connector | Medium | Yes |
| Apps Script | High | Yes |
Manual CSV import works fine if you're a solo founder updating weekly. Export from your email tool, paste into the sheet, move on.
No-code connectors like Coupler.io or Coefficient sync CRM data directly into Sheets on a schedule. Coefficient can pull Salesforce Opportunity data into a pivot table and you can extract values into your own grid with INDEX/MATCH - useful if you're running Sheets as a reporting layer on top of a CRM. Sheets' built-in pivot table works the same way as Excel's: select your data range, go to Insert > Pivot table, and drag Stage into rows and Deal Value into values for an instant breakdown.
Another strong pattern: use a Google Form as a deal-entry front end, then connect it to your tracker via Zapier, Make, or n8n. The form response lands in a staging sheet, and an ARRAYFORMULA with TRIM and PROPER cleans up the data before it hits your main tracker. This prevents reps from ever touching the raw data sheet directly, which is exactly the kind of guardrail that keeps a sales activity tracking spreadsheet alive past month one.
Apps Script is where it gets powerful. Here's a common pattern - auto-timestamp when a deal changes stage:
function onEdit(e) {
  var sheet = e.source.getActiveSheet();
  if (sheet.getName() === "Sales Log" && e.range.getColumn() === 7) {
    sheet.getRange(e.range.getRow(), 13).setValue(new Date());
  }
}
One critical gotcha: simple onEdit triggers can't send emails or access authorized services. If you want weekly email summaries, you need an installable time-driven trigger - set it up via Extensions > Apps Script > Triggers > Add Trigger and schedule it.
For the weekly maintenance ritual: filter by Owner, sort by Expected Close Date, update every deal's stage, and name the version in File > Version history > Name current version. This takes 30-60 minutes and prevents the slow decay that kills most trackers by month two.
Mistakes That Kill Sales Trackers
Tracking only closed deals, not activities. If you're only logging wins and losses, you can't diagnose why deals stall. Add an Activities tab with a COUNTIF per deal and a follow-up flag: =IF(TODAY()-LastContactDate>7, "FOLLOW UP NEEDED", ""). Treating your tracker as a sales activity tracking spreadsheet - not just a results log - is what lets you coach reps on behavior, not just outcomes.
Missing lead source data. Without a Source column, you can't tell whether your outbound motion or your webinars produce better deals. You're spending budget blind.
No standardized data entry. We've watched teams lose entire quarters of reporting because one rep typed "Closed" instead of "Closed Won." If reps can type anything into the Stage column, your formulas break silently. This is why the data validation step isn't optional.
No follow-up system. The overdue flag formula plus conditional formatting gives you a visual safety net. Without it, deals slip through cracks and you don't notice until the quarter's over.
Reporting unweighted pipeline. Look - if you're telling your VP you have $300K in pipeline without weighting it, you're probably looking at $90-120K of realistic revenue. Use the weighted forecast. It's uncomfortable but honest.
When to Graduate to a CRM
Stay in Sheets if you're managing fewer than 40 active deals, you have 1-2 reps (including yourself), and your sales cycle is straightforward and short.
Move to a CRM when your sheet hits 200-500+ rows and starts lagging, two or more people are editing simultaneously and creating version conflicts, or you need audit trails, automated sequences, and structured objects like leads vs. contacts vs. accounts.
Free CRM options worth testing: HubSpot CRM's free tier handles basic pipeline management well. OnePageCRM has a 21-day trial with solid pipeline views. Skip anything that requires a sales call just to see pricing - if you're graduating from a spreadsheet, you want self-serve onboarding, not a three-week procurement cycle.
We've seen plenty of teams close their first $500K in ARR from a well-maintained Google Sheet. Stop feeling guilty about not using Salesforce. The tracker you'll actually update beats the CRM you'll abandon after the onboarding call.
You just built a tracker with a Source column. Now fill it. Prospeo's 30+ search filters - buyer intent, technographics, funding, headcount growth - let you build targeted lead lists that export straight into Google Sheets with verified contact data.
Turn your empty rows into qualified, reachable prospects in minutes.
FAQ
Can Google Sheets replace a CRM?
Yes, for teams with fewer than ~40 active deals and 1-2 reps. Sheets handles pipeline tracking, basic forecasting, and reporting well at that scale. Beyond that, you'll hit collaboration limits and automation ceilings that make a dedicated CRM worth the investment.
What columns should a sales tracker have?
At minimum: Deal ID, Date Created, Contact Name, Company, Email/Phone, Deal Value, Stage, Probability %, Expected Close Date, Status, and Source. That's 11 columns - enough to forecast accurately without creating data entry burden that reps ignore.
How do I calculate weighted pipeline in Google Sheets?
Multiply each deal's value by its stage probability - a $30K deal at Demo stage (30%) equals $9K weighted. Sum all weighted values for your realistic forecast. The formula is =DealValue*Probability, applied per row and totaled on your dashboard.
How do I make sure the emails in my tracker are accurate?
Use a verification tool before adding contacts. Bad emails create phantom pipeline - deals that look active but are unreachable. Prospeo's free tier covers 75 verifications per month at 98% accuracy, enough for most early-stage pipelines. Bulk CSV upload makes it fast.
How often should I update my sales tracker?
Weekly at minimum. Set a Friday ritual: update every deal's stage, flag overdue follow-ups with conditional formatting, and name the version in Sheets' version history. Teams that skip two consecutive weeks almost always end up with a tracker they can't trust.