Sales Conversion Rate: 2026 Benchmarks, Formulas, and How to Actually Improve It
Your VP just asked whether a 2.3% sales conversion rate is good or bad. You don't know - because "good" depends on your industry, your funnel stage, and whether you're measuring website visitors, qualified leads, or qualified opportunities. The average conversion rate across industries is 2.9%, but that number is almost useless without context.
Let's fix that.
The Short Version
- The average conversion rate across industries is 2.9%, based on 100M+ datapoints measured as visitor to qualified lead. Most B2B teams see 2-5% lead-to-customer conversion, and most B2B website conversion rates land under 5%.
- Stop measuring one number. Break your funnel into stages - Lead, MQL, SQL, Opportunity, Close - and find where deals actually die.
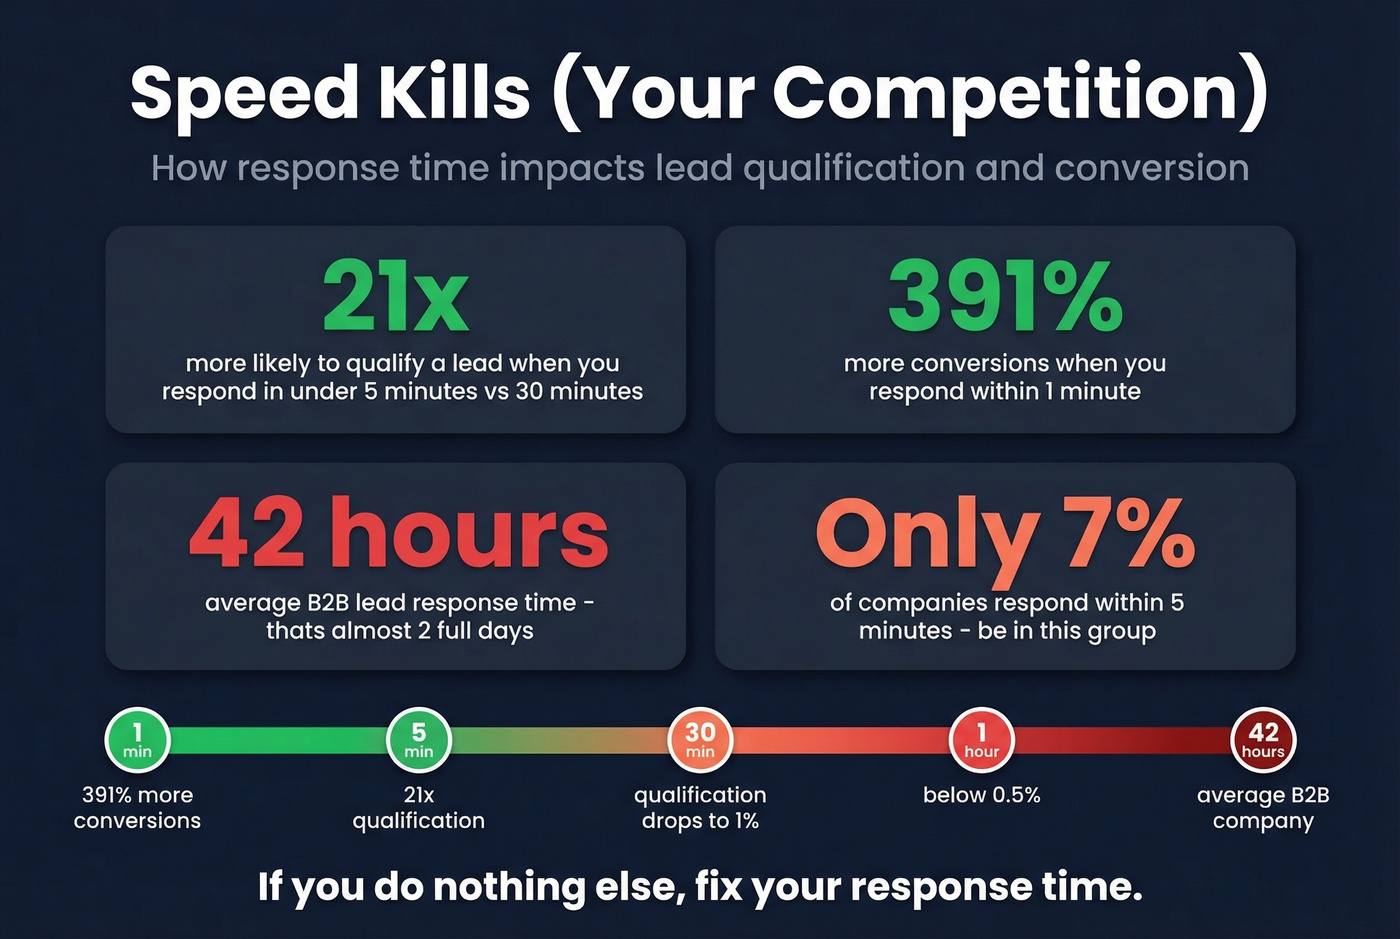
- The single highest-leverage fix: respond to leads within 5 minutes. You're 21x more likely to qualify them vs. waiting 30 minutes.
- If your email bounce rate exceeds 5%, your conversion problem starts before the first conversation. Fix your data first.
What Sales Conversion Rate Actually Means
This metric measures the percentage of prospects who move from one stage to the next - or, more broadly, the percentage who become customers. The formula is straightforward:
Conversions / Total Leads x 100 = Conversion Rate
If your team closed 50 deals from 200 SQLs last quarter, your SQL-to-close rate is 25%. Simple math. The confusion starts when people use "conversion rate" to mean three very different things: website visitor-to-lead rate, lead-to-customer rate, and opportunity-to-close rate (also called win rate). These are all valid conversion metrics. They just measure different stages.
A 2% website conversion rate and a 2% close rate are wildly different problems. Throughout this piece, we'll specify which stage transition we're talking about - and you should do the same in your own reporting. Sloppy definitions create sloppy dashboards.
How to Calculate It at Every Stage
Every funnel stage has its own conversion rate, and each one tells you something different about where your pipeline is leaking.
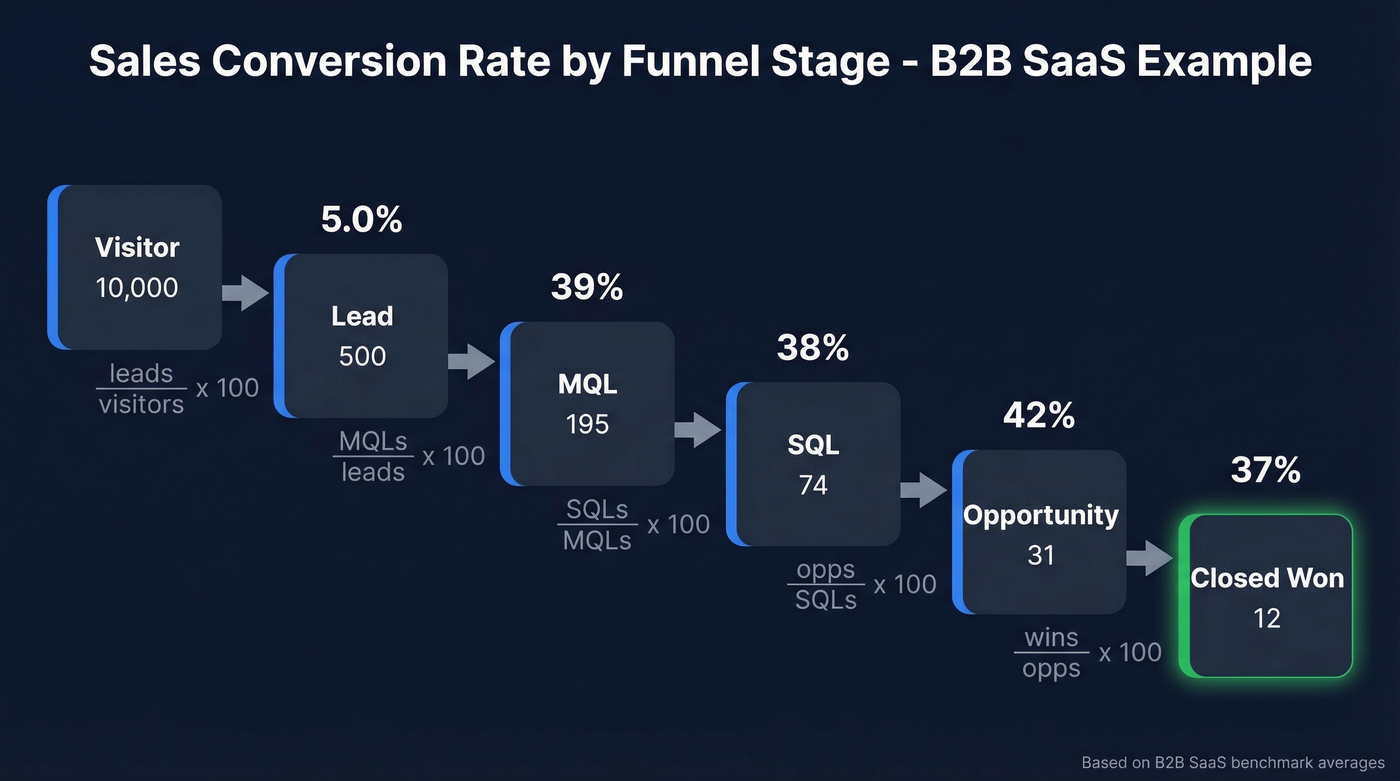
- Visitor to Lead: Website visitors who fill out a form, start a chat, or request a demo. Formula: leads / unique visitors x 100.
- Lead to MQL: Raw leads that meet your marketing qualification criteria. If you generated 1,000 leads and 390 became MQLs, that's 39%.
- MQL to SQL: Marketing-qualified leads that sales accepts. This is where alignment - or misalignment - between sales and marketing shows up fast.
- SQL to Opportunity: Qualified leads that enter a formal sales process with a defined deal value.
- Opportunity to Close: Deals that close-won. This is your win rate.
Some benchmark sources report "SQL to Closed" as a single metric, skipping the Opportunity stage entirely. That's fine for high-level comparison, but it hides whether your problem is deal creation or deal closing. Track both if your CRM supports it.
2026 Benchmarks by Industry
This is the section you'll bookmark.
Website Visitor to Lead (B2B)
These numbers come from First Page Sage's dataset covering client data from Jan 2022 through Aug 2025, spanning 25 industries.
| Industry | CVR |
|---|---|
| Legal Services | 7.4% |
| HVAC Services | 3.1% |
| Staffing & Recruiting | 2.9% |
| Higher Education | 2.8% |
| Real Estate | 2.7% |
| Industrial IoT | 2.6% |
| Manufacturing | 2.2% |
| Financial Services | 1.9% |
| IT & Managed Services | 1.5% |
| Transportation & Logistics | 1.4% |
| B2B SaaS | 1.1% |
| Software Development | 1.1% |
Most B2B rates don't exceed 5%. If you're sitting at 1-2% in SaaS, you're normal - not broken.
Stage-by-Stage Funnel Benchmarks
This is where the real diagnostic power lives. Data from the same dataset's funnel report:
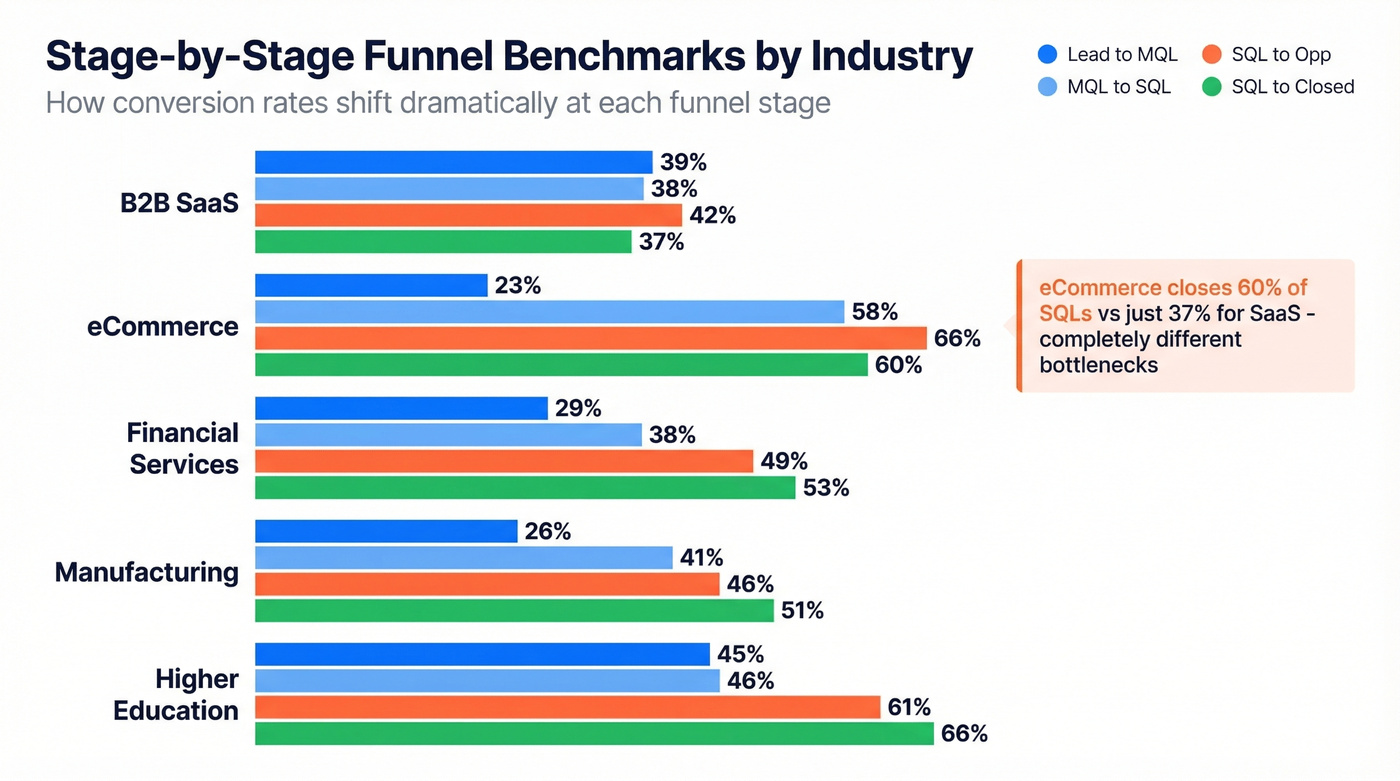
| Industry | Lead to MQL | MQL to SQL | SQL to Opp | SQL to Closed |
|---|---|---|---|---|
| B2B SaaS | 39% | 38% | 42% | 37% |
| eCommerce | 23% | 58% | 66% | 60% |
| Financial Services | 29% | 38% | 49% | 53% |
| Manufacturing | 26% | 41% | 46% | 51% |
| Higher Education | 45% | 46% | 61% | 66% |
B2B SaaS converts 39% of leads to MQLs but only 37% of SQLs close. eCommerce closes 60% of SQLs. The bottleneck is different for every industry, and that's exactly why a single number is meaningless without stage context.
Ecommerce Benchmarks
Ecommerce conversion data from Dynamic Yield via Smart Insights, aggregated across 200M+ monthly unique users:
| Device | CVR | Cart Abandonment |
|---|---|---|
| Desktop | 3.2% | 68.1% |
| Mobile | 2.8% | 79.0% |
| Overall | 2.9% | 76.2% |
The real ecommerce story isn't the headline conversion number - it's cart abandonment. Over three-quarters of carts are abandoned, and on mobile it's nearly 80%. Sector matters too: Food & Beverage converts at 4.9%, while Home & Furniture sits at 1.4%. If you're in ecommerce, your biggest lever is probably checkout optimization, not top-of-funnel traffic.
You just read it: bounce rates above 5% kill your conversion rate before a rep even picks up the phone. Prospeo delivers 98% email accuracy with a 7-day data refresh cycle - so your pipeline starts with contacts that actually exist.
Stop losing deals to bad data. Start every sequence with verified contacts.
What Counts as "Good"?
The honest answer: 2.9% is the overall average, and it's a terrible benchmark for any specific team.
Context matters more than the number itself. Your conversion rate is a function of industry, deal size, sales cycle length, channel mix, and how you define "conversion" in the first place. A company selling $500k enterprise contracts with a multi-month sales cycle will have a very different funnel shape than a PLG tool with a free trial.
Your conversion rate also determines your pipeline coverage target - and this is the number your VP actually cares about. At a 25% win rate, you need 4x pipeline to hit quota. At 33%, you need 3x. If your team is scrambling to build 5x pipeline coverage, improving your win rate by even a few points changes the math dramatically.
Here's the thing: stop obsessing over the top-line number. Start obsessing over where in the funnel you're losing deals. A 2% overall rate could mean your top-of-funnel is weak, or it could mean you're generating plenty of leads but bleeding out at MQL to SQL. The diagnosis is completely different, and so is the fix.
Which Channels Convert Best?
Not all channels are created equal, and the gap changes dramatically as you move down the funnel. Here's what B2B SaaS channel performance looks like across stages:
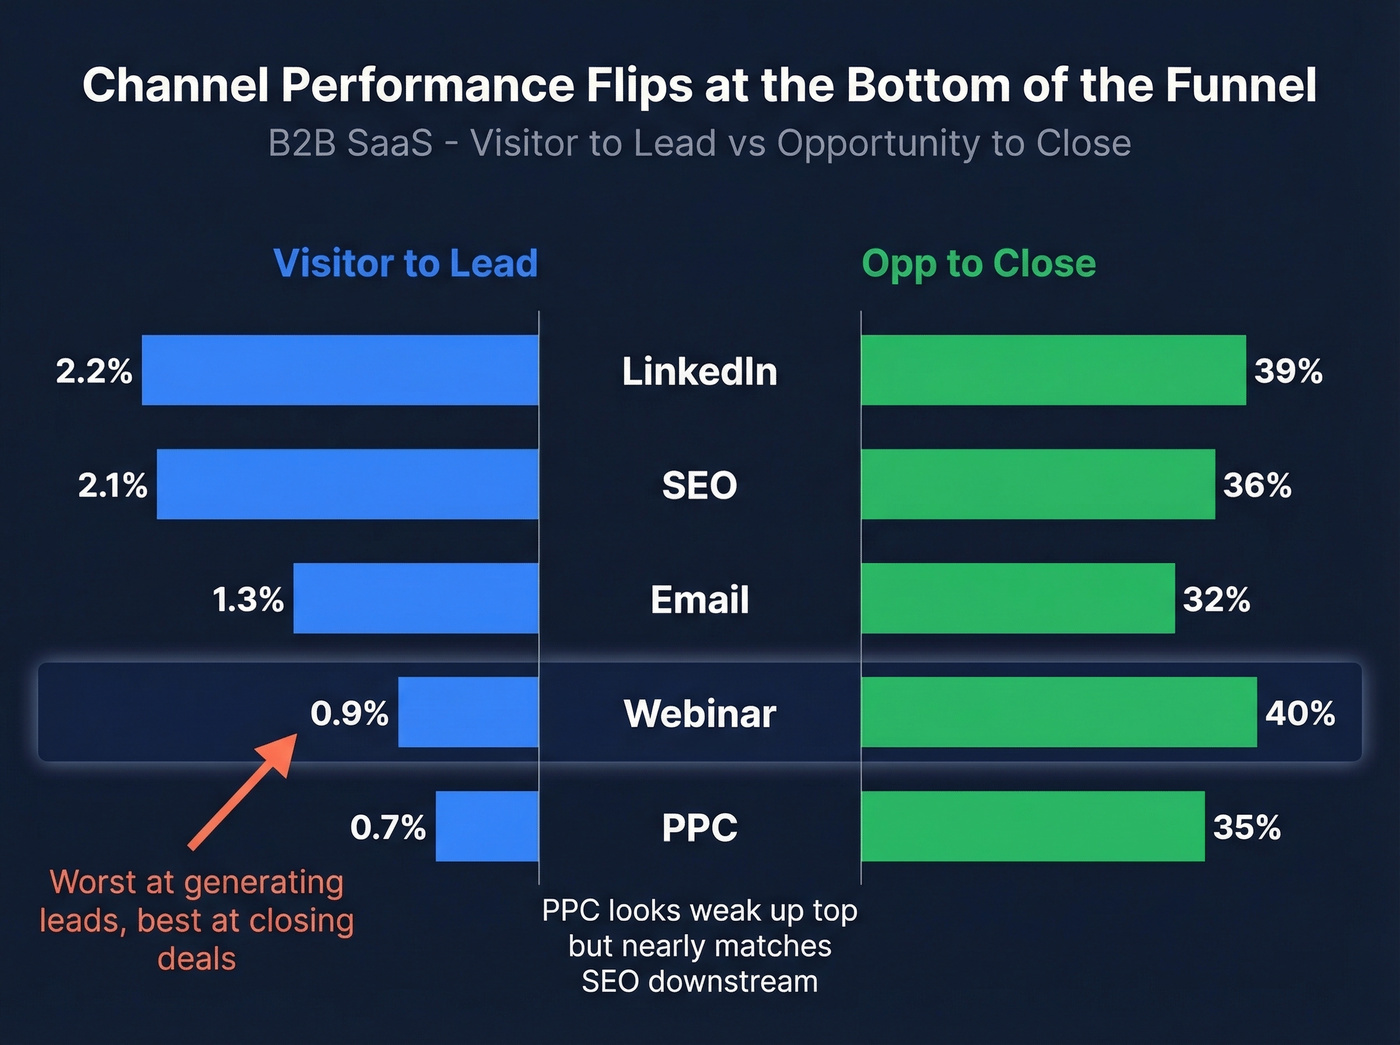
| Channel | Visitor to Lead | Opp to Close |
|---|---|---|
| 2.2% | 39% | |
| SEO | 2.1% | 36% |
| 1.3% | 32% | |
| Webinar | 0.9% | 40% |
| PPC | 0.7% | 35% |
PPC looks weak at visitor-to-lead (0.7%), but its opportunity-to-close rate (35%) nearly matches SEO (36%). The gap narrows dramatically downstream. If you're making budget decisions based only on top-of-funnel conversion, you're almost certainly undervaluing paid channels and overvaluing organic.
Webinars tell a similar story: worst at generating leads (0.9%), best at closing deals (40%). Top-of-funnel conversion doesn't equal revenue contribution. Measure the full funnel before you cut a channel.
Why Your Rate Is Low
Seven common causes, roughly ordered by how often we see them.
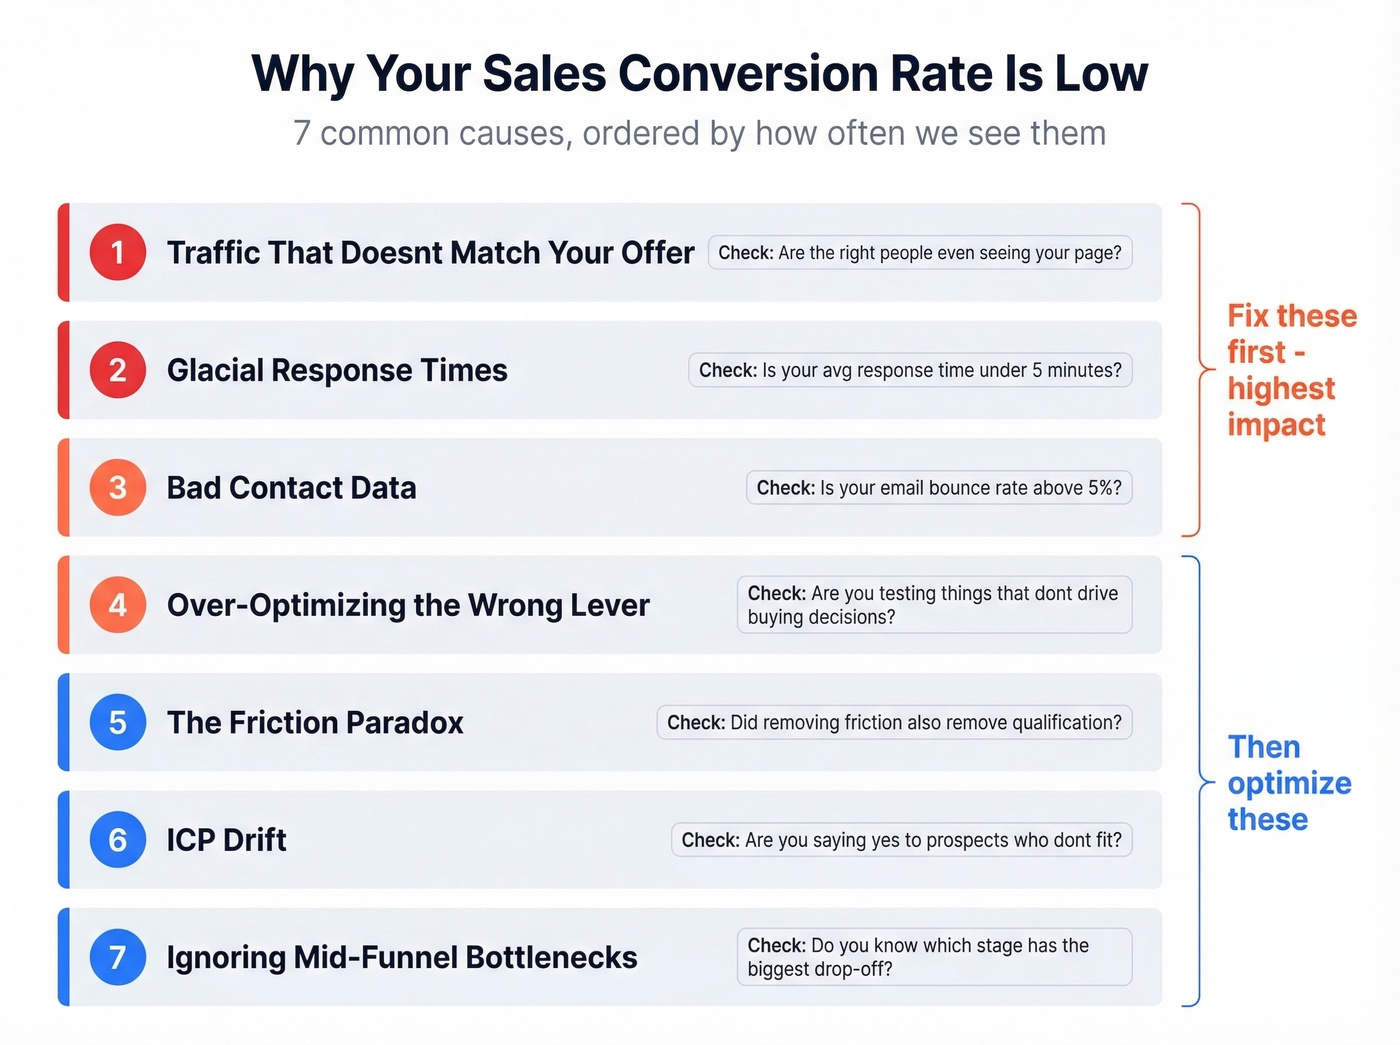
Traffic That Doesn't Match Your Offer
Conversion Rate Experts documented what they call the "Keitai Denwa problem": a company where over 90% of traffic came from a keyword that had nothing to do with their product. Fewer than 10% of visitors arrived with the right intent. No amount of CRO fixes an intent mismatch - before optimizing your landing page, check whether the right people are even seeing it.
Glacial Response Times
The average B2B company takes 42 hours to respond to a lead. Meanwhile, 78% of buyers go with whoever responds first. Only 7% of companies hit the 5-minute mark. If you aren't in that 7%, you're losing deals to competitors who are simply faster.
Bad Contact Data
If 30% of your emails bounce, you're counting leads you never actually reached. Those ghost contacts inflate your denominator and make your conversion metrics look worse than they are - while simultaneously burning your domain reputation. Bounce rates above 5% signal a data quality problem, not a sales problem. Tools like Prospeo verify emails at 98% accuracy and refresh contact data every 7 days, so your pipeline reflects real, reachable prospects instead of phantom leads.
Over-Optimizing the Wrong Lever
Conversion Rate Experts call these "disconnected levers" - page elements that won't move conversions no matter how much you A/B test them. If the hero image isn't the reason people aren't buying, testing 14 hero image variants is wasted effort. Focus on the actual decision drivers: pricing clarity, social proof, and the core value proposition.
The Friction Paradox
Conventional wisdom says reduce friction. But Venture Harbour found that multi-step forms increased their conversions by up to 743%. Sometimes more friction means better qualification, which means higher downstream conversion. A shorter form generates more leads, sure - but if those leads don't close, you've just created more work for your sales team with nothing to show for it.
ICP Drift
Casting too wide a net dilutes conversion at every stage. We've seen teams double their close rate simply by tightening their ICP definition and saying no to prospects who don't fit. Fewer leads, dramatically higher conversion.
Ignoring Mid-Funnel Bottlenecks
Measuring only top-of-funnel hides where deals actually die. A 40% Lead to MQL rate means nothing if your SQL to Opportunity conversion is 15%. The fix for a top-of-funnel problem - more traffic, better targeting - is completely different from a mid-funnel problem like sales enablement, lead scoring, or handoff process. Diagnose before you prescribe.
How to Improve Your Sales Conversion Rate
Seven tactics, ordered by leverage.
Respond in Under 5 Minutes
Responding within 5 minutes makes you 21x more likely to qualify a lead compared to waiting 30 minutes. After 30 minutes, qualification drops to 1%. After an hour, it's below 0.5%. Responding within 1 minute drives 391% more conversions. If you do nothing else from this article, fix your response time.
Verify Your Data Before You Dial
One sales team saw their bounce rate drop from 35% to under 4% after switching to verified contact data - and their pipeline tripled from $100K to $300K per week. Before optimizing your pitch, verify your list. A free verification pass on your existing database will tell you fast whether data quality is your actual bottleneck.
Measure Stage by Stage
Use the funnel benchmarks above as diagnostic targets. If your MQL to SQL rate is 20% and the benchmark is 38%, that's your bottleneck - not your landing page headline.
Build a stage-by-stage dashboard and review it weekly for high-volume stages, monthly for mid-funnel, quarterly for close rates. For landing pages specifically, track scroll depth - aim for 60%+ of visitors reaching your CTA, and keep time-to-first-CTA-impression under 5 seconds on mobile.
Reallocate by Full-Funnel Performance
Look at the channel table again. PPC's visitor-to-lead rate (0.7%) looks terrible, but its close rate (35%) nearly matches SEO (36%). Budget decisions based on top-of-funnel metrics alone will systematically underinvest in channels that produce revenue. Run the full-funnel math before cutting spend.
Add Qualifying Friction
Multi-step forms, qualification questions, progressive profiling - filter tire-kickers early so reps spend time on real buyers. This feels like it should hurt conversion, but it consistently improves downstream metrics. The goal isn't more leads. It's more qualified leads.
Align Sales and Marketing on Definitions
If marketing counts "downloaded a whitepaper" as an MQL and sales expects "requested a demo," your conversion rate is a fiction. We've seen teams unlock a 15-20% improvement in MQL to SQL conversion just by sitting in a room and agreeing on what "qualified" actually means. No new tools, no new spend. Just shared definitions.
Reactivate Warm Leads
Around 30% of leads never get contacted at all. Before spending another dollar on lead generation, work the leads you already have. A re-engagement sequence to 90-day-old leads who never got a follow-up is often the highest-ROI campaign a team can run. If you need copy, start with these sales follow-up templates.
One more thing: Most teams don't have a conversion rate problem. They have a denominator problem - too many unqualified leads inflating the base. If your average deal size is modest and your sales cycle is under 30 days, you probably don't need a bigger funnel. You need a cleaner one.
Improving your SQL-to-close rate by a few points changes your entire pipeline math. Prospeo gives your reps 125M+ verified mobile numbers with a 30% pickup rate - so they reach real decision-makers, not voicemail boxes.
Teams using Prospeo book 26% more meetings than ZoomInfo users.
SaaS-Specific Benchmarks
Product-led growth companies need different metrics entirely.
| Metric | Range | Top Performers |
|---|---|---|
| Visitor to Trial | 2.1%-7.1% | 7%+ |
| Trial to Paid | 12%-28% | 35%+ |
| Lead to Customer | 8%-35% | Varies by ACV |
Sub-industry performance varies too:
| Sub-Industry | Visitor to Lead | Opp to Close |
|---|---|---|
| CRM | 2.0% | 38% |
| Fintech | 1.7% | 39% |
| Adtech | 1.4% | 37% |
These are PLG-specific metrics, distinct from sales-led funnels. If you're running a hybrid motion with both a free trial and a sales-assisted path, track visitor-to-trial and SQL-to-close separately. Blending them into one number obscures what's actually working. For a deeper breakdown, compare against the average B2B lead conversion rate and map your motion to a B2B sales funnel template.
FAQ
What is a good B2B sales conversion rate?
For visitor to qualified lead, the overall average is 2.9% based on 100M+ datapoints. B2B SaaS averages 1.1%, while legal services hits 7.4%. Compare against your industry benchmark, not a universal number, and measure stage by stage to find the real bottleneck.
What's the difference between conversion rate and win rate?
Conversion rate measures any stage transition - visitor to lead, lead to MQL, MQL to SQL. Win rate specifically measures opportunities that close-won. A team can have a strong win rate but low overall conversion if leads aren't qualifying into opportunities in the first place.
How often should you measure conversion rates?
Weekly for high-volume top-of-funnel metrics like visitor-to-lead. Monthly for mid-funnel transitions like MQL-to-SQL. Quarterly for close rates, since B2B deal cycles often span multiple months and monthly snapshots create statistical noise.
Can bad data lower your conversion rate?
Absolutely. If 30% of your emails bounce, those contacts inflate your denominator without ever receiving your message. Cleaning your database with a verified-email tool ensures your metrics reflect actual engagement rather than ghost leads dragging down the numbers.