Pipeline Health: 7 Metrics That Separate Real Revenue From Fiction
A RevOps lead we know pulled her Q2 pipeline report and saw $4.2M in total value. The board deck looked great. Then the quarter closed at $900K. Deals had been sitting in "Proposal Sent" for 11 weeks, win rates had cratered to 9%, and 34% of the emails feeding those opportunities bounced. That gap between pipeline value and actual revenue is where most forecasts go to die.
Let's break down the metrics that tell you whether your pipeline is real - or fiction waiting to be exposed.
What Pipeline Health Actually Means
Pipeline value is the number your CRM spits out when you sum every open opportunity. It's a vanity metric. Pipeline health is different - it's the probability-weighted ability of your current pipeline to hit quota within the forecast period.
A healthy sales pipeline has deals progressing at predictable rates, built on accurate contact data, with enough coverage to absorb the deals that inevitably slip or die. A bloated pipeline has a big number at the top and a graveyard of stalled deals underneath. Pipeline predictability is what separates teams that hit quota from teams that explain why they didn't.
The 3 Numbers That Matter Most
If you only track three things, make it these:
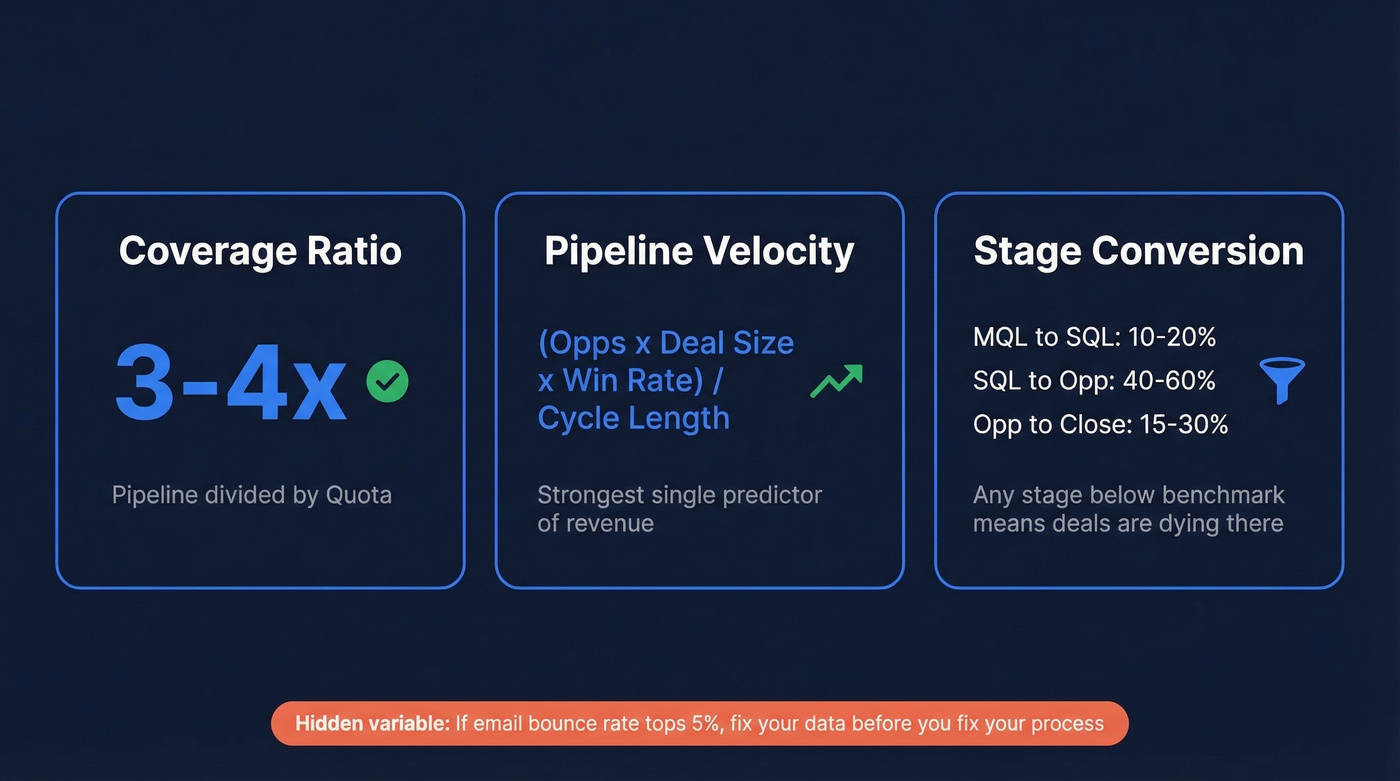
Coverage ratio - 3-4x your quota in qualified pipeline. Below 3x and you're mathematically unlikely to close enough.
Pipeline velocity - (Opportunities x Avg Deal Size x Win Rate) / Sales Cycle Length. This is the strongest single predictor of revenue throughput.
Stage conversion rates - MQL to SQL at roughly 10-20%, SQL to Opportunity at 40-60%, Opportunity to Close at 15-30%. Any stage dramatically below benchmark means deals are dying there.
The hidden variable nobody checks? Data quality. If your email bounce rate tops 5%, fix your data before you fix your process.
7 Metrics That Reveal the Truth
Coverage Ratio
Total pipeline value divided by quota. If your team needs $500K this quarter and you've got $1.8M in pipeline, your coverage ratio is 3.6x - healthy. Below 3x and you're relying on nearly every deal closing, which never happens. The 3-4x benchmark is well-established, but it only works if the pipeline underneath is real.
Here's the thing: a 5x ratio sounds great until you realize half those deals are zombies that haven't moved in six weeks.
Pipeline Velocity
How fast revenue moves through your funnel. The formula: (Number of Opportunities x Average Deal Size x Win Rate) / Average Sales Cycle Length. With 40 opportunities, $25K average deal size, 20% win rate, and a 60-day cycle, that's $3,333/day.
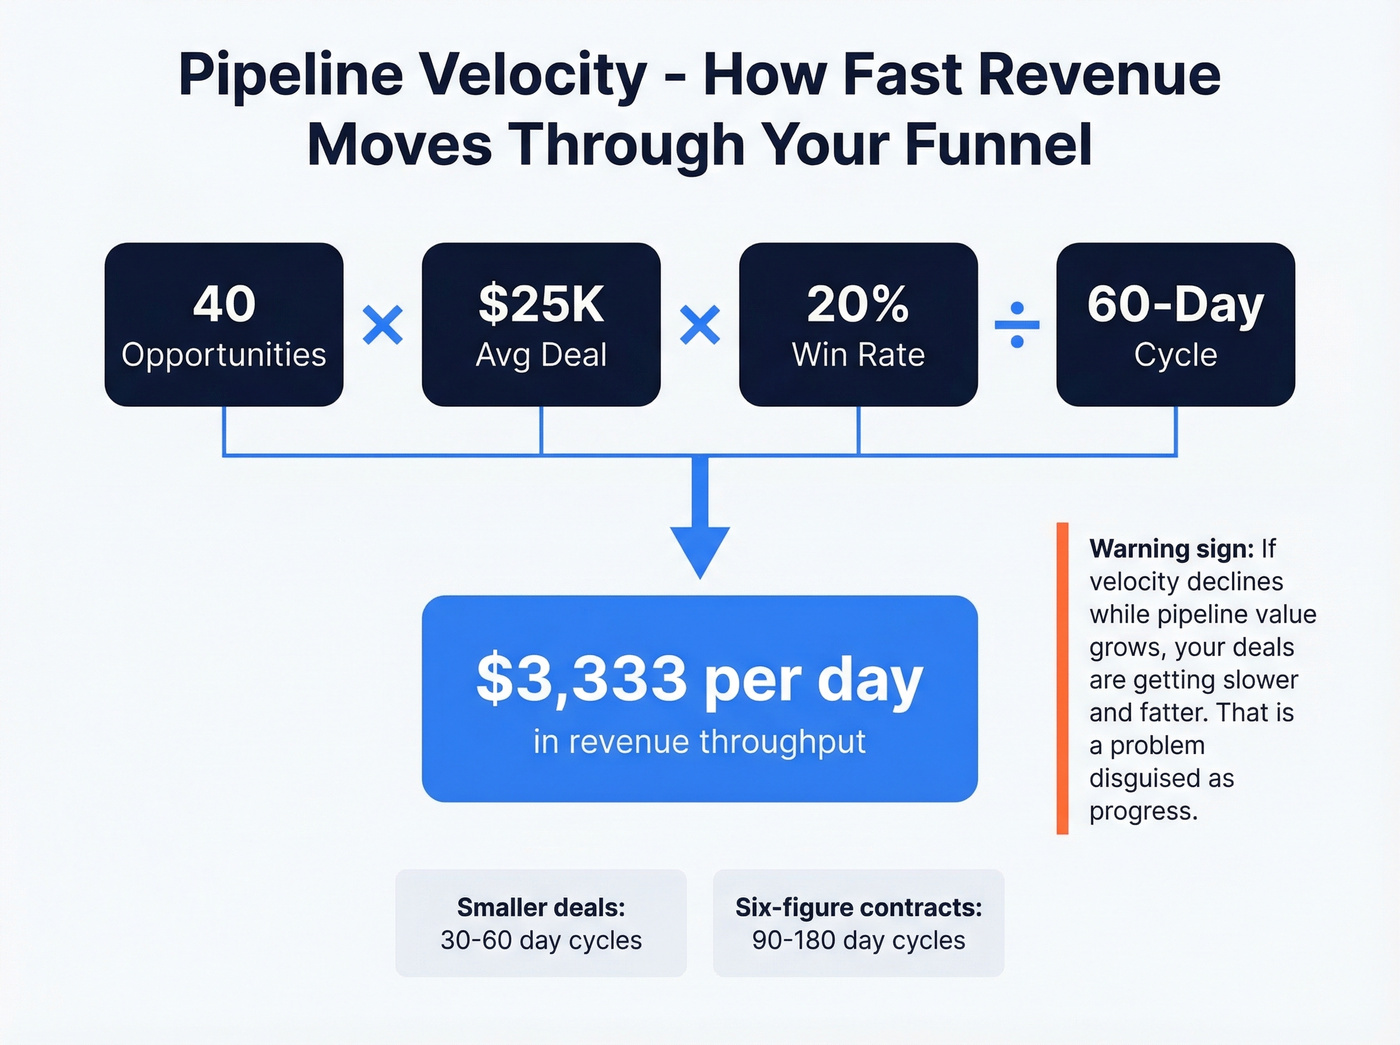
Sales cycles often run 30-60 days for smaller deals and 90-180 days for six-figure contracts - use your actual average, not an industry guess. If velocity declines while pipeline value grows, your deals are getting slower and fatter. That's a problem disguised as progress.
Win Rate
B2B win rates typically land between 15-25%. Below 15% signals a qualification problem. Above 30% might mean your team is sandbagging or only pursuing easy wins. The number itself matters less than the trend - a win rate dropping two quarters in a row demands investigation, not another pipeline review.
Stage Conversion Rates
Where exactly are deals dying?
Benchmarks run roughly: MQL to SQL at 10-20%, SQL to Opportunity at 40-60%, Opportunity to Close at 15-30%. If your proposal-to-close conversion drops quarter over quarter, that's a structural problem in how you're negotiating late-stage deals - not something a pep talk fixes.
Average Deal Size
Track the trend, not just the number. Trending down usually means reps are discounting to close. Trending up could mean you're moving upmarket intentionally, or it could mean small deals are dying and only large ones survive, masking a deeper funnel problem.
Pipeline Aging
Deals sitting in the same stage for roughly 2x the typical duration are usually dead. Most teams don't purge them, so they inflate pipeline value and coverage ratios. Red flag: more than 30% of your pipeline past the median age for its current stage. These zombie deals are one of the biggest reasons coverage ratios lie.
Data Quality Score
The metric most pipeline reviews skip entirely. Your email bounce rate is the simplest proxy - above 5% and your numbers are inflated because you're counting opportunities built on contacts who'll never receive your emails. In our experience, this is the single most underrated driver of forecast misses.
| Metric | Formula / Measure | Healthy Benchmark | Red Flag |
|---|---|---|---|
| Coverage Ratio | Pipeline / Quota | 3-4x | Below 3x |
| Velocity | (Opps x Deal x Win%) / Cycle | Trending up QoQ | Declining 2+ Qs |
| Win Rate | Won / Total opps | 15-25% | Below 15% |
| Stage Conversion | % between stages | MQL to SQL ~10-20% | Below 50% of norm |
| Avg Deal Size | Revenue / Deals closed | Stable or up | Down 10%+ QoQ |
| Pipeline Aging | % past median duration | <20% aged out | >30% aged out |
| Data Quality | Email bounce rate | <3% | >5% |
Your pipeline health metrics are only as real as the data underneath them. If bounce rates top 5%, your coverage ratio is a lie. Prospeo delivers 98% email accuracy with a 7-day refresh cycle - so every opportunity in your CRM is built on contacts who actually receive your emails.
Stop forecasting on fiction. Start with data that connects.
5 Signs Your Pipeline Is Sick
Bloated mid-funnel. Deals pile up in "Proposal" or "Negotiation" but don't close. Reps are advancing deals based on activity - they sent the proposal - rather than buyer commitment where terms and timeline are actually agreed.
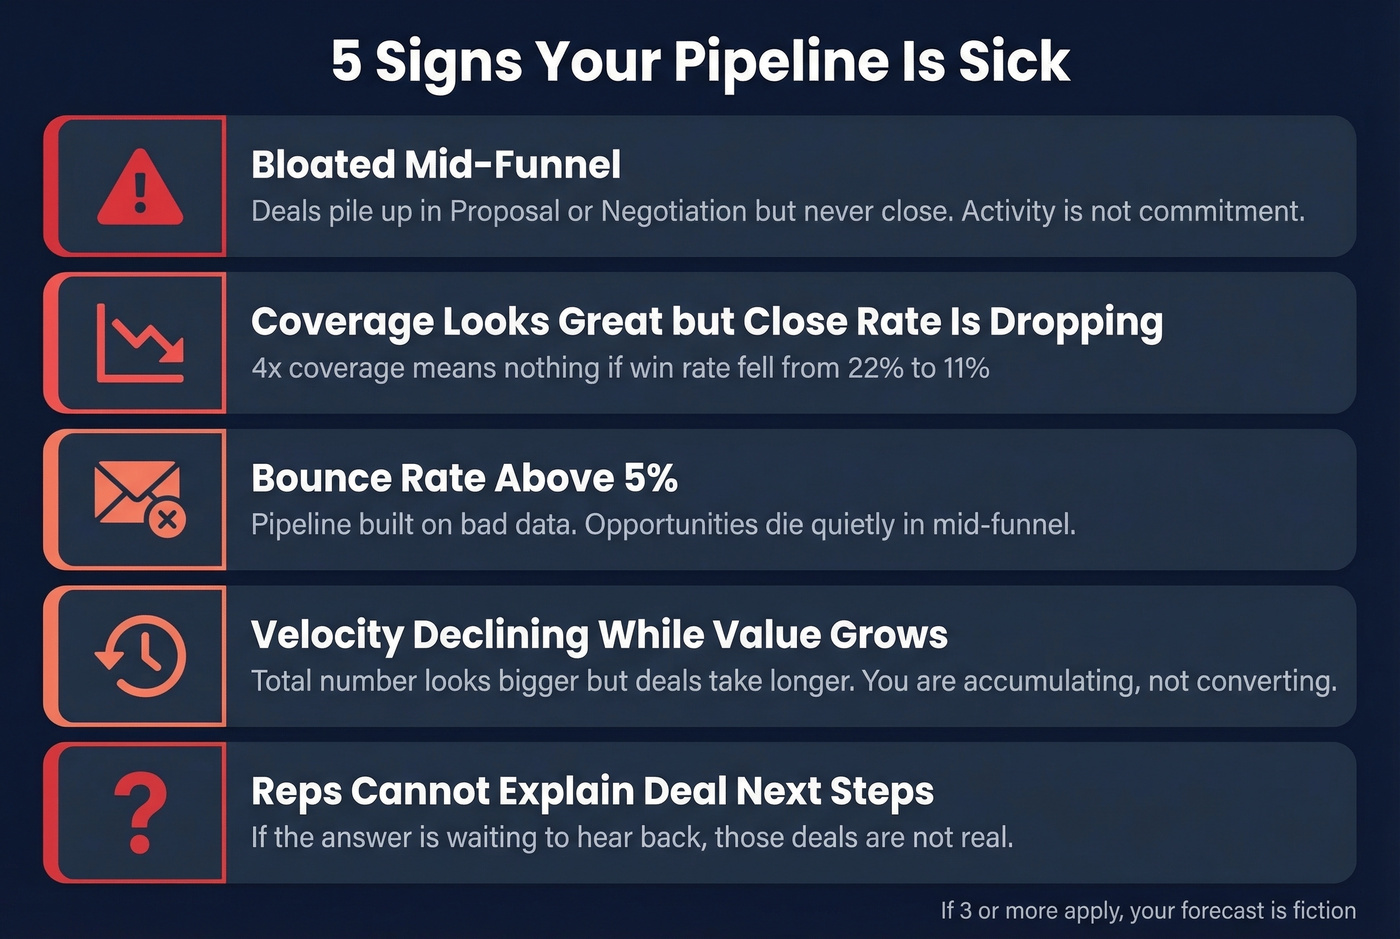
Coverage looks great but close rate is dropping. A 4x coverage ratio means nothing if win rate has fallen from 22% to 11%. You've got volume without quality, and your forecast is fiction.
Bounce rate above 5%. Your pipeline is built on bad data. SDRs booked meetings off lists where a third of contacts bounced. Those "opportunities" die quietly in mid-funnel and nobody notices until the quarter ends short.
Velocity declining while value grows. The sneakiest red flag. The total number looks bigger every quarter, but deals take longer to close. You're accumulating pipeline, not converting it.
Reps can't explain deal next steps. Ask a rep what happens next on their top 5 deals. If the answer is "waiting to hear back" or "they seemed interested," those deals aren't real.
The Data Quality Problem Nobody Talks About
Bad contact data enters the pipeline silently. An SDR pulls a list, runs sequences, books meetings. But if 30-40% of those emails bounce, the "opportunities" created from that outreach are built on sand. They inflate pipeline value, distort coverage ratios, and die when nobody can reach the decision-maker.
On r/sales, a common complaint about pipeline reviews is that managers obsess over total value instead of deal progression - but the problem often starts even earlier, with contacts who aren't reachable in the first place.
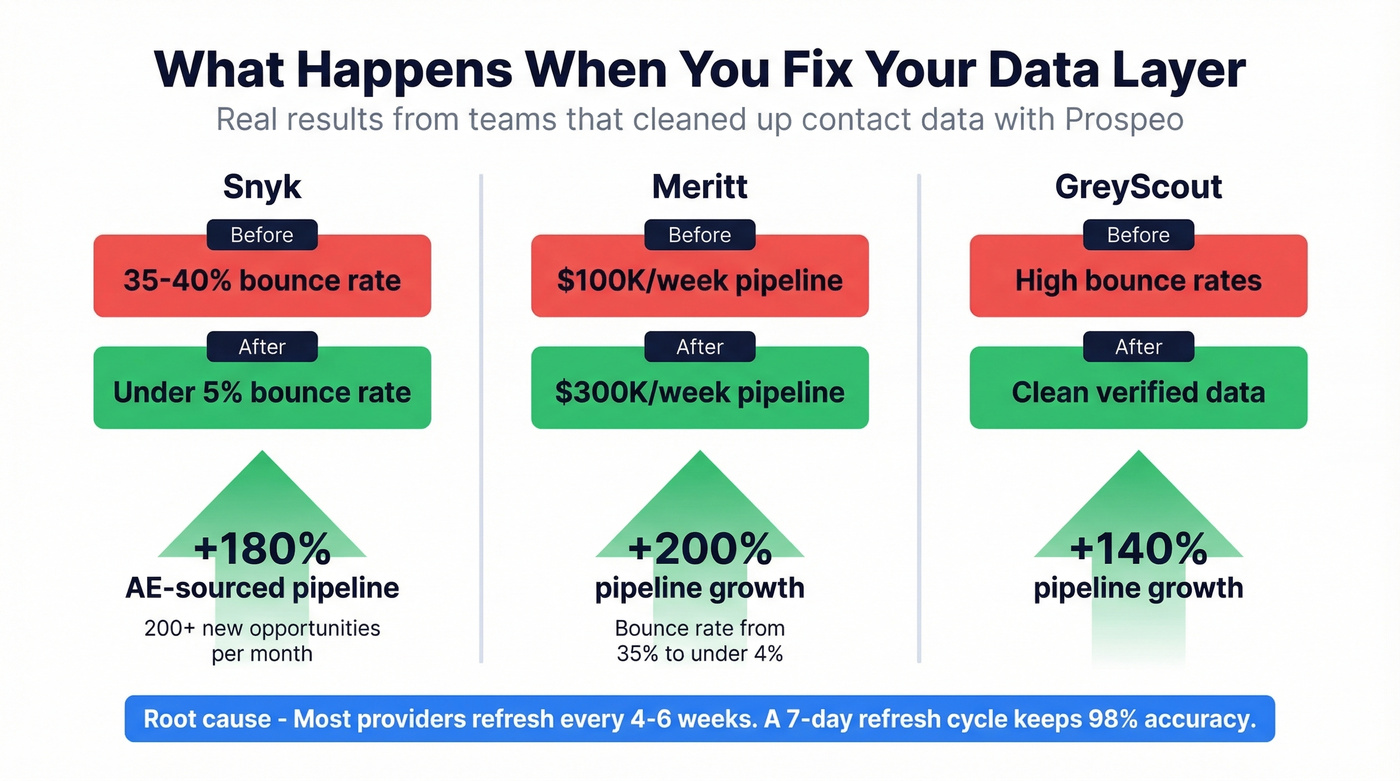
We've seen this play out with real teams. Snyk had 50 AEs prospecting 4-6 hours per week with bounce rates running 35-40%. After cleaning up their data layer with Prospeo, bounces dropped below 5%, AE-sourced pipeline jumped 180%, and they generated 200+ new opportunities per month. Meritt's pipeline tripled from $100K to $300K per week once bounce rates went from 35% to under 4%. GreyScout saw pipeline climb 140% after the same cleanup.
The root cause is refresh frequency. Most data providers update records every 4-6 weeks. By then, 20-30% of your pipeline contacts have changed roles, left companies, or gone dark. A 7-day refresh cycle maintaining 98% email accuracy is the difference between a pipeline built on current, reachable contacts and one built on ghosts. When your data quality score is reliable, every other metric becomes trustworthy.
Snyk's 50 AEs cut bounce rates from 35% to under 5% and grew AE-sourced pipeline 180% - because they fixed the data layer first. Prospeo's 5-step verification and 143M+ verified emails mean your pipeline value reflects real, reachable buyers, not zombie contacts.
Every metric in this article improves when your contact data is accurate.
Running a Weekly Pipeline Review
Weekly reviews work best. Here's the framework we recommend:
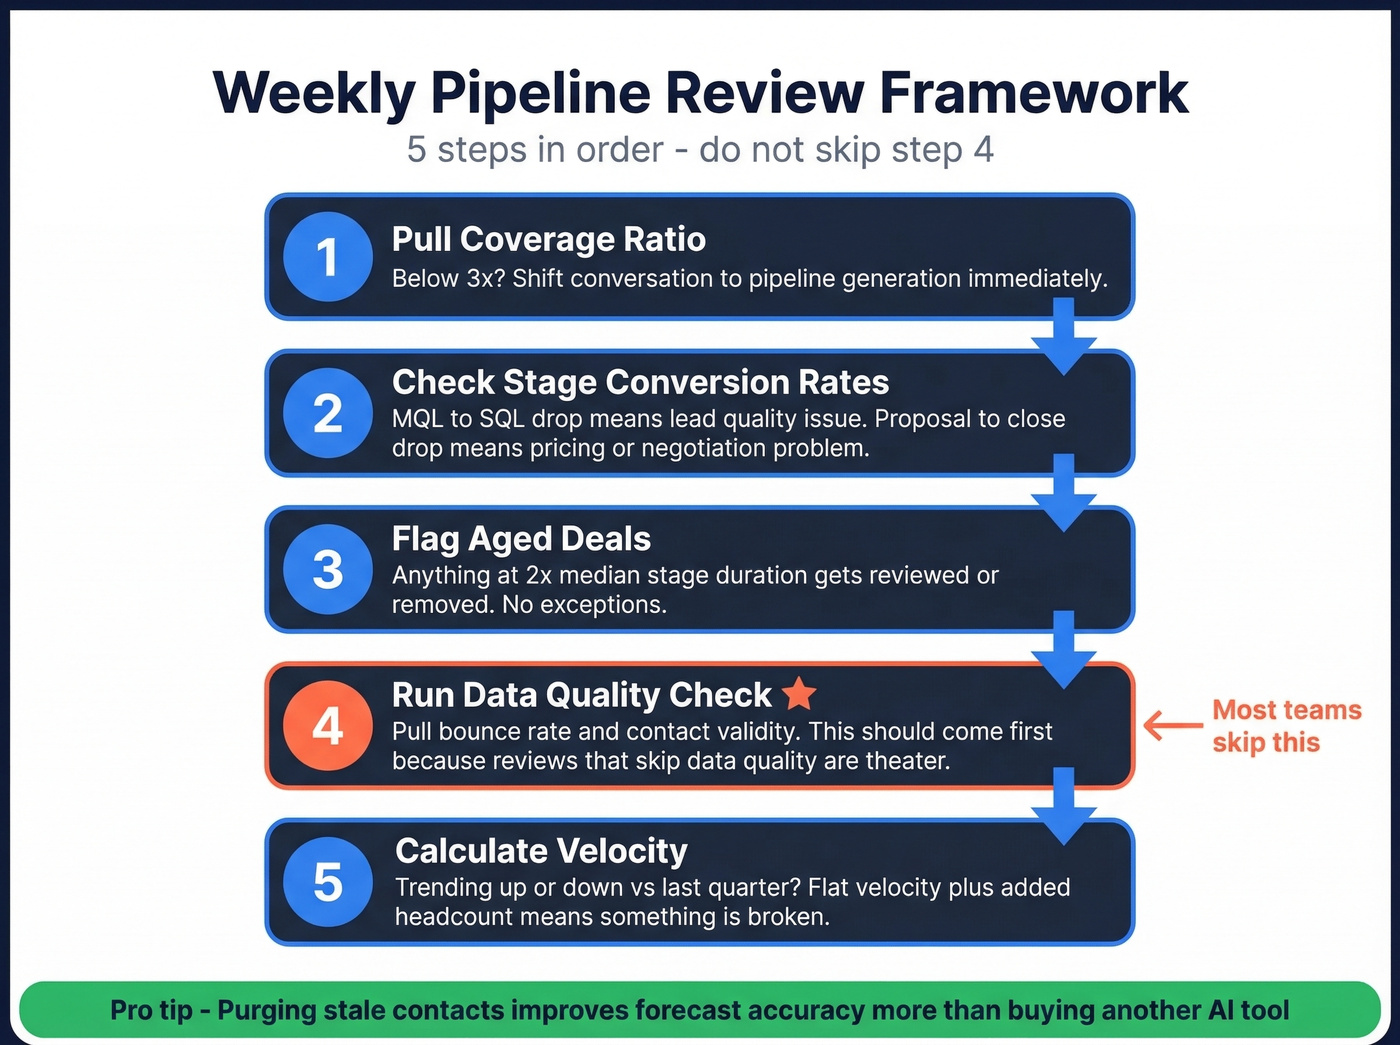
Pull your coverage ratio. Below 3x? The conversation shifts immediately to pipeline generation, not deal progression.
Check stage conversion rates. If MQL to SQL conversion dropped 30% this month, that's a lead quality issue. If proposal-to-close dropped, it's pricing or negotiation.
Flag aged deals. Anything sitting in the same stage for 2x the median duration gets reviewed or removed. No exceptions. This is where most teams lose discipline - nobody wants to kill a deal that "might come back."
Run a data quality check. Pull your bounce rate. Check contact validity across your pipeline. This step should come before everything else, because reviews that skip data quality are theater.
Calculate velocity. Trending up or down versus last quarter? If velocity is flat while you're adding headcount, something is broken.
I'll be blunt: most teams would improve their forecast accuracy more by purging stale contacts than by buying another AI forecasting tool. Fix the inputs before you optimize the model.
Tools for Monitoring Pipeline Health
CRM Reporting - Salesforce (roughly $25-$330/user/month depending on edition) and HubSpot (free CRM; Sales Hub from about $20/user/month) both have built-in pipeline dashboards and stage reports. These handle coverage ratios, stage conversion tracking, and basic aging reports out of the box. For most teams under 20 reps, native CRM reporting is enough. If you're evaluating options, start with a few examples of a CRM to sanity-check fit and pricing.
Forecasting - Clari (enterprise pricing, typically $30-100K+/year) and Gong (roughly $100-200/user/month on annual contracts) layer AI-powered analytics and deal risk scoring on top of your CRM. Worth it if you're running 20+ reps and need predictive accuracy beyond native CRM reports. Teams using dedicated forecasting tools often improve forecast accuracy by 15-25%. If you're comparing platforms, see our breakdown of sales forecasting solutions and the best sales forecasting tools.
Skip these if you're a team of five - the ROI doesn't justify the spend until you've got enough pipeline volume to make the pattern recognition meaningful.
Data Quality - Prospeo (free tier, paid from ~$0.01/email, no contracts) delivers 98% email accuracy on a 7-day refresh cycle. ZoomInfo ($15-40K/year, 87% email accuracy) and Apollo (free tier, paid from $49/mo, 79% accuracy) are alternatives, but you're paying more for less accuracy. If you want to fix bounces systematically, start with email bounce rate benchmarks and remediation, then evaluate data enrichment services for ongoing hygiene.
FAQ
What's a good pipeline coverage ratio?
3-4x your quota in qualified pipeline. Below 3x and you're mathematically likely to miss; above 5x often indicates too many low-quality deals inflating the number. The key word is "qualified" - unqualified pipeline at 6x is worse than clean pipeline at 3.5x.
How often should you review pipeline health?
Weekly for stage conversion and aging - catching stalls early saves deals. Monthly for velocity and coverage trends. Quarterly for benchmarking against industry averages and recalibrating your red-flag thresholds.
What's the difference between pipeline value and pipeline health?
Pipeline value is the total dollar amount in your CRM. Pipeline health measures whether that value is real - qualified, progressing, and built on accurate data. A $5M pipeline with 40% bounce rates and stalled deals is worth less than a $2M pipeline with clean data and strong velocity.
How does data quality affect forecast accuracy?
If 30% of your contact data is outdated, roughly 30% of your pipeline is fiction - you're counting opportunities built on contacts who've changed roles or left companies. Fix data quality first; every other metric improves downstream.