The B2B Sales Funnel Template That Actually Has Numbers in It
Most "funnel template" articles make you fill out a form to download a blank spreadsheet. That's not a template - that's a lead magnet. This one comes with actual conversion benchmarks, the velocity formula, and the exact columns your spreadsheet needs so you can stop guessing where deals die.
56% of sales teams rate their own pipeline management as poor or neutral. The frustration is real: early-stage teams find full CRMs clunky, but a blank spreadsheet isn't enough either. What you need is a structured template with real numbers baked in.
What You Need (Quick Version)
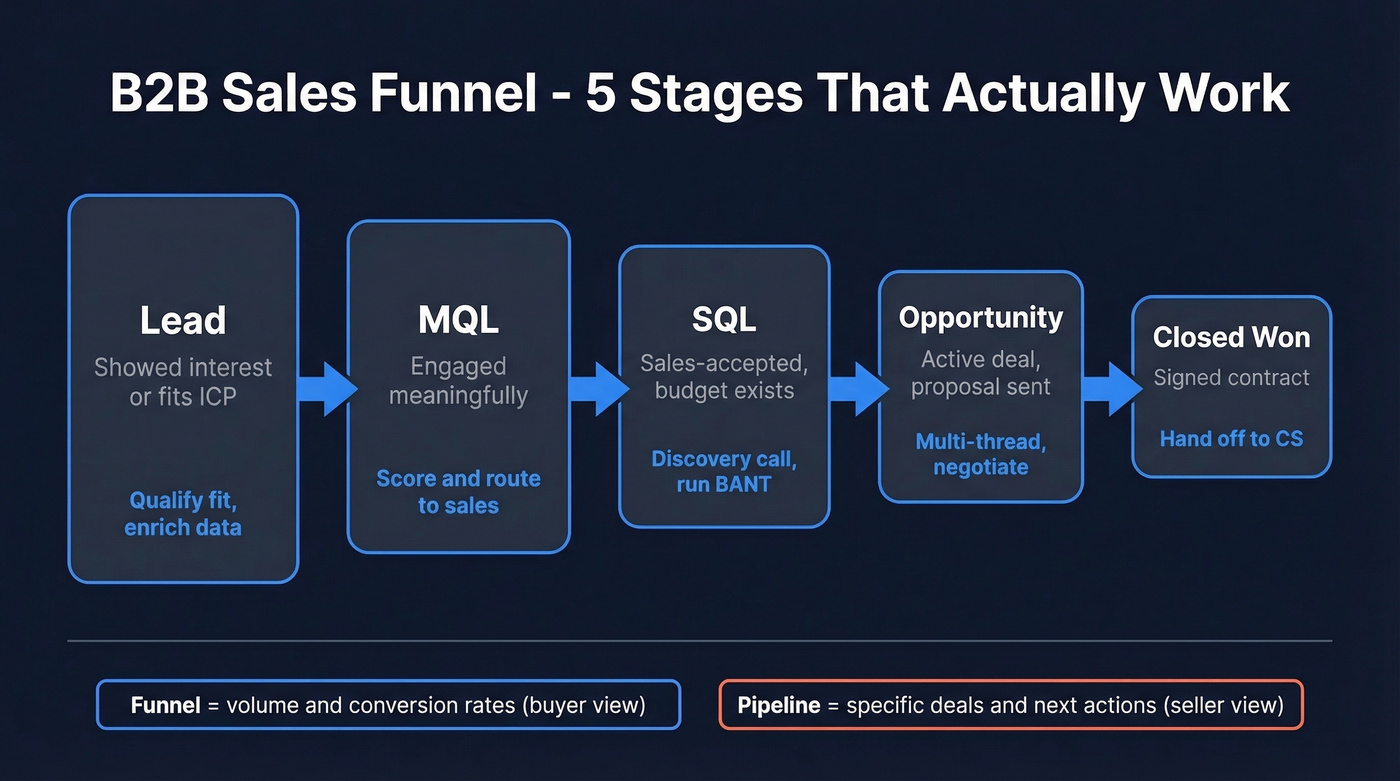
- 5 stages: Lead → MQL → SQL → Opportunity → Closed Won
- 9 columns minimum: deal name, stage, deal size, probability %, weighted forecast, expected close date, days in stage, next action, lead source
- Benchmark your conversion rates against the table below
- Calculate pipeline velocity weekly
- Start in Google Sheets - graduate to a CRM once deal volume makes a spreadsheet painful to maintain
The 5 Funnel Stages
Forget AIDA.) It mashes lead gen and sales into one model and doesn't give you enough stages to diagnose where deals stall. Here's what works:
| Stage | Definition | Seller Action |
|---|---|---|
| Lead | Showed interest or fits ICP | Qualify fit, enrich data |
| MQL | Engaged meaningfully | Score, route to sales |
| SQL | Sales-accepted, budget exists | Discovery call, BANT |
| Opportunity | Active deal, proposal sent | Multi-thread, negotiate |
| Closed Won | Signed contract | Hand off to CS |
A quick distinction worth internalizing: a funnel measures volume and conversion rates per stage - the buyer's view. A pipeline tracks specific deals and next actions - the seller's execution tool. You need the funnel for diagnostics and the pipeline for moving individual deals forward.
B2B funnels are uniquely painful because the average deal involves 8-13 stakeholders. Your template needs to account for multi-threading, not just single-contact progression. If you're only tracking one champion per account, you're flying blind on the other seven people who can kill your deal.
Conversion Benchmarks by Stage
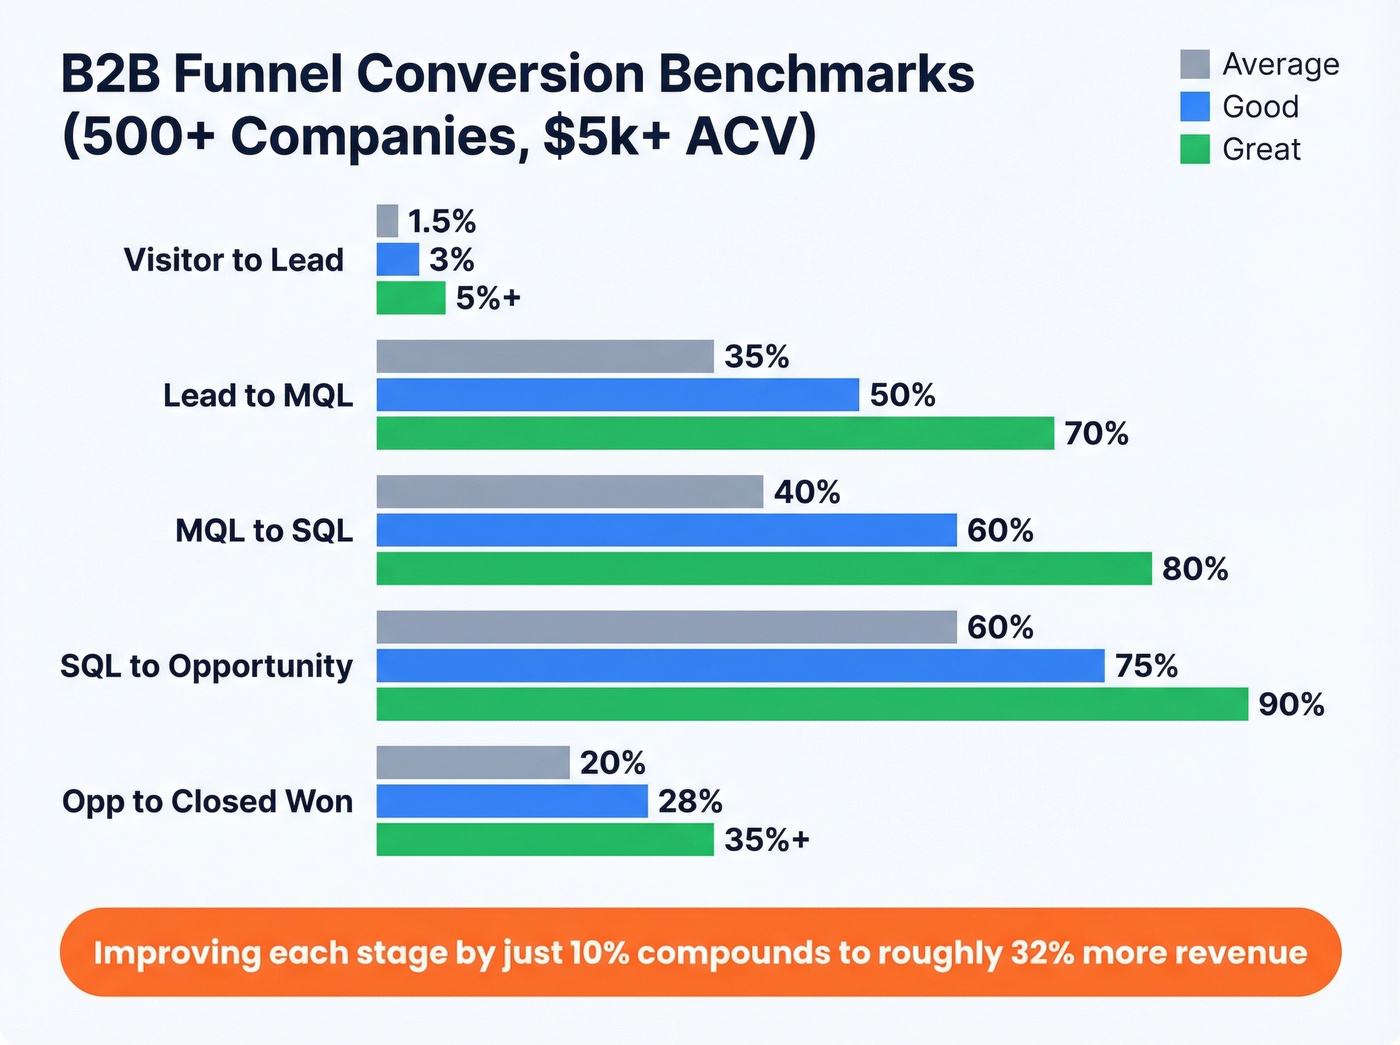
These come from Convertify's "Golden Funnel" analysis of 500+ B2B companies selling above $5k ACV:
| Stage Transition | Average | Good | Great |
|---|---|---|---|
| Visitor → Lead | 1.5% | 3% | 5%+ |
| Lead → MQL | 35% | 50% | 70% |
| MQL → SQL | 40% | 60% | 80% |
| SQL → Opportunity | 60% | 75% | 90% |
| Opp → Closed Won | 20% | 28% | 35%+ |
The segment split matters. Digital Bloom's pipeline audit shows SMB/mid-market teams converting visitors to leads at 1.4%, while enterprise drops to 0.7%. Enterprise also sees lower close rates - roughly 31% vs 39% for SMB - because procurement cycles are longer and buying committees are bigger.
Here's the math that should motivate you: improving each stage by just 10% compounds to roughly a 32% revenue increase. You don't need to overhaul your funnel. You need to find the one leaky stage and fix it.
Improving each funnel stage by 10% compounds to 32% more revenue - but only if your top-of-funnel data is real. Prospeo's 98% email accuracy and 5-step verification means every lead entering your template is a real person at a real company. No inflated MQL counts. No phantom pipeline.
Fix the top of your funnel before optimizing anything else.
What Columns to Include
Your template needs nine columns at minimum. Add each to your sheet and move on.
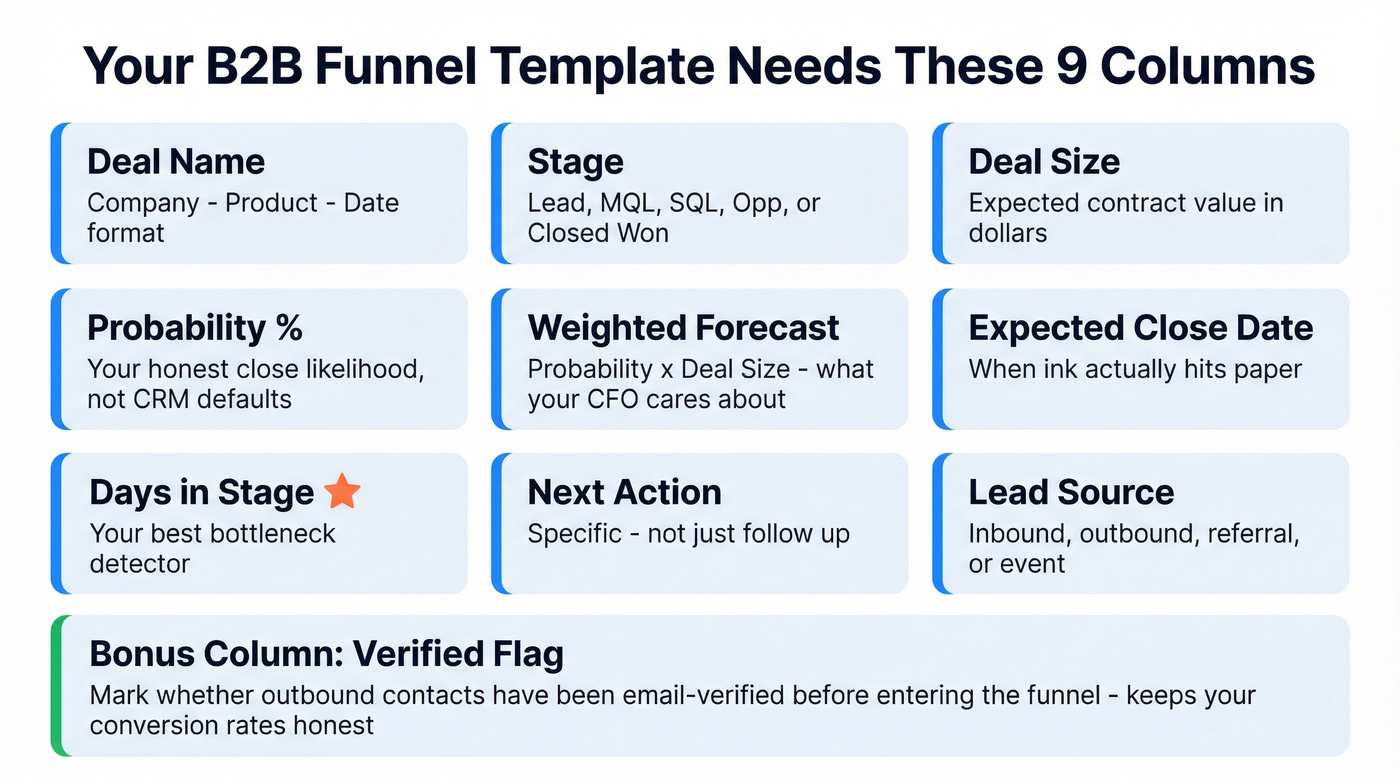
Deal name - use a consistent naming convention like "Company - Product - Date." Stage - one of the five above. Deal size - expected contract value. Probability % - your honest close likelihood, not the CRM default. Weighted forecast - probability times deal size; this is the number your CFO actually cares about.
Expected close date - when ink hits paper. Days in stage - the single best bottleneck detector you'll ever have. Next action - "follow up" isn't an action; "send pricing proposal to VP Ops by Thursday" is. Lead source - inbound, outbound, referral, event.
One column most templates miss: a Verified flag for outbound leads. If you're running outbound, verify every contact before it enters the funnel. We use Prospeo for this - 98% email accuracy means your top-of-funnel numbers reflect reality instead of being inflated by contacts that'll bounce.
If you're also enriching accounts and contacts, pair verification with data enrichment so reps aren't guessing titles, headcount, or tech stack.

Pipeline Velocity Formula
Sales Velocity = (Opportunities x Deal Value x Win Rate) / Sales Cycle Length
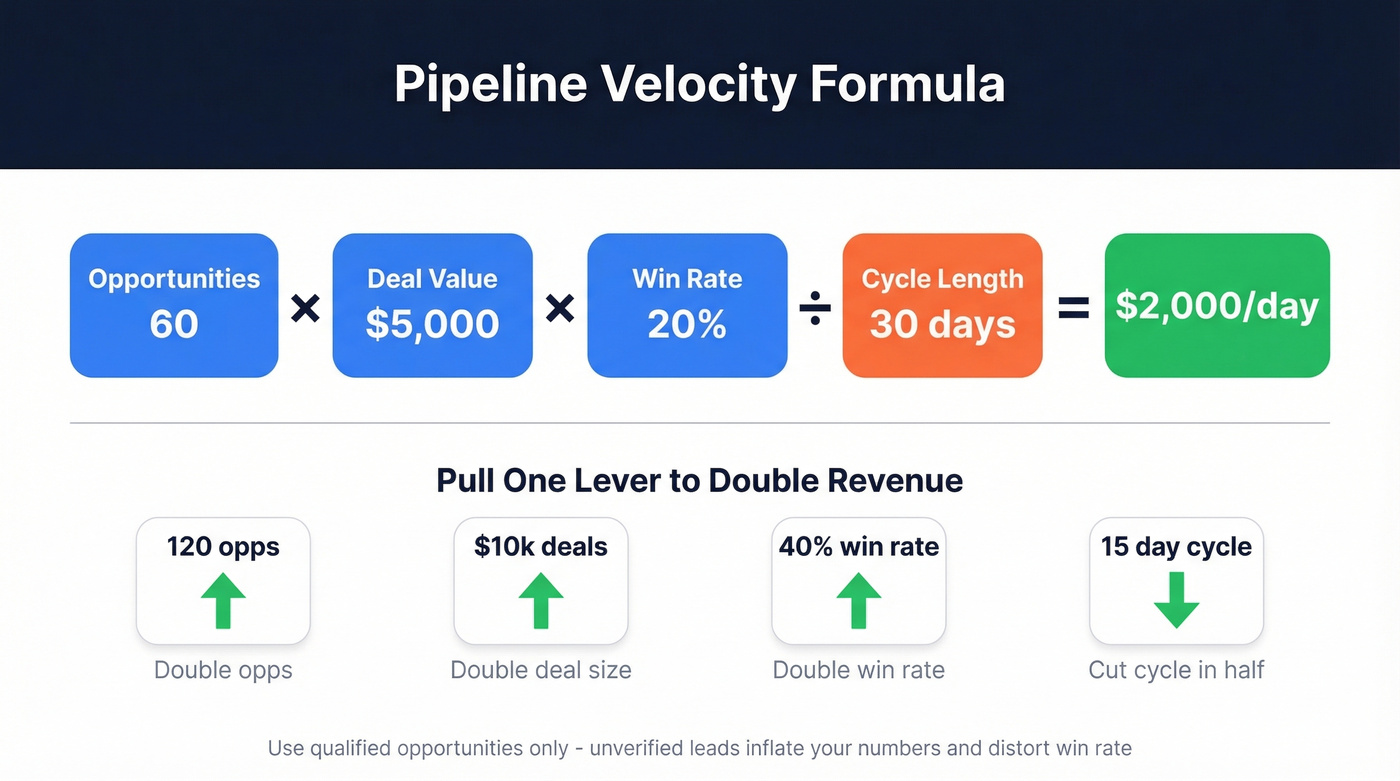
Worked example: 60 qualified opportunities x $5,000 average deal x 20% win rate / 30-day cycle = $2,000/day in pipeline velocity. That's $60k/month. Want $120k? You either double opportunities, double deal size, double win rate, or cut cycle length in half. The formula tells you which lever to pull.
Use qualified opportunities only. In our experience, most teams overcount because they include unvetted leads, which inflates the number and distorts your win rate. We've seen teams report 25% win rates that dropped to 14% once they cleaned up the denominator.
If you want a deeper KPI set beyond velocity, track pipeline health and sales pipeline benchmarks alongside stage conversions.
Here's what "normal" looks like for sales cycle length:
| ACV Range | Typical Cycle |
|---|---|
| Under $2k | 14 days |
| Under $5k | 30 days |
| Under $25k | 90 days |
| Under $100k | 90-180 days |
| Over $100k | 3-9 months |
Two more benchmarks worth tracking: pipeline coverage ratio should be 3-4x your quota, and deal slippage rate should stay under 20%.
Template Variants by Business Model
SaaS - Your funnel doesn't end at the close. Add trial/demo → onboarding → activation → retention. Track time-to-value as aggressively as close rates, because churn kills the math. A 35% close rate means nothing if 40% of new customers cancel within 90 days. (If you need the retention math, start with churn analysis.)
Agency/Services - If your proposal-to-close rate is under 40%, the problem isn't your proposals. It's your qualification. Tighten discovery before you invest in custom decks. Use a tighter discovery questions framework to stop bad-fit deals from entering the funnel.
Enterprise - Skip this variant if your average deal is under $25k. ABM-driven funnels with 3-9 month cycles need CRM dashboards, not spreadsheets. Expect account targeting → BANT → executive briefings → procurement. If you're truly in this motion, align your process with enterprise B2B sales best practices.
Let's be honest about something: if your average deal size is modest and you're managing fewer than 50 deals, a well-structured Google Sheet will outperform a CRM you half-configure. The consensus on r/SaaS backs this up - Notion, Coda, or Airtable as a middle ground works better than a bloated CRM nobody updates.
Common Funnel Mistakes
Too many stages. Keep it to five. We've seen teams with 8+ custom stages where reps just stop updating the CRM entirely. Complexity kills adoption. Build the habit first, then add granularity.
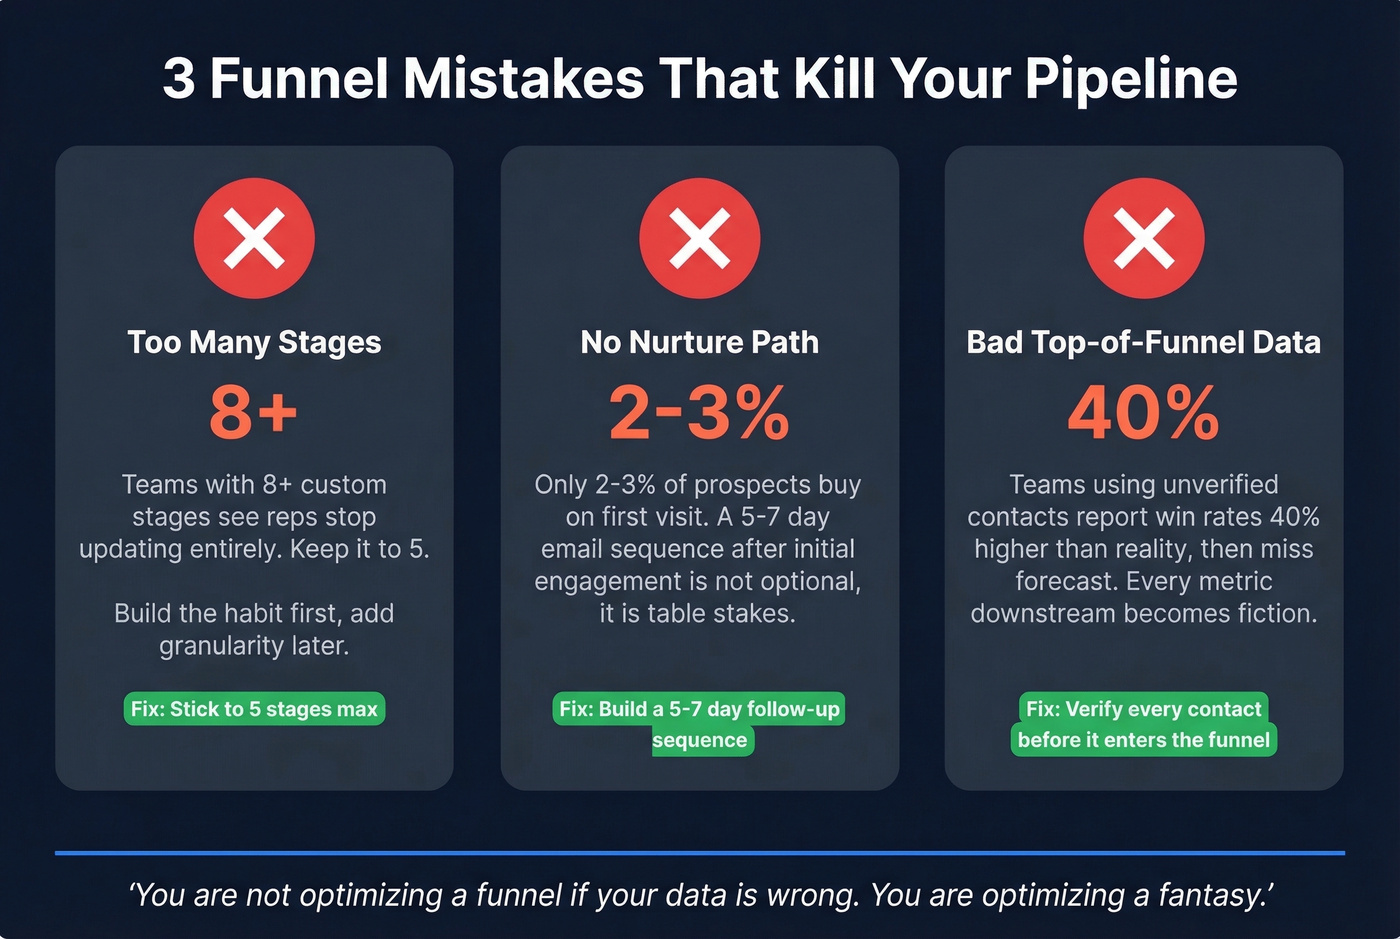
No nurture path. Only 2-3% of prospects buy on first visit. A 5-7 day email sequence after initial engagement isn't optional - it's table stakes. If you need copy you can paste, use these sales follow-up templates.
Bad top-of-funnel data. This one drives me nuts. If your bounce rate is high, every conversion rate downstream is fiction. You're optimizing a funnel built on lies. Teams running Prospeo's 5-step verification - catch-all handling, spam-trap removal, honeypot filtering - routinely drop bounce rates below 4%. That alone makes every metric in your funnel trustworthy.
Your pipeline velocity formula is only as honest as your denominator. Teams using unverified contacts report win rates 40% higher than reality - then miss forecast. Prospeo verifies emails at $0.01 each with catch-all handling and spam-trap removal, so your conversion benchmarks reflect actual pipeline, not noise.
Stop optimizing a funnel built on bad data.
FAQ
What's the difference between a funnel and a pipeline?
A funnel measures volume and conversion rates at each stage - it's the buyer's journey in aggregate. A pipeline tracks specific deals and next actions - it's the seller's execution tool. Use the funnel to diagnose leaky stages and the pipeline to move individual deals forward.
When should I switch from a spreadsheet to a CRM?
Move to a CRM when you're managing 50+ active deals or have multiple reps collaborating on the same accounts. HubSpot's free tier is a common starting point. Below that threshold, a structured Google Sheet with the nine columns above will outperform a half-configured CRM every time.
How often should I update my funnel?
Update deal stages and next actions every Friday. Review stage-to-stage conversion rates monthly. A funnel you don't maintain is just a spreadsheet with aspirational numbers - the benchmarks above only help if your data is current.