Sales Pipeline Benchmarks for 2026 (With Real Numbers)
A rep on r/sales built $3M in pipeline from zero at a Fortune 500 account - and got called "abysmal" in their performance review. That's what happens when your org doesn't agree on what good looks like. These are the actual sales pipeline benchmarks, segmented by deal size, industry, channel, and segment, so you can stop arguing about pipeline and start diagnosing it.
Quick Benchmarks to Bookmark
Save it, screenshot it, paste it in Slack when your VP asks "what's normal."
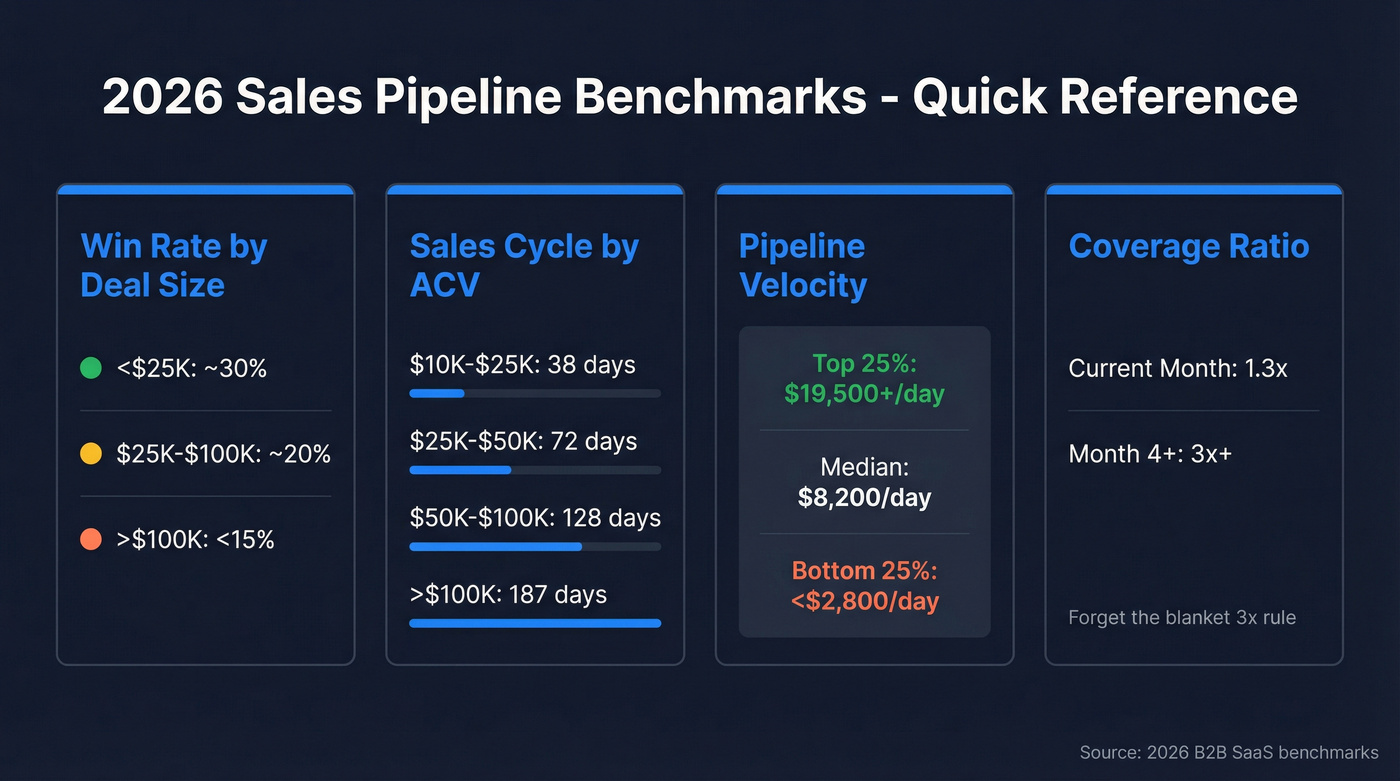
Win rate by deal size:
| Deal Size | Typical Win Rate |
|---|---|
| <$25K | ~30% |
| $25K-$100K | ~20% |
| >$100K | <15% |
Sales cycle by ACV (2026 tech benchmarks):
| ACV Band | Median Days |
|---|---|
| $10K-$25K | 38 |
| $25K-$50K | 72 |
| $50K-$100K | 128 |
| >$100K | 187 |
Pipeline velocity (overall distribution): Median $8,200/day. Top quartile hits $19,500+/day. Bottom quartile sits below $2,800/day.
Coverage: Forget the blanket "3x" rule. Current-month coverage should be ~1.3x if your pipe is late-stage. Month 4+ coverage needs 3x+.
These numbers mean nothing without context. Let's add some.
Why Benchmarks Feel Broken
Only 16% of reps hit quota in recent years. The average B2B sales cycle has ballooned to 6.5 months - up from 4.9 months in 2019 - and buying committees now average 13+ decision-makers (25 if you count every influencer and stakeholder). The job got harder, but most benchmark targets haven't adjusted.
Most teams confuse metrics with benchmarks. A metric is "we track win rate." A benchmark is "our win rate is 18% against a segment median of 21%, and here's why." One is a dashboard label. The other is a diagnostic tool.
The problem compounds when leadership uses benchmarks as weapons. That Reddit poster who built $3M in pipeline and got called abysmal? Their leadership benchmarked against a different segment, a different ACV band, or a different sales motion entirely. A $3M pipeline in mid-market SaaS is fundamentally different from $3M in enterprise infrastructure deals with 18-month cycles. Meanwhile, 80% of buyer interactions now happen digitally, which means your pipeline data is only as good as your digital touchpoint tracking. Benchmarks only work when they're segmented properly.
The Metrics That Matter
Not every pipeline metric deserves a benchmark. Some are vanity. Some are diagnostic.
| Metric | What It Tells You | Formula |
|---|---|---|
| Pipeline velocity | Revenue throughput | Opps x Size x WR / Days |
| Win rate | Qualification + close quality | Won / Total Opps |
| Coverage ratio | Forecast confidence | Pipeline / Quota |
| Weighted pipeline | Realistic forecast | Sum of (Value x Stage Prob) |
| Stage conversion | Where deals die | Stage N Exits / Entries |
| Cycle length | Deal drag + complexity | Avg Days Created to Closed |
Pipeline velocity is the single most useful compound metric because it captures all four levers simultaneously. If velocity drops, you isolate which input changed - fewer opps, smaller deals, lower win rates, or longer cycles. David Sacks emphasizes weighted pipeline as the forecasting backbone, and he's right, but velocity is what tells you the engine is healthy.
Funnel and Conversion Rates by Industry
This is where most benchmark guidance falls short - one set of numbers labeled "B2B." A cybersecurity company's funnel looks nothing like an eCommerce company's funnel.
Quick definitions: A Lead is any identified contact showing interest. An MQL meets your scoring threshold (right firmographics, right engagement). An SQL has been vetted by sales as worth pursuing. An Opportunity is an active deal in pipeline.
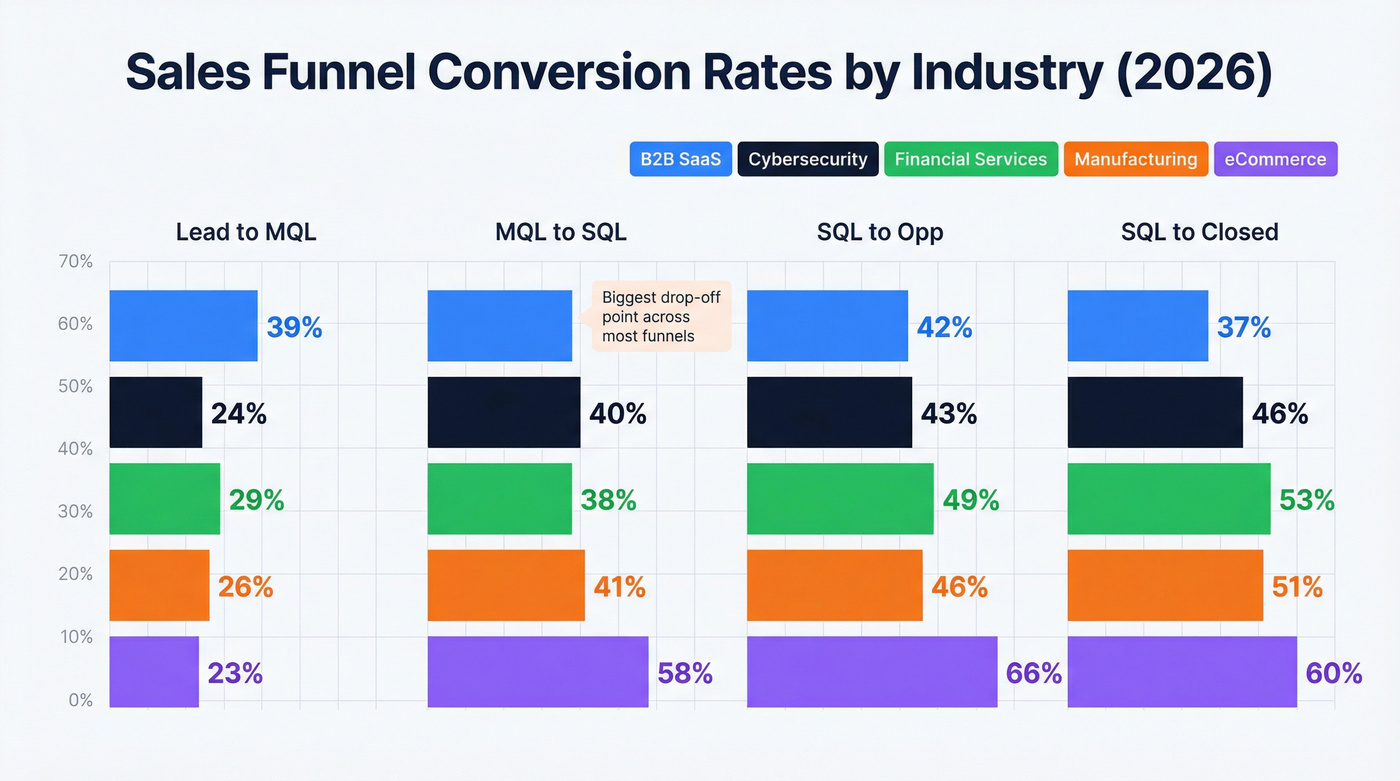
Stage-by-stage conversion rates by industry:
| Industry | Lead to MQL | MQL to SQL | SQL to Opp | SQL to Closed |
|---|---|---|---|---|
| B2B SaaS | 39% | 38% | 42% | 37% |
| Cybersecurity | 24% | 40% | 43% | 46% |
| Financial Services | 29% | 38% | 49% | 53% |
| Manufacturing | 26% | 41% | 46% | 51% |
| eCommerce | 23% | 58% | 66% | 60% |
eCommerce has the highest MQL-to-SQL and SQL-to-Opp rates by a wide margin - the buying process is simpler and deal sizes are smaller. Financial Services and Manufacturing close at much higher rates once deals reach SQL, which tracks for longer, relationship-driven cycles where qualification is stricter upfront. Cybersecurity's low Lead-to-MQL rate (24%) reflects the noise in that market: tons of inbound from tire-kickers and compliance researchers who'll never buy. But once leads qualify, the 46% close rate is strong.
SaaS funnels also convert differently by company size. Visitor-to-Lead drops to 0.7% for enterprise vs 1.4% for SMB/mid-market, and Opp-to-Close falls to 31% vs 39%. MarketJoy's aggregated client data benchmarks another common funnel shape: Lead-to-MQL 22%, MQL-to-SQL 15%, SQL-to-Opp 11%, Opp-to-Close 7% - with MQL-to-SQL as the steepest cliff.
The Universal Bottleneck: MQL to SQL
Across most funnels, MQL-to-SQL is the biggest drop-off point. Martal Group's benchmarks peg it at roughly 15% in aggregate, and the median B2B conversion rate overall is just 2.9%.
Why? This is where marketing's definition of "qualified" meets sales' definition of "worth my time." The gap between those two definitions is where pipeline goes to die. If your MQL-to-SQL rate is below 15%, the problem is usually lead scoring criteria and handoff definitions, not raw sales effort.
Win Rate Benchmarks
Use this if: You're setting realistic planning assumptions for new segments, reps, or markets.
Skip this if: You're comparing your blended win rate to a single benchmark number without segmenting by deal size. That comparison is meaningless.
The average B2B win rate sits at roughly 21%. But that average hides enormous variation. Small deals under $25K close at ~30%. Mid-market deals ($25K-$100K) drop to ~20%. Enterprise deals above $100K often land below 15%.
Here's the number that should change how you think about pipeline: known-contact deals close at 37%, versus 19% for cold outreach. That's a Champify finding, and it's massive. The single fastest way to improve win rates isn't better discovery calls or sharper demos - it's increasing the share of deals where you already have a verified contact path.
If your win rate is below 15% on deals under $50K, look at qualification first. Below 10%? You have a positioning or ICP problem, not a closing problem.
Sales Cycle by ACV
Sales cycle length is the most underrated pipeline diagnostic. It's also the one most teams measure wrong - they look at averages instead of medians, which lets a handful of 300-day enterprise deals skew the entire picture.
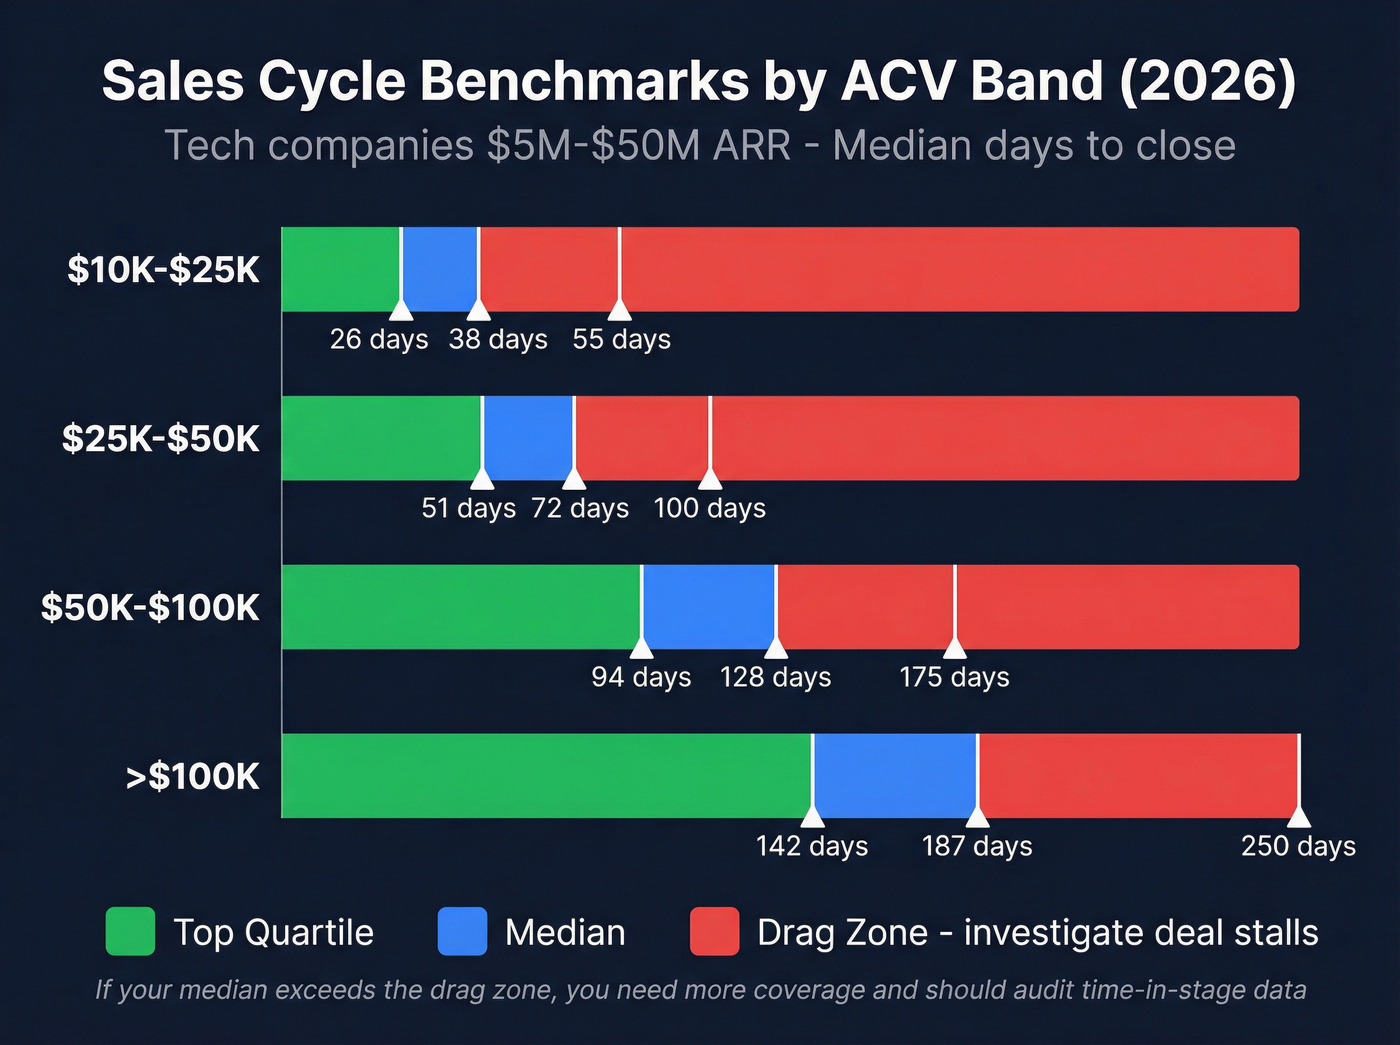
2026 benchmarks for $5M-$50M tech companies, with "drag" thresholds that signal a problem:
| ACV Band | Median | Top Quartile | Drag Zone (>X) |
|---|---|---|---|
| $10K-$25K | 38 days | 26 days | >55 days |
| $25K-$50K | 72 days | 51 days | >100 days |
| $50K-$100K | 128 days | 94 days | >175 days |
| >$100K | 187 days | 142 days | >250 days |
If your median cycle for $25K-$50K deals exceeds 100 days, you're in the drag zone. That doesn't automatically mean something's broken - complex procurement, multi-stakeholder approvals, and budget cycles all extend timelines legitimately. But it means you need more pipeline coverage and should adjust velocity calculations accordingly.
Teams that hit 26-day cycles on $10K-$25K deals typically have strong PLG motions, streamlined procurement, or champion-led buying processes. If you're at 50+ days for that ACV band, look at time-in-stage data to find where deals stall. One pattern we see repeatedly: reps spend days tracking down the right contact, emailing outdated addresses, and waiting for responses that never come because the prospect left the company six months ago. Shaving even a few days off that dead time compounds across hundreds of deals.
Known-contact deals close at 2x the rate of cold outreach. Prospeo gives you 98% accurate emails and 125M+ verified mobiles so every deal starts with a real connection - not a bounce.
Fix your win rate at the source: start with verified contacts.
Pipeline Velocity Benchmarks
Pipeline velocity ties everything together. The formula: (Number of Opportunities x Average Deal Size x Win Rate) / Sales Cycle Length in Days. The output is dollars per day flowing through your pipeline.
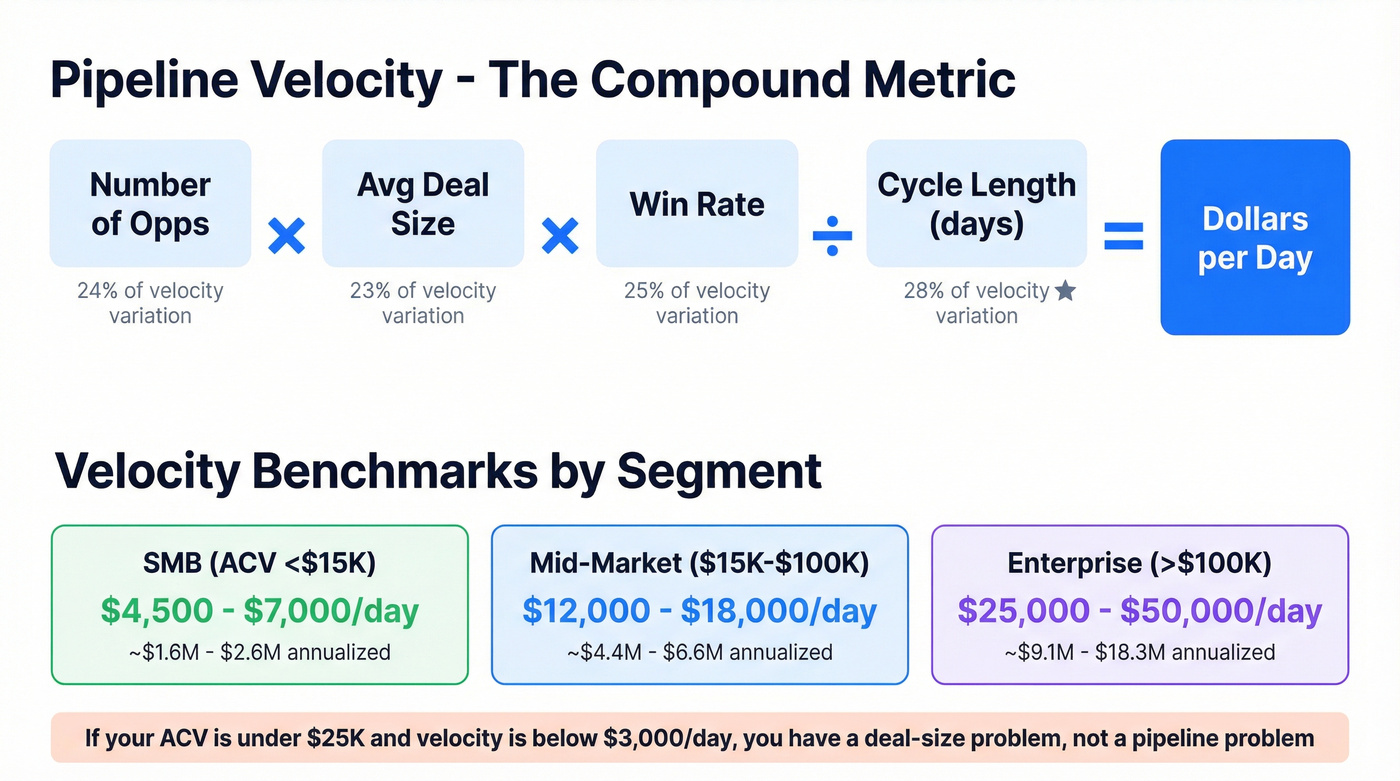
Benchmarks from a 939-company dataset:
| Segment | Velocity Range |
|---|---|
| SMB (ACV <$15K) | $4,500-$7,000/day |
| Mid-Market ($15K-$100K) | $12,000-$18,000/day |
| Enterprise (>$100K) | $25,000-$50,000/day |
Overall distribution: Median $8,200/day (~$3.0M annualized). Top 25% hits $19,500+/day. Bottom 25% sits below $2,800/day. The gap between top and bottom quartile is 2.5x - that's not a rounding error, it's the difference between a team that's scaling and a team struggling to make payroll.
Velocity by Industry
Most benchmarks only segment velocity by company size. Industry-specific data tells a different story:
| Industry | Avg Velocity |
|---|---|
| Real Estate & Construction | $2,456/day |
| Financial Services | $2,134/day |
| SaaS & Technology | $1,847/day |
| Marketing & Advertising | $743/day |
Real Estate and Financial Services outpace SaaS on velocity - larger deal sizes offset longer cycles. Marketing & Advertising lags significantly, driven by smaller ACVs. If you're a SaaS company benchmarking against "all B2B," you're comparing yourself to industries with fundamentally different deal economics.
Sales cycle length accounts for 28% of velocity variation, win rate 25%, number of opportunities 24%, and deal size 23%. They're roughly equal, which means there's no single magic lever. But cycle length has the slight edge, reinforcing why the drag zone thresholds matter.
Let's be honest: if your ACV is under $25K and your velocity is below $3,000/day, you don't have a pipeline problem - you have a deal-size problem. Either move upmarket or dramatically increase volume. Trying to "optimize" your way out of sub-scale economics is a treadmill.
Coverage: 3x Is Lazy
The "3x pipeline coverage" rule is the most repeated and least useful benchmark in sales. It assumes a ~33% win rate, uniform deal quality, and a single time horizon. None of those hold.
Raw vs Weighted Coverage
Raw coverage is simple: total pipeline value divided by quota. If you need to close $500K this quarter and you have $1.5M in pipeline, that's 3x coverage.
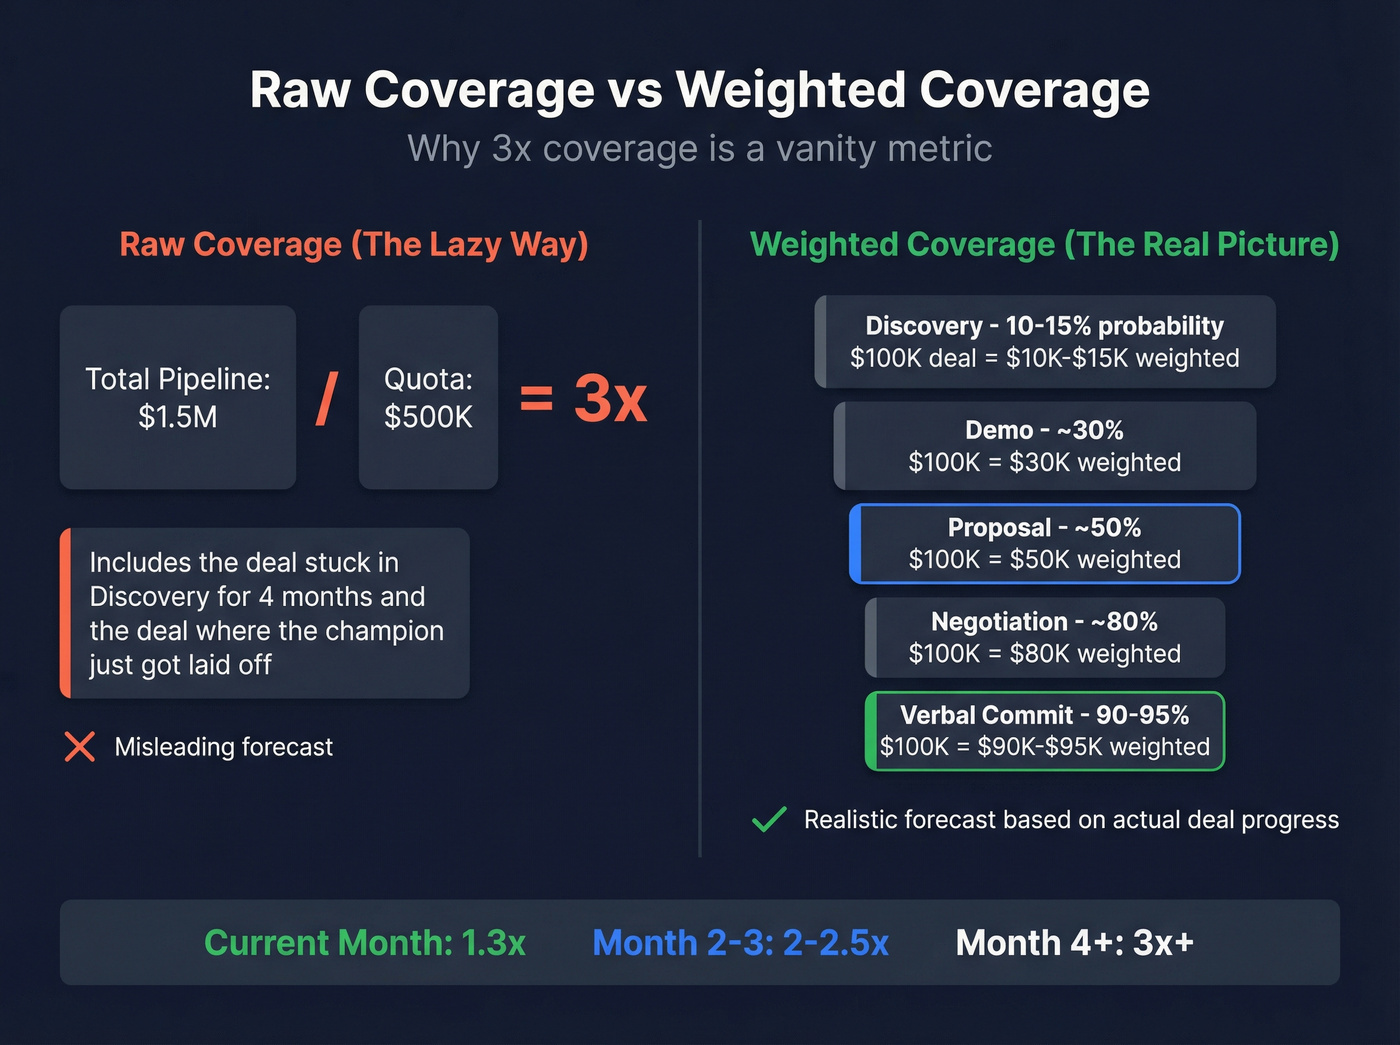
The problem is that $1.5M includes the deal stuck in "Discovery" for four months and the deal where the champion just got laid off. Weighted coverage assigns a probability to each stage and sums expected values:
| Stage | Probability |
|---|---|
| Discovery | 10-15% |
| Demo/Presentation | ~30% |
| Proposal | ~50% |
| Negotiation | ~80% |
| Verbal Commit | 90-95% |
A $100K deal in Discovery is worth $10K-$15K in weighted terms. That same deal at Proposal is worth $50K. Weighted coverage gives you a realistic forecast instead of a vanity number.
Coverage Targets by Segment
The time-horizon nuance is critical:
| Time Horizon | Coverage Needed | Why |
|---|---|---|
| Current month | ~1.3x | Late-stage, high-probability deals |
| Month 2-3 | 2-2.5x | Mix of mid and late stage |
| Month 4+ | 3x+ | Early-stage, lower probability |
By segment:
| Segment | Weighted Coverage Target |
|---|---|
| SMB | 1.5-2x |
| Mid-Market | 2.5-3.5x |
| Enterprise | 4-5x |
Look, if someone tells you "we need 3x coverage" without specifying the time horizon or segment, they're guessing. An enterprise team with 3x coverage for next quarter is short. An SMB team with 3x for this month is sitting on more pipe than they can work.
Channel Benchmarks
Not all pipeline sources convert equally. MQL-to-SQL conversion rates by channel for B2B SaaS:
| Channel | MQL to SQL Rate |
|---|---|
| SEO / Organic | 51% |
| 46% | |
| Webinars | 30% |
| PPC / Paid Search | 26% |
SEO leads convert at nearly double the rate of PPC leads. Someone who found your product through an organic search has higher intent than someone who clicked an ad. But most teams still allocate the majority of demand gen budget to paid channels because the volume is easier to control.
For PLG motions, free trial-to-paid conversion averages 8-12%, with top performers hitting 15%. The takeaway for pipeline planning: weight your channel mix by conversion rate, not just volume. A hundred SEO-sourced MQLs are worth more than 200 PPC-sourced MQLs in pipeline terms.
If you want to pressure-test your channel mix, start with funnel metrics and work backward from revenue.
The Hidden Variable: Data Quality
Every benchmark in this article assumes your pipeline data is accurate. Most teams' data isn't.
How Bad Emails Inflate Pipeline
A rep adds 200 contacts to a sequence. 35% of emails bounce. The remaining 130 contacts get touched, but the CRM still shows 200 "active" contacts. Stage conversion rates look artificially low because the denominator is inflated with dead records. Deals sit in early stages forever because the prospect never received the outreach. Your pipeline looks full, but it's full of ghosts.
Quick Data Hygiene Audit
Three checks you can run inside your CRM this week:
- Bounce rate on last 30 days of outbound. Above 5%, your contact data is stale. Above 10%, it's actively damaging your sender reputation.
- Contacts with no activity in 90+ days. Dead records or prospects who never received your emails. Either way, they're inflating your pipeline.
- Duplicate rate on new imports. If every list import creates 5%+ duplicates, your enrichment source isn't deduplicating properly.
If you’re seeing issues here, it’s usually a mix of email bounce rate problems and weak email deliverability fundamentals.
What Happens When You Fix It
Meritt went from a 35% bounce rate to under 4% after switching to Prospeo. Pipeline tripled - from $100K to $300K per week. Connect rates jumped 3x to 20-25%.
Snyk had 50 AEs each spending 4-6 hours per week prospecting with 35-40% bounce rates. After cleaning up their data layer, bounces dropped below 5%, AE-sourced pipeline jumped 180%, and they generated 200+ new opportunities per month.
Both cases illustrate the same principle: your sales pipeline benchmarks are only as good as your data inputs. To keep data clean at scale, you need a verification layer that runs continuously - not a one-time scrub. A 7-day refresh cycle (versus the industry average of six weeks) is the difference between benchmarking against reality and benchmarking against ghosts.
Pipeline velocity drops when reps waste hours chasing bad data. Prospeo's 7-day refresh cycle and 92% enrichment match rate keep your CRM current so cycle times shrink and coverage ratios hold.
Stop benchmarking on stale data - refresh your pipeline inputs weekly.
Advanced Benchmarks
Once you've nailed the fundamentals, two advanced frameworks are worth adopting.
Cohorted win rates group opportunities by creation month, then track outcomes over subsequent months. Instead of a blended "21% win rate," you see that January cohort closed at 24%, February at 18%, and March at 26%. This reveals seasonality, campaign quality shifts, and rep ramp effects that blended metrics hide entirely. Sacks calls this the single most important upgrade teams can make to their forecasting.
Pipeline waterfall analysis tracks how pipeline value changes between forecast snapshots. You start the quarter with $2M in pipeline. By mid-quarter, $400K closed, $300K was lost, $200K slipped to next quarter, and $600K of new pipeline entered. The waterfall shows net movement - and more importantly, close-date slippage patterns. If 30%+ of your pipeline consistently slips to the next period, your stage definitions need work.
We've run pipeline waterfalls for teams that thought they had a "closing problem" and discovered they actually had a "deals entering pipeline too early" problem. Opportunities were being created before real buying intent existed, inflating coverage numbers and then cratering win rates when those deals inevitably stalled out.
This is also where a tighter sales process optimization effort pays off fast.
How to Use These Benchmarks Safely
Benchmarks are diagnostics, not weapons. Using them to punish reps is how you get the Reddit scenario - a rep builds $3M in pipeline and gets called abysmal because leadership picked the wrong benchmark.
Step 1: Segment first. Match by ACV band, industry, and sales motion. Never compare to an unsegmented benchmark.
Step 2: Identify the bottleneck. MQL-to-SQL is typically the biggest drop. If yours is below 15%, focus there before optimizing anything downstream. Improving conversion rates at this single stage often has a bigger impact than tweaking close techniques.
Step 3: Benchmark against yourself. Your Q1 numbers are the best benchmark for Q2. External benchmarks tell you if you're in the ballpark. Internal trends tell you if you're improving.
Step 4: Fix inputs before blaming outputs. If win rates are low, check data quality first. If velocity is slow, check cycle length by stage.
Step 5: Set per-rep targets from the math. If quota is $500K/quarter and win rate is 20%, each rep needs $2.5M in pipeline. At 3x coverage, that's $1.5M per rep. Work backward from the sales pipeline benchmarks, not forward from gut feel.
If you want a deeper diagnostic layer, pair this with a pipeline health review and your sales operations metrics.
The teams that get the most value from benchmarks treat them like a doctor treats lab results - useful for diagnosis, dangerous for self-medication. Revisit quarterly as your market, team, and product evolve.
FAQ
What Is a Good Pipeline Coverage Ratio in 2026?
SMB teams need 1.5-2x weighted coverage; enterprise teams need 4-5x. Current-month pipeline should sit at ~1.3x if deals are late-stage. The blanket "3x" rule oversimplifies - always specify your time horizon and use stage-weighted probabilities instead of raw totals.
What's a Healthy Win Rate for B2B SaaS?
The average B2B win rate is roughly 21%. SaaS deals under $25K close at ~30%, mid-market at ~20%, and enterprise above $100K at ~15% or below. Known-contact deals close at 37% versus 19% for cold outreach - data quality directly impacts win rates.
How Do You Calculate Pipeline Velocity?
Pipeline velocity = (Number of Opportunities x Average Deal Size x Win Rate) / Sales Cycle Length in Days. The result is dollars per day of revenue throughput. Median velocity across 939 companies is $8,200/day, with top-quartile teams hitting $19,500+/day.
What's the Average B2B Sales Cycle Length by Deal Size?
For 2026 tech companies: $10K-$25K ACV deals close in a median of 38 days, $25K-$50K in 72 days, $50K-$100K in 128 days, and deals above $100K take 187 days. If your cycle exceeds the drag zone thresholds (55, 100, 175, and 250 days respectively), investigate time-in-stage data to find where deals stall.
How Can I Improve Pipeline Metrics Without More Leads?
Focus on stage conversion rates and data quality first. MQL-to-SQL is the biggest drop-off - tightening lead scoring criteria alone can improve it significantly. On the data side, cleaning up bounced emails and stale contacts removes phantom pipeline and improves every downstream metric. Even switching to a data provider with a weekly refresh cycle instead of a monthly one can shift your benchmarks from fiction to reality.