Funnel Metrics: What to Track & Benchmarks (2026)
37% of marketing budgets are wasted due to poor measurement. Not poor strategy, not bad creative - bad measurement. The fix isn't tracking more funnel metrics. It's tracking the right ones and knowing what "good" actually looks like.
If you only have time for one section, skip to the industry benchmarks below. Five metrics cover the full funnel: visitor-to-lead conversion rate, MQL-to-SQL rate, pipeline velocity, CAC, and logo churn.
What Are Funnel Metrics?
Funnel metrics measure how prospects move from first touch to closed deal to retained customer. They're stage-gate conversion rates, not vanity dashboards.
60% of consumers take 6+ actions before deciding to buy from a new brand. A single metric can't capture that journey. And fifteen metrics won't help either if you don't know what "good" looks like for each one.
Stage-by-Stage Breakdown
Top of Funnel
Two numbers matter here. Visitor-to-lead conversion rate tells you whether your content and landing pages are doing their job. Cost per lead tells you whether you can afford the answer.
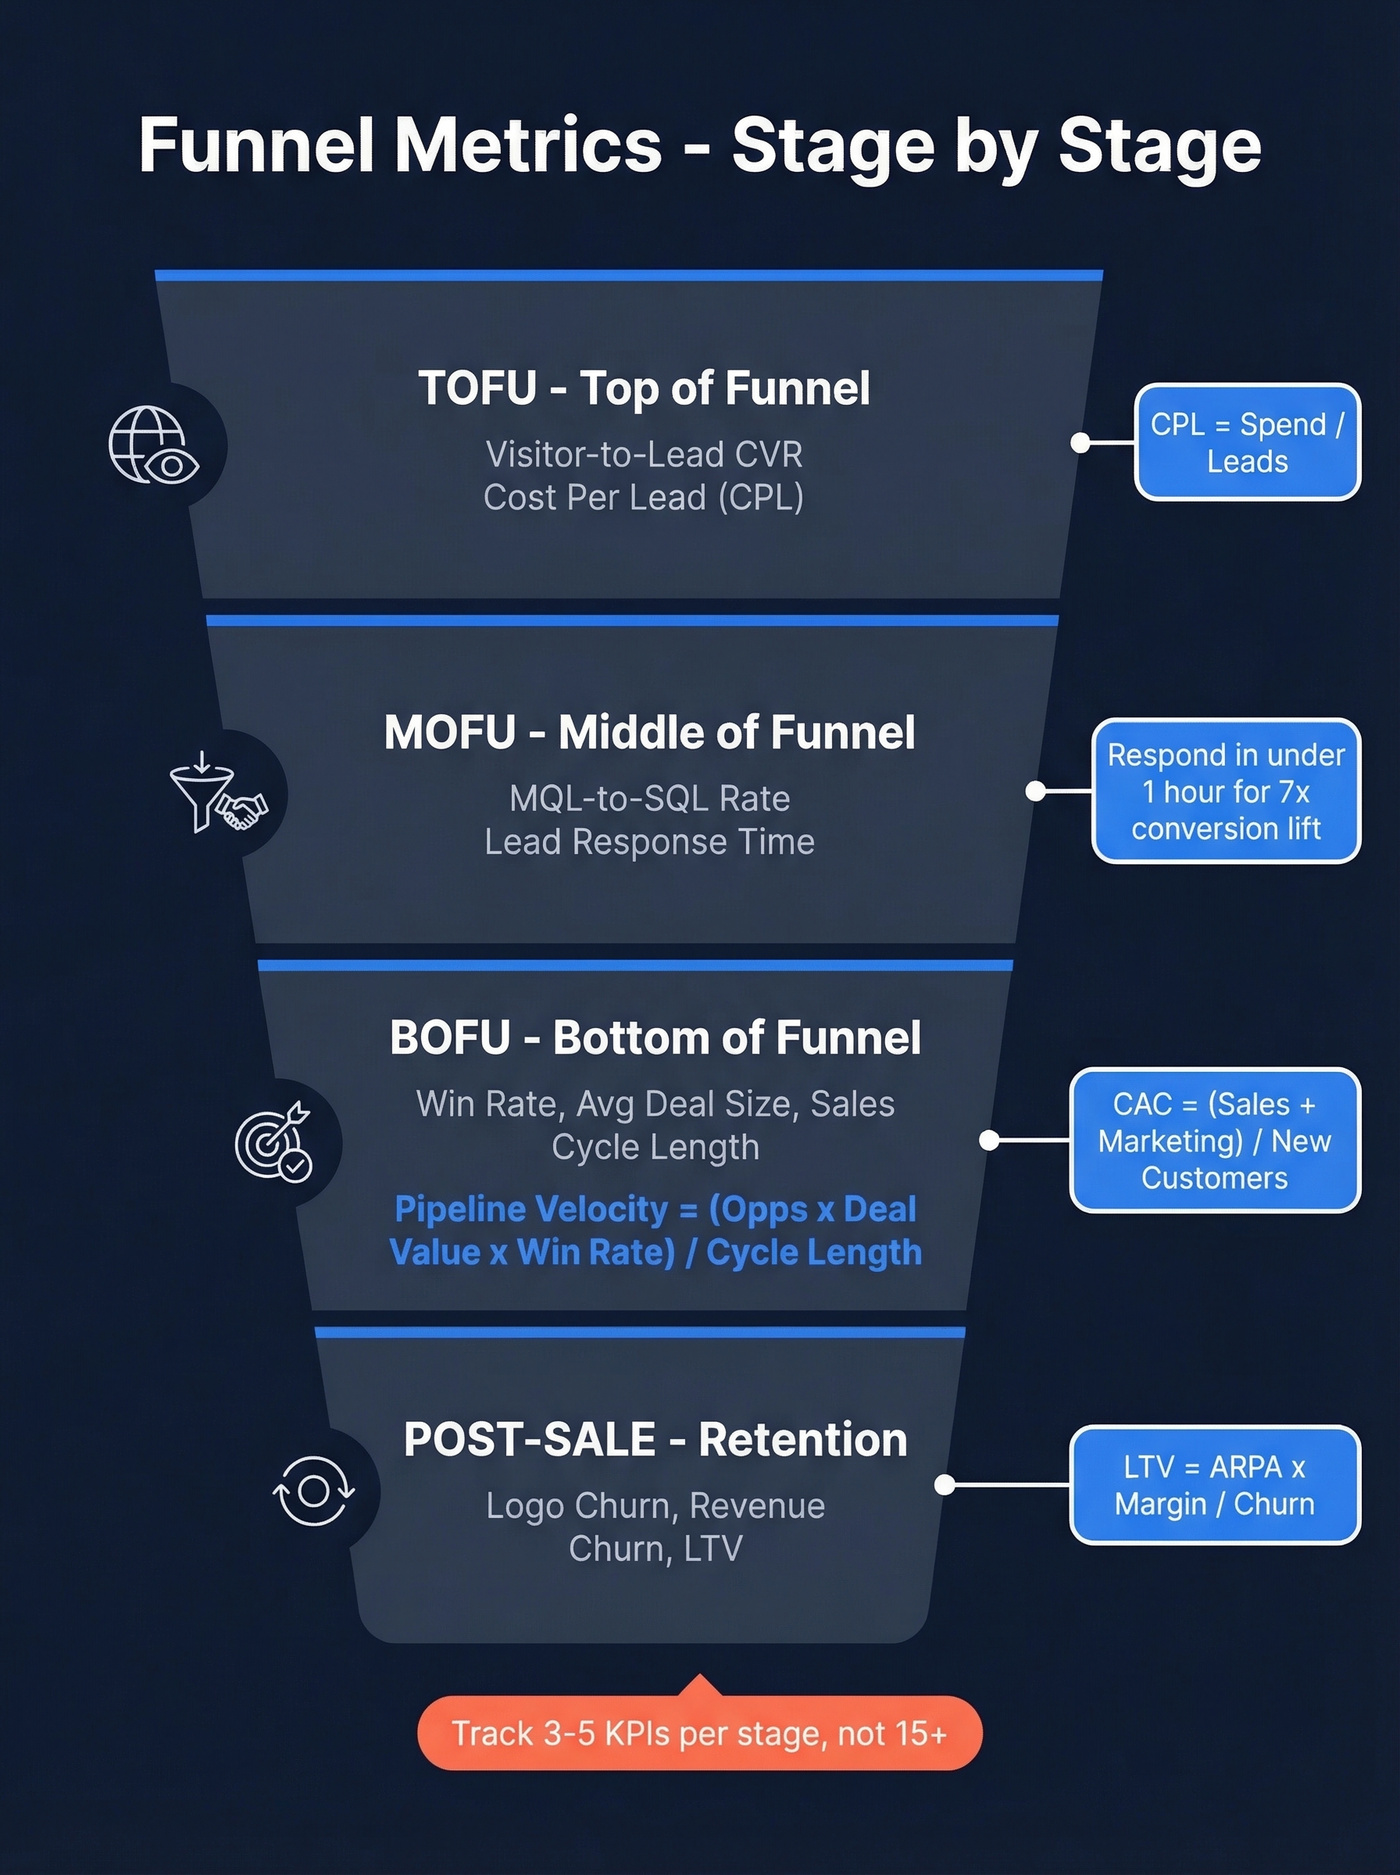
CPL = Total spend / Leads generated. Spending $15,000/mo on paid and generating 300 leads puts your CPL at $50. Whether that's good depends entirely on what happens next.
Middle of Funnel
MQL-to-SQL rate is the metric that separates marketing theater from pipeline contribution. It answers one question: are the leads marketing passes to sales actually worth a conversation?
Lead response time is the operational lever most teams ignore. Responding to high-intent MQLs within the first hour increases conversion probability up to 7x. After 24 hours, conversion rates drop off a cliff.
If your MQL-to-SQL rate is low, it’s usually a lead scoring and qualification definition problem, not a “sales effort” problem.
Bottom of Funnel
Three metrics here - win rate, average deal size, and sales cycle length. Individually, they're useful. Combined, they give you Pipeline velocity, the only metric that captures volume, value, speed, and close rate in one number.
Pipeline velocity = (Opportunities x Avg Deal Value x Win Rate) / Sales Cycle Length
Worked example: (200 opportunities x $26,000 x 25% win rate) / 84 days = $15,476/day moving through your pipeline. If that number is trending down, something is broken - even if individual metrics look fine.
CAC = (Sales + Marketing spend) / New customers acquired. This number sets the floor. Your LTV sets the ceiling. If the gap between them is shrinking, you've got a growth problem masquerading as a scaling success.
If you want a tighter view of what’s “normal” across stages, compare against sales pipeline benchmarks rather than generic conversion averages.
Post-Sale
Logo churn, revenue churn, and LTV. These are the metrics boards care about.
- Churn = Lost customers / Starting customers. Revenue churn swaps customers for MRR.
- LTV (subscription model) = ARPA x Gross margin % / Churn rate. If your ARPA is $500/mo, gross margin is 80%, and monthly churn is 3%, your LTV is ~$13,333.
Here's my strong opinion: logo churn matters more than revenue churn for early-stage companies. If logos are leaving, your product has a retention problem that upsells can't mask. (If you want to go deeper, use a structured churn analysis approach.)
Funnel Benchmarks by Industry
Different funnels have different shapes. Stop benchmarking your SaaS pipeline against ecommerce numbers - they're structurally different businesses with structurally different conversion patterns.
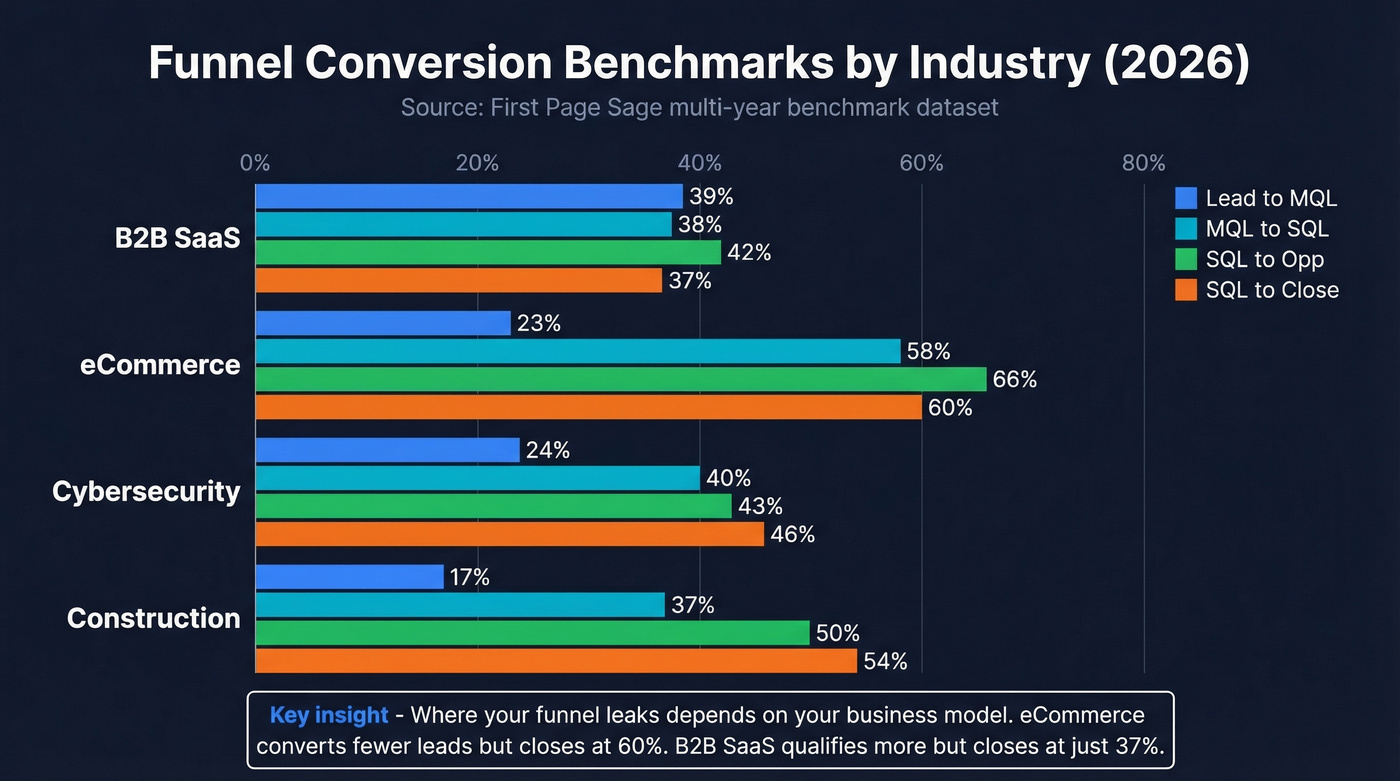
The numbers below come from First Page Sage's multi-year benchmark dataset, one of the most comprehensive sources available and widely referenced for 2026 planning.
| Industry | Lead to MQL | MQL to SQL | SQL to Opp | SQL to Close |
|---|---|---|---|---|
| B2B SaaS | 39% | 38% | 42% | 37% |
| eCommerce | 23% | 58% | 66% | 60% |
| Cybersecurity | 24% | 40% | 43% | 46% |
| Construction | 17% | 37% | 50% | 54% |
B2B SaaS converts 39% of leads to MQLs but closes at just 37% once qualified. eCommerce converts only 23% to MQL - but closes at 60%. The takeaway: where your funnel leaks depends on your business model, not some universal "best practice."
Ecommerce CVR by Vertical
| Vertical | CVR |
|---|---|
| Food & Beverage | 6.00% |
| Beauty & Personal Care | 4.21% |
| Multi-Brand Retail | 3.68% |
| Fashion/Apparel | 2.92% |
| Home & Furniture | 1.32% |
| Luxury & Jewelry | 0.90% |
| Global Average | 2.79% |
Data aggregated from Dynamic Yield's benchmark across 200M+ monthly unique users. If you're in luxury and hitting 1.5%, you're outperforming. If you're in food & beverage and sitting at 3%, you're actually below the category average by half.
Inflated funnel denominators destroy your benchmarks. If bounced emails inflate your MQL counts, every conversion rate downstream is a lie. Prospeo's 98% email accuracy and 7-day refresh cycle mean your funnel metrics measure real prospects - not data rot.
Stop measuring ghosts. Start measuring pipeline that converts.
Benchmarks by Channel (B2B SaaS)
| Channel | Visitor to Lead | Lead to MQL | MQL to SQL |
|---|---|---|---|
| SEO | 2.1% | 41% | 51% |
| PPC | 0.7% | 36% | 26% |
| 2.2% | 38% | 30% | |
| 1.3% | 43% | 46% | |
| Webinar | 0.9% | 44% | 39% |
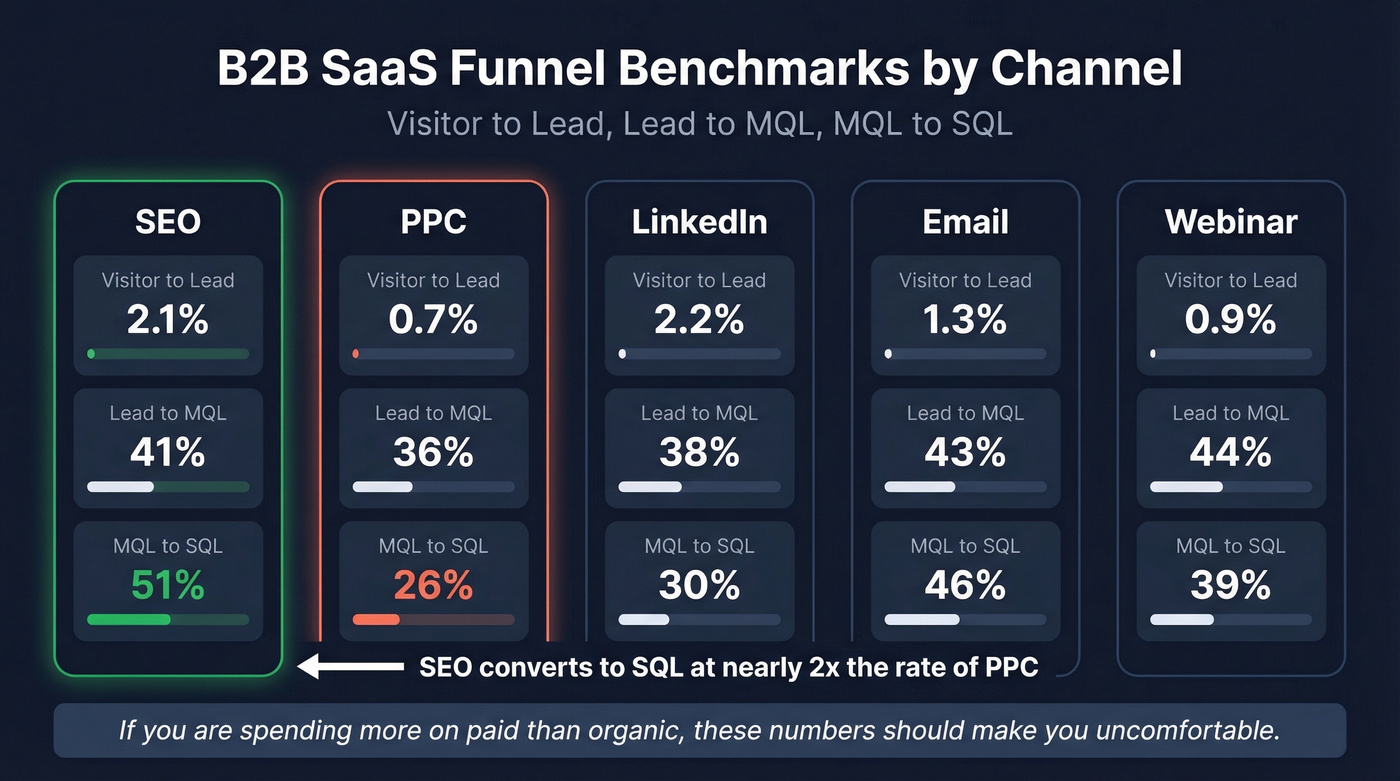
SEO leads convert to SQLs at 51% vs. PPC at 26%. If you're spending more on paid than organic, these numbers should make you uncomfortable.
In our experience, the quality gap is even wider than the table suggests. PPC generates volume fast, but by the time you reach SQL, you've lost nearly three-quarters of your paid leads compared to organic. We've seen teams cut PPC spend by 30%, reallocate to content, and see pipeline velocity increase within two quarters.
If you’re building a repeatable system here, start with a documented lead generation workflow so channel benchmarks map cleanly to stages.
Three Mistakes That Break Your Funnel
Tracking Too Many KPIs
That 37% of wasted marketing budget? A big chunk comes from teams drowning in dashboards they never act on. We've seen teams track 15+ metrics and act on none of them. Track 3-5 KPIs per campaign. If a metric doesn't change a decision, it's decoration.
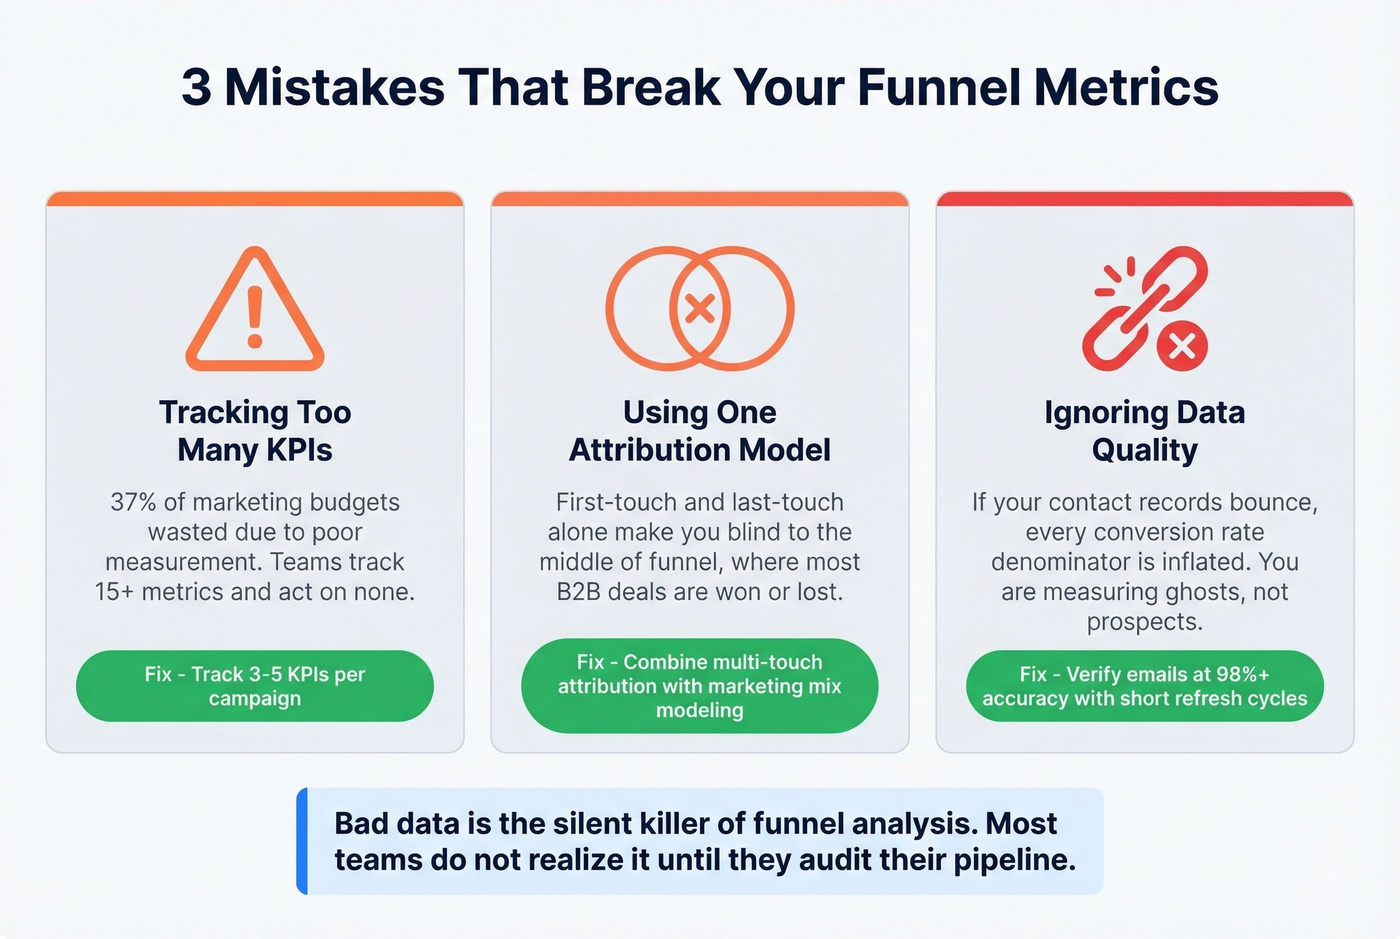
Using One Attribution Model
First-touch and last-touch attribution alone make you blind to what's actually working in the middle of your funnel, which is where most B2B deals are won or lost. Combine models - multi-touch attribution for tactical decisions, marketing mix modeling for budget allocation. Neither is perfect. Both together are better than either alone.
Ignoring Data Quality
Ask any RevOps team what breaks their funnel reporting and you'll hear the same answer: dirty CRM data. If a large share of your contact records bounce, your conversion rate denominators are inflated. You're measuring ghosts.
Let's be honest about what this looks like in practice. Your MQL-to-SQL rate looks great because half the "MQLs" were invalid emails that never received a sequence. The metric is a lie. Prospeo verifies emails at 98% accuracy with a 7-day refresh cycle, which means your conversion rates reflect real humans - not data rot.
If you’re seeing this pattern, start by tracking email bounce rate alongside funnel conversion rates so you can separate “bad leads” from “bad messaging.”

Tools for Tracking Funnel Metrics
Web analytics: GA4 (free) handles top-of-funnel tracking out of the box.
CRM / pipeline: HubSpot offers a free CRM with Marketing Hub starting around $800/mo. Salesforce runs $25-300/user/mo depending on tier. For teams under 50 reps, HubSpot's free CRM is usually enough to get clean stage-by-stage data - skip Salesforce until you actually need the customization. (If you’re evaluating options, see Salesforce Pricing, Reviews, Pros & Cons.)
Product analytics: Mixpanel has a free tier with Growth plans from ~$28/mo. Amplitude is similar - free tier, paid from ~$49/mo. Both are strong for tracking in-product conversion events that feed your bottom-of-funnel metrics.
Data quality / contact verification: This is where most teams cut corners and pay for it later. Prospeo's free tier gives you 75 email verifications per month, with paid plans at ~$0.01/email and no contracts.
If you’re comparing vendors, start with a shortlist of data enrichment services so your CRM stages reflect real firmographics, not guesswork.
Pipeline velocity depends on reaching real buyers with valid contact data. Prospeo delivers 300M+ verified profiles at ~$0.01/email - so your win rates, cycle times, and CAC reflect actual conversations, not bounced sequences.
Every funnel metric improves when the data underneath it is real.
FAQ
What are the most important sales funnel KPIs?
Five metrics cover the full picture: visitor-to-lead conversion rate, MQL-to-SQL rate, pipeline velocity, CAC, and logo churn. Together they span every stage from awareness through retention. For B2B SaaS, the average MQL-to-SQL rate is 38%, and top-performing teams with stricter qualification definitions hit 25-35%. Below 10% usually signals a lead scoring or ICP problem, not a sales problem.
What is pipeline velocity?
Pipeline velocity measures how fast revenue moves through your funnel: (Opportunities x Avg Deal Value x Win Rate) / Sales Cycle Length. It's the only single metric that combines volume, value, speed, and close rate. Track it monthly - a downward trend signals trouble even when individual conversion rates look healthy.
How do I pick the right KPI for my business?
Start by identifying where prospects drop off most. If top-of-funnel volume is strong but deals stall mid-pipeline, focus on MQL-to-SQL rate and lead response time. If close rates are healthy but growth is flat, shift attention to CPL and visitor-to-lead conversion. The right metric is always the one tied to your biggest bottleneck - not the one that's easiest to measure.
How do I keep my conversion data accurate?
Start with clean contact data. If your records have high bounce rates, every conversion rate in your funnel is inflated. Use a verification tool with a short refresh cycle to keep your CRM denominators honest. Bad data is the silent killer of funnel analysis, and most teams don't realize it's a problem until they audit their pipeline and find half their "leads" were never reachable.