The Only Sales Operations Metrics That Actually Drive Decisions
84% of sales reps missed quota last year. That's not a data problem - it's a measurement problem. Most sales ops teams track 20+ metrics and act on maybe three, while 45% of sales professionals say they're overwhelmed by the number of tools in their stack. More dashboards, more widgets, more noise. Let's fix that with a framework that ties every metric to a decision, a cadence, and a benchmark.
What Sales Ops Metrics Actually Are
Sales ops metrics aren't the same as rep performance KPIs. Rep metrics measure individual output - calls made, deals closed, revenue booked. Sales operations metrics measure whether the system works: process efficiency, data quality, forecast reliability, pipeline health. Think of it as the difference between checking a player's batting average and checking whether the stadium lights are on.
The cleanest way to organize them is a three-bucket model: activity metrics (leading inputs), conversion metrics (mid-funnel progression), and outcome metrics (lagging results). Activity tells you what's happening now. Conversion tells you what's working. Outcomes tell you what already happened - useful for reporting, useless for coaching.
Five Metrics That Earn Their Pixels
If your dashboard could only show five numbers, these are the ones:
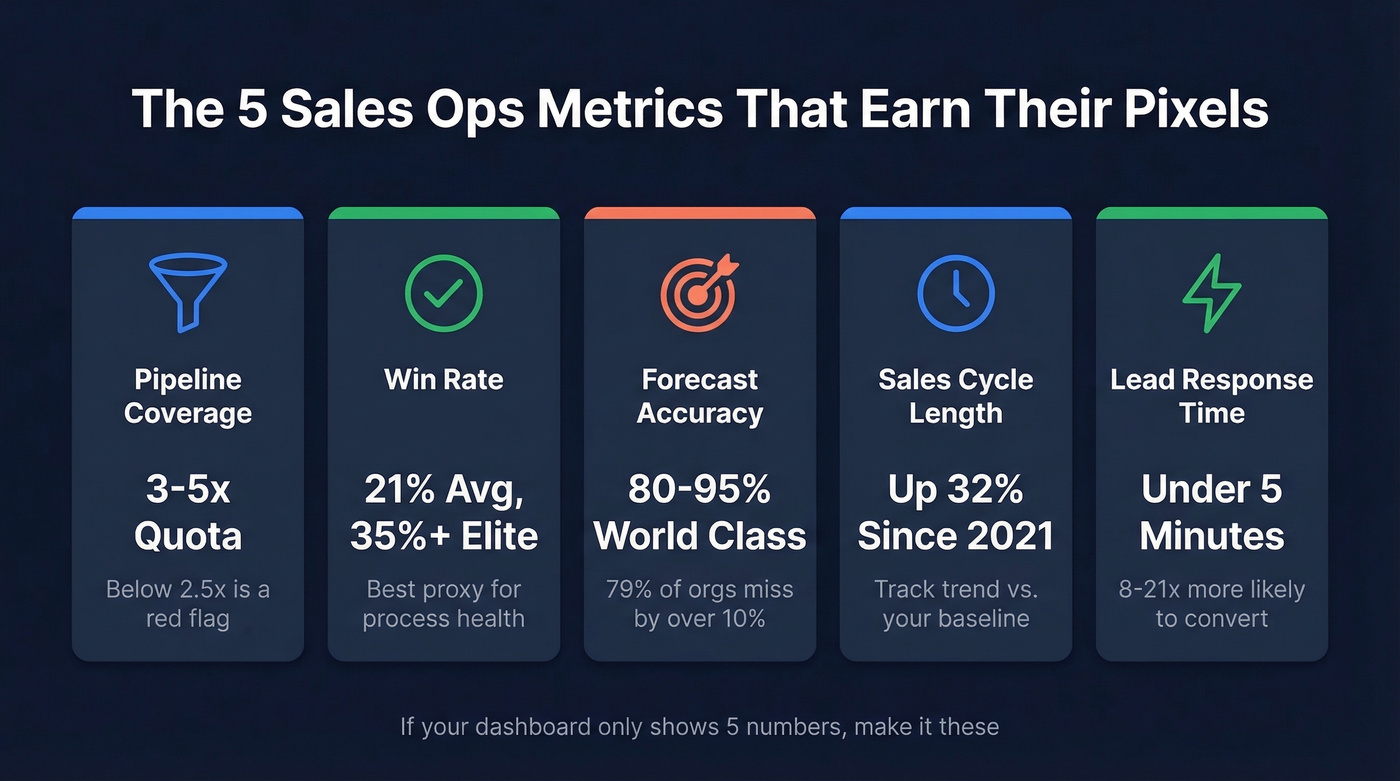
- Pipeline coverage ratio - Are you building enough pipe to absorb losses? 3-5x quota is the target.
- Win rate - The single best proxy for sales process health. Average B2B win rate sits around 21%; best-in-class hits 35-40%+.
- Forecast accuracy - How well does your commit match reality? Below 70% accuracy, you're in the average band at best.
- Sales cycle length - Cycles have grown 32% since 2021. If yours is creeping, something upstream broke.
- Lead response time - Under 5 minutes and you're 8-21x more likely to convert. After 30 minutes, you've already lost.
Metrics That Matter, by Cadence
Tracking the right metrics at the wrong frequency is almost as bad as tracking the wrong ones. A tiered cadence model prevents dashboard overload while keeping the right numbers in front of the right people at the right time.
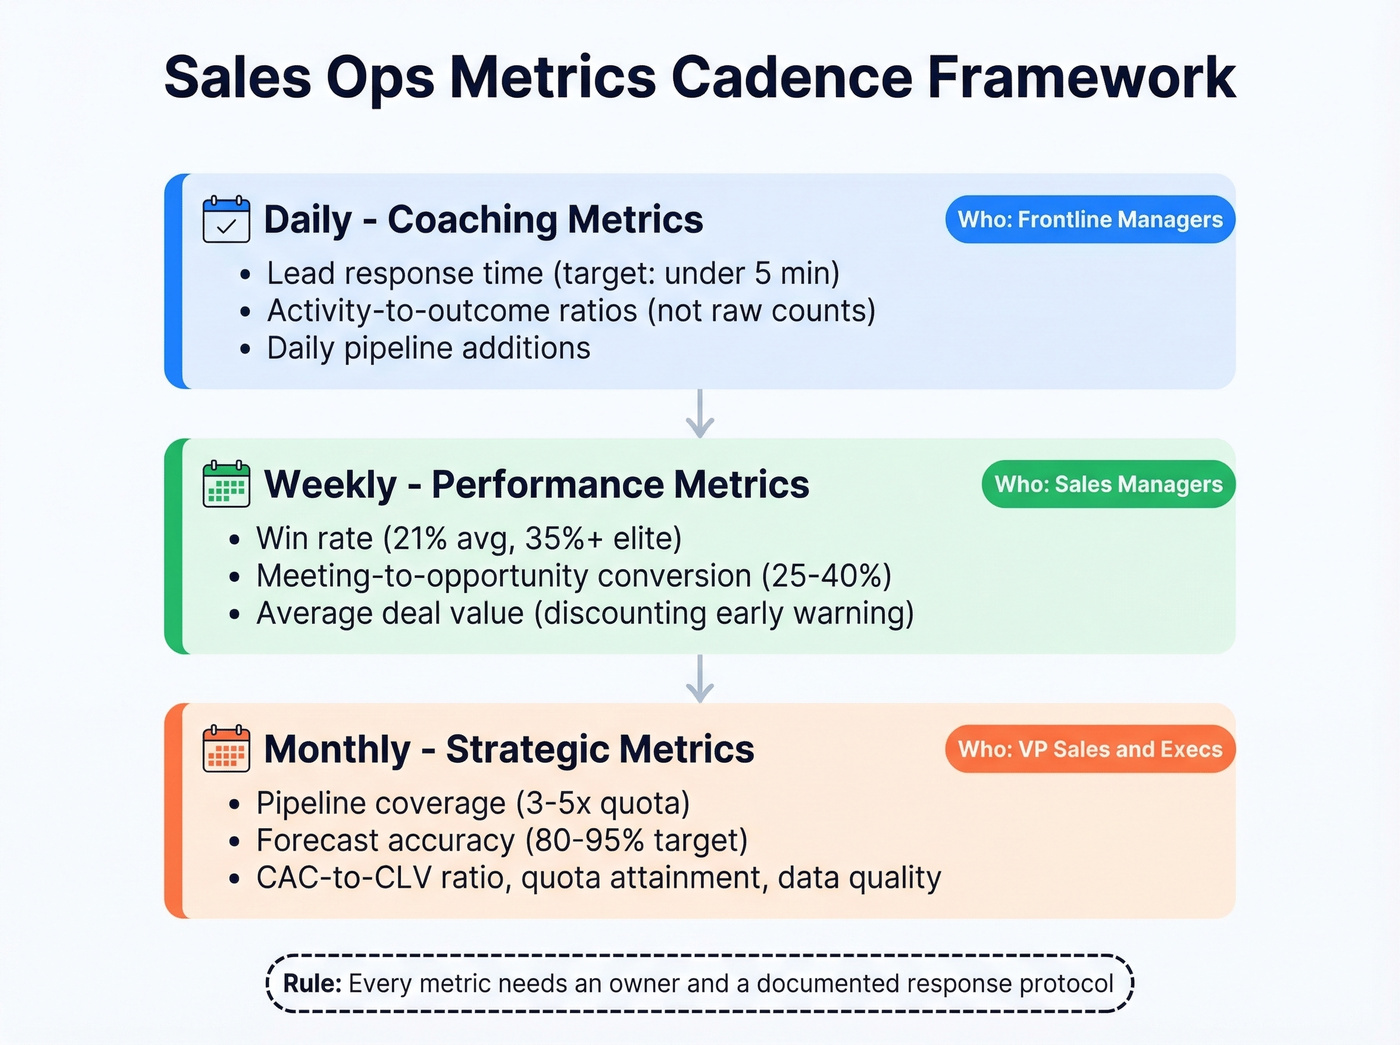
Daily Coaching Metrics
Track these: Lead response time (target: under 5 minutes), activity-to-outcome ratios (not raw activity counts), and daily pipeline additions. The lead response number matters more than most teams realize - 35-50% of deals go to the first responder.
Skip raw activity counts entirely. Total calls logged, emails sent, or tasks completed are the most gameable metric in sales. Reps learn to log phantom touches faster than they learn to prospect.
What matters is the ratio of activity to pipeline created. Ten calls that generate two qualified meetings beats fifty calls that generate noise every single time.
Weekly Performance Metrics
Win rate is your weekly heartbeat. The average B2B win rate sits around 21%, but best-in-class teams push 35-40%+. If your win rate drops two weeks in a row, something changed - qualification criteria slipped, a competitor launched a feature, or reps are sandbagging pipe to hit next quarter.
Track meeting-to-opportunity conversion alongside it. Healthy teams convert 25-40% of meetings into real opportunities. Below 20%, your meetings aren't qualified. Average deal value rounds out the weekly view as the early warning system for discounting creep.
Monthly Strategic Metrics
Pipeline coverage should sit at 3-5x; if win rate is low, push closer to 4-5x. Forecast accuracy separates world-class ops teams (80-95% accuracy) from the average (50-70%), and 79% of sales orgs miss their forecast by more than 10%. Documented sales ops strategies lead to 25-30% faster deal closes - the payoff is real.
CAC-to-CLV ratio, quota attainment, and sales velocity belong here too. But there's one metric most teams overlook at this cadence: data quality. Bounce rate, contact accuracy, and enrichment coverage are ops metrics, not marketing metrics. If your email bounce rate exceeds 4%, treat every downstream metric as compromised. We've seen teams obsess over pipeline coverage while sitting on a CRM full of dead contacts - the coverage number looks healthy, but it's built on sand.
You just read that bounce rates above 4% make every downstream metric suspect. Prospeo's 5-step email verification delivers 98% accuracy with a 7-day refresh cycle - so your pipeline coverage, win rate, and forecast numbers are built on contacts that actually exist.
Stop measuring pipeline built on dead contacts.
Benchmark Reference Table
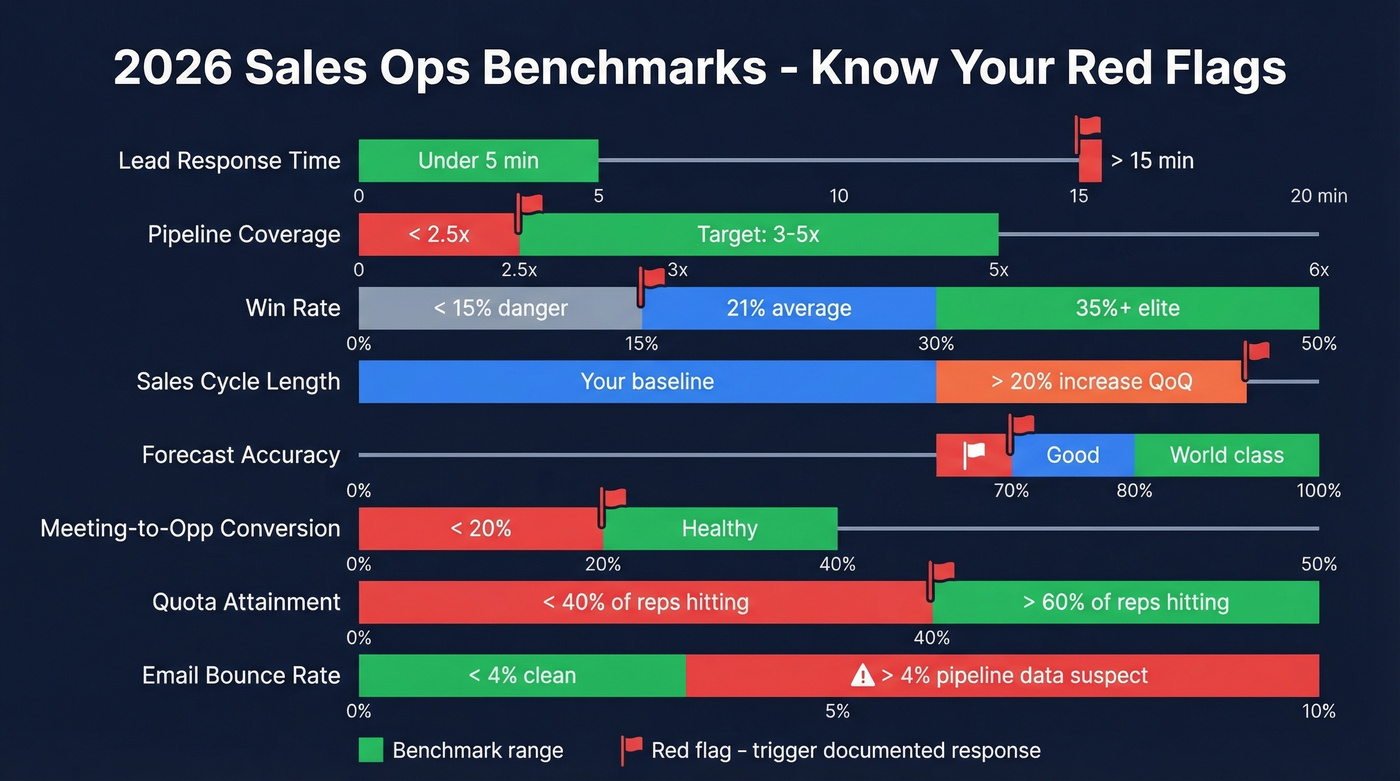
Every benchmark from the framework above, consolidated. The "red flag" column should trigger a documented response - not a Slack message, an actual playbook.
| Metric | Benchmark | Red Flag |
|---|---|---|
| Lead response time | < 5 min | > 15 min avg |
| Pipeline coverage | 3-5x quota | < 2.5x |
| Win rate | 21% avg, 35%+ elite | < 15% |
| Sales cycle length | Track trend vs. baseline | > 20% increase QoQ |
| Forecast accuracy | 80-95% world-class | < 70% or miss > 10% |
| Meeting-to-opp conversion | 25-40% | < 20% |
| Quota attainment | > 60% of reps hitting | < 40% of reps hitting |
| Email bounce rate | < 4% | > 4% = pipeline data suspect |
| CAC payback | < 12 months | > 18 months |
Metrics to Stop Tracking
The most dangerous metric in sales ops isn't one you're missing - it's one you're already watching that gives you false confidence.
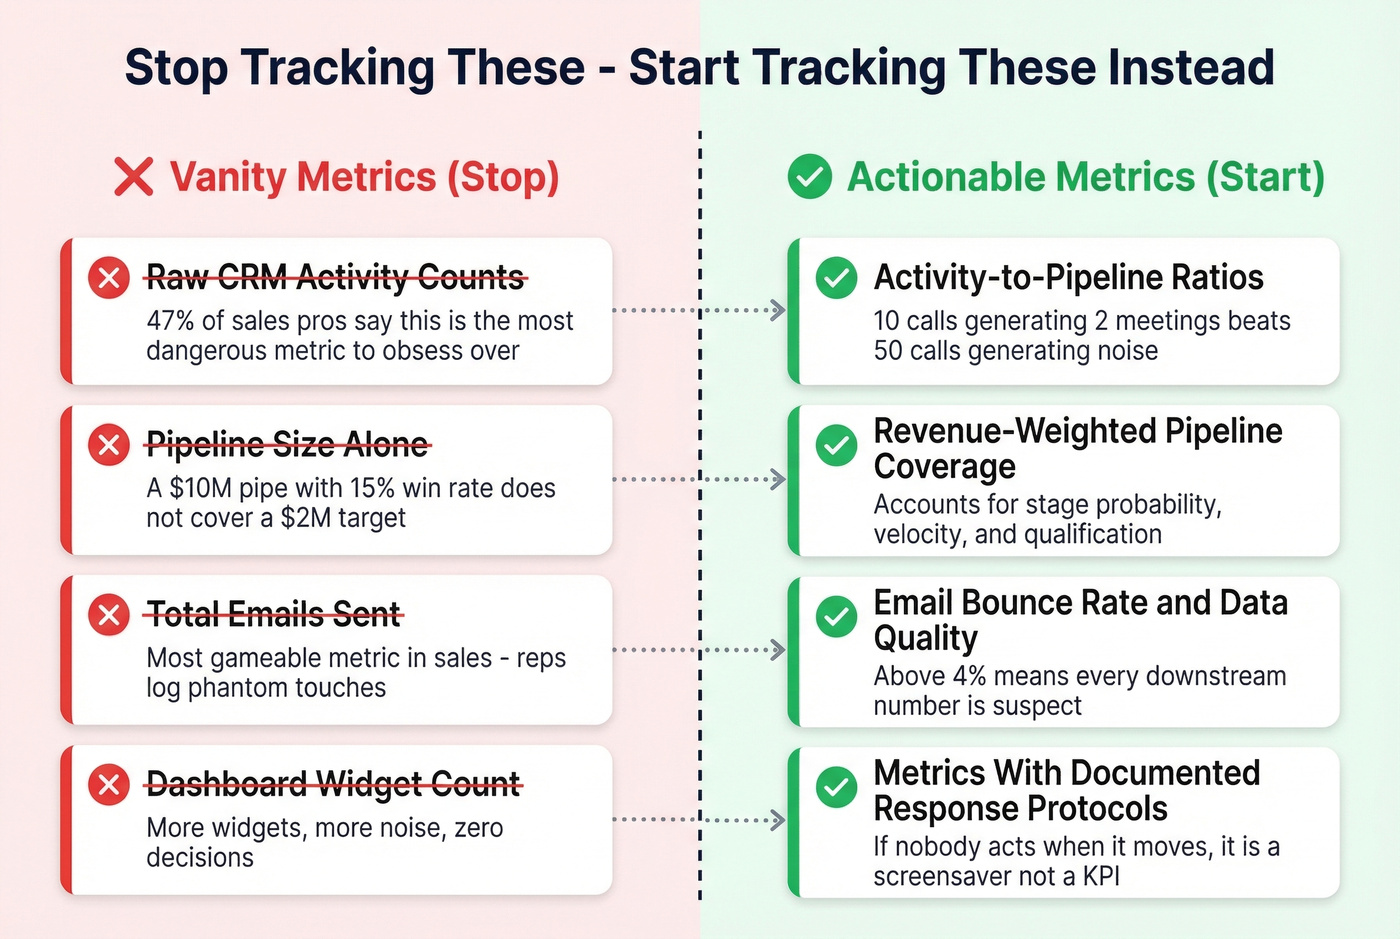
A LinkedIn poll found that 47% of respondents named CRM activity counts as the most dangerous metric to obsess over. Another 37% flagged pipeline size without a coverage ratio. The consensus on r/SalesOperations is even blunter: which metrics actually trigger decisions - hiring, territory changes, budget shifts - versus which ones just decorate dashboards?
Pipeline size alone is meaningless. A $10M pipeline with a 15% win rate and a 6-month cycle doesn't cover a $2M quarterly target, but it looks great on a slide. Replace vanity numbers with revenue-weighted progress metrics that account for stage probability, deal velocity, and qualification score.
Here's the thing: if your ops team can't name the documented response protocol for every metric on the dashboard, you don't have a metrics framework. You have a screensaver.
Building a Dashboard That Drives Action
We've tested dashboards with 30+ widgets and zero documented response protocols - the metrics exist, but nobody acts on them. As Bernard Marr put it, most teams are "data rich, but insight poor." Three rules fix that.
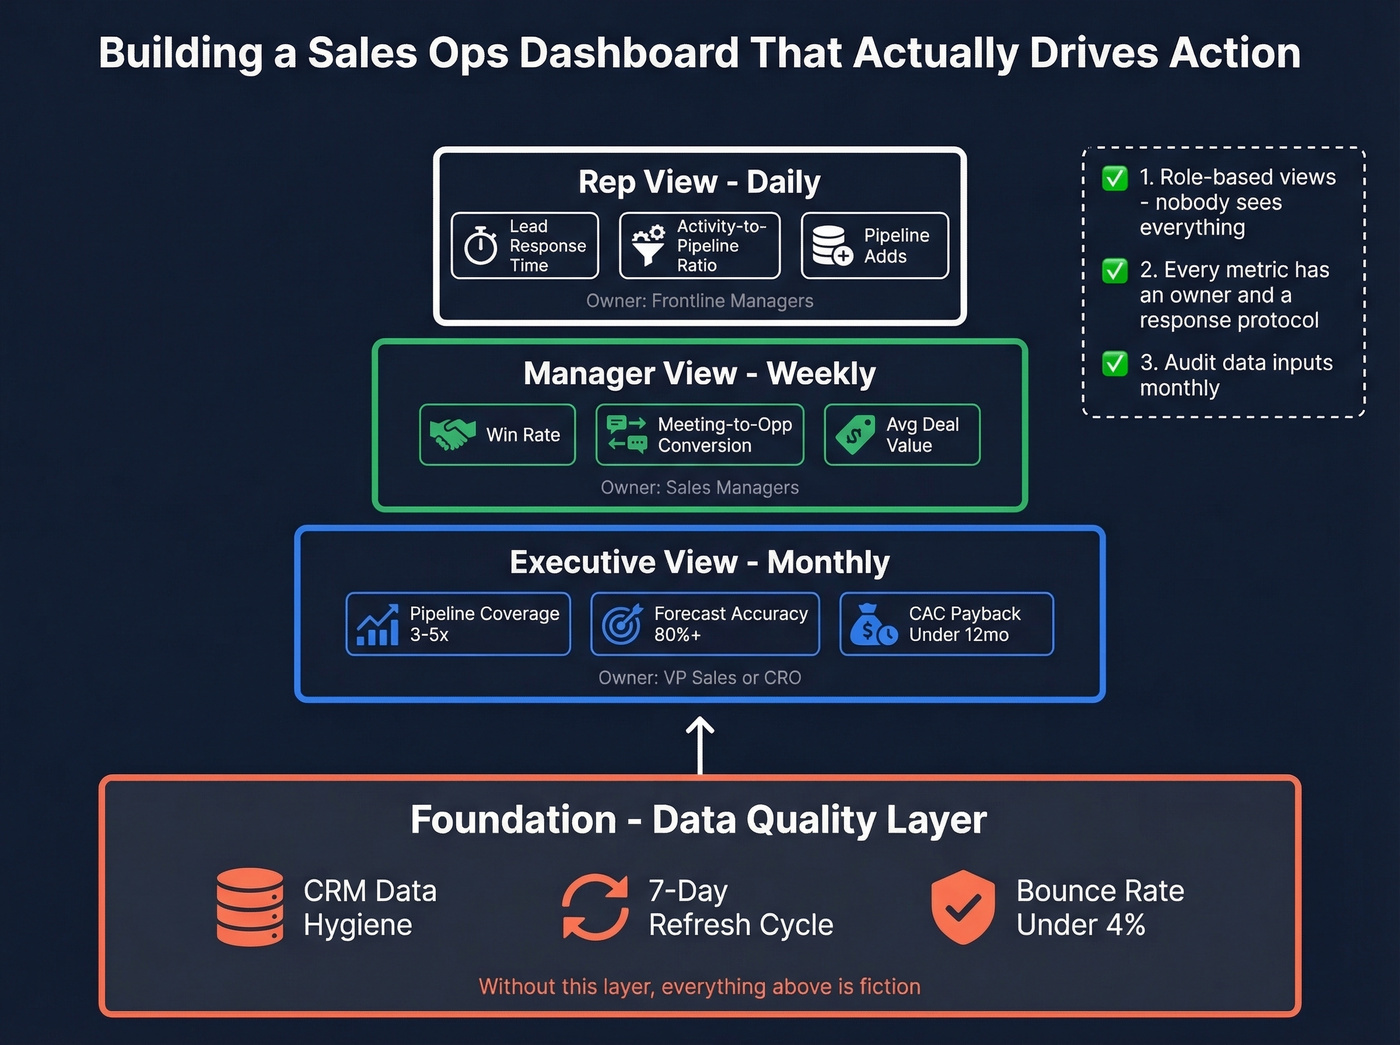
Build role-based views. Reps see daily activity ratios and pipeline adds. Managers see weekly win rates and cycle trends. Execs see monthly coverage, forecast accuracy, and CAC. Nobody sees everything.
Give every metric an owner and a response protocol. If pipeline coverage drops below 3x, who acts? What do they do? If you can't answer that in under ten seconds, the metric is decoration.
Audit your data inputs monthly. Every metric on your dashboard inherits the quality of the data underneath it. If your CRM is full of stale contacts and bounced emails, your pipeline coverage and conversion numbers are fiction. Tools like Prospeo's enrichment API return 50+ data points per contact at a 92% match rate on a 7-day refresh cycle - plug it into Salesforce or HubSpot and your metrics start reflecting reality instead of decaying records.
If you're rebuilding your stack, start with contact management software and a clear sales process optimization plan. Then pressure-test your pipeline health and sales pipeline benchmarks before you add more tooling.
Skip this step if your CRM data is already clean and verified quarterly. But in our experience, that's about 1 in 20 teams.
Data quality is the sales ops metric most teams ignore until it wrecks their forecast. Prospeo enriches your CRM with 50+ data points per contact at a 92% match rate - turning your dashboard from a screensaver into something that drives real decisions.
Clean data in, accurate metrics out - at $0.01 per email.
FAQ
What's the difference between sales metrics and sales operations metrics?
Sales metrics measure rep performance - revenue closed, deals won, quota attainment. Sales ops metrics measure process efficiency: forecast accuracy, pipeline coverage, data quality, and cycle length. Ops metrics tell you whether the system works, not just whether individual reps hit their number.
How many sales ops KPIs should we track?
Eight to ten, organized by review cadence - daily, weekly, and monthly. Every metric needs an owner and a documented action when it moves outside its benchmark range. More than that creates dashboard noise that dilutes focus.
How does data quality affect pipeline and forecast accuracy?
If your contact data has bounce rates above 4%, every downstream metric - conversion rates, pipeline velocity, forecast accuracy - is built on unreliable inputs. Clean, regularly refreshed data is the foundation. Without it, you're making strategic decisions on bad numbers.
What's a good pipeline coverage ratio in 2026?
Aim for 3-5x your quota target. If your win rate is below 20%, push closer to 5x. Below 2.5x coverage is a red flag that should trigger immediate prospecting sprints and a pipeline generation review.