How to Calculate Sales: The Complete Formula Reference
Every guide on calculating sales covers a different formula. One explains gross sales. Another walks through sales tax. A third jumps straight to forecasting. Nobody puts all the formulas in one place with worked examples and tells you which one you actually need.
We've fixed that. If you need to calculate sales for revenue reporting, tax compliance, forecasting, or hitting quota, you need about eight formulas and the judgment to know when each one applies. Here they are.
Quick-Reference Formula Table
Bookmark this. Every calculation covered below, in one scannable view.
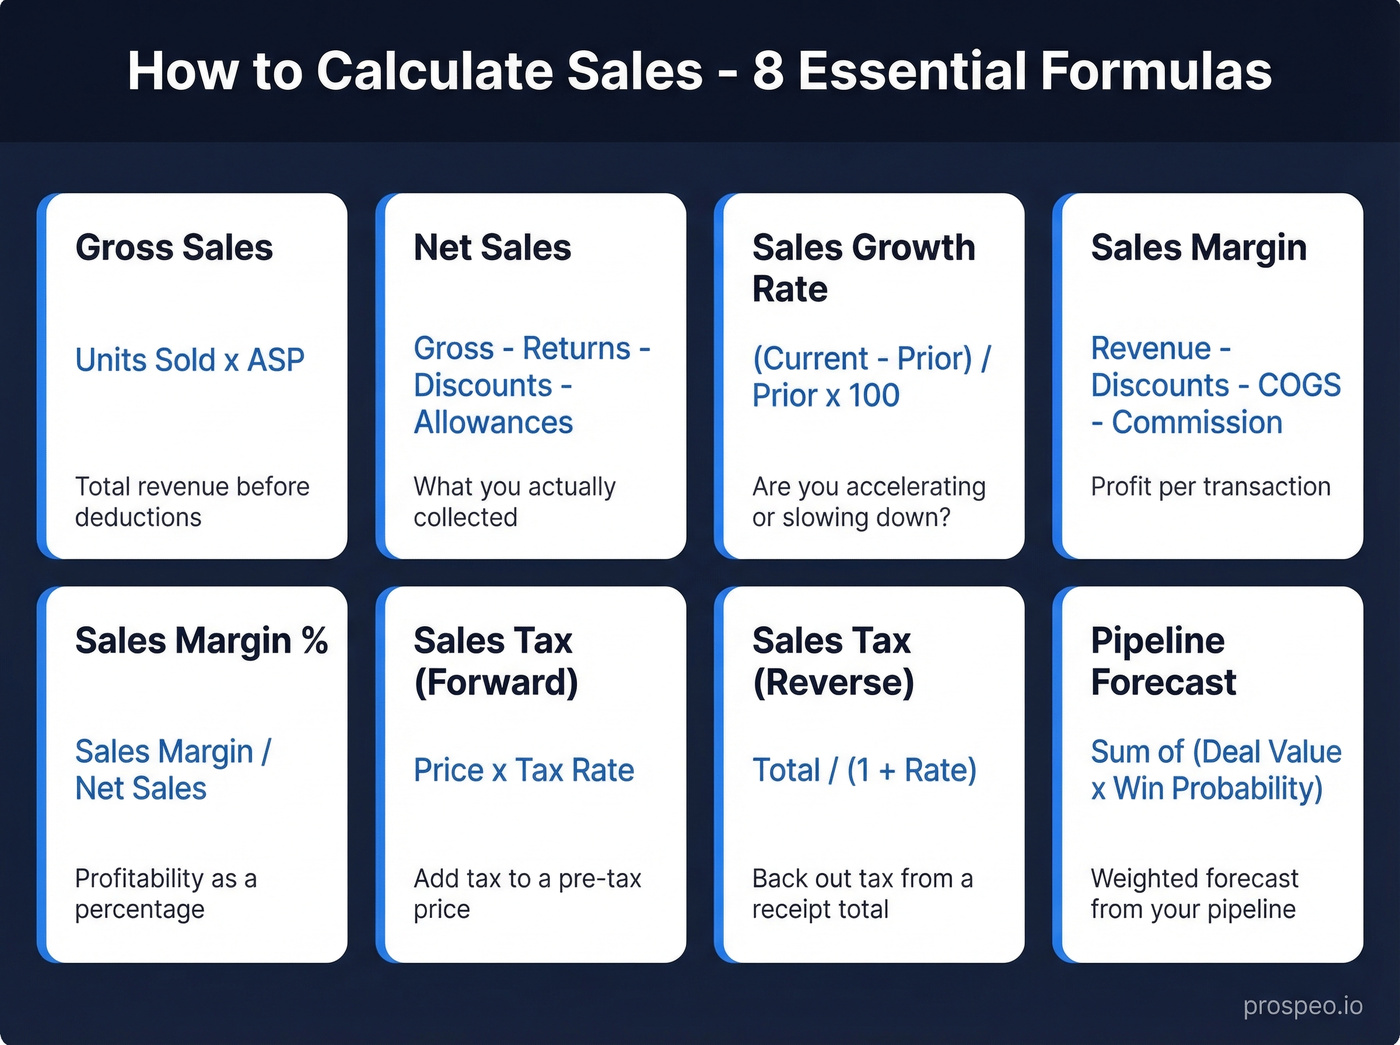
| Formula | Equation | Section |
|---|---|---|
| Gross Sales | Units Sold x ASP | Gross & Net Sales |
| Net Sales | Gross - Returns - Discounts - Allowances | Gross & Net Sales |
| Sales Growth Rate | (Current - Prior) / Prior x 100 | Growth Rate |
| Sales Margin | Revenue - Discounts - COGS - Commission | Sales Margin |
| Sales Tax (Forward) | Price x Tax Rate | Sales Tax |
| Sales Tax (Reverse) | Total / (1 + Rate) | Sales Tax |
| Pipeline Forecast | Sum of (Deal Value x Win Probability) | Forecasting |
| Run Rate | (YTD Sales / Months Elapsed) x 12 | Hit a Target |
Not sure which formula you need? Start with gross vs. net sales - that's where most confusion lives.
How to Calculate Gross and Net Sales
These two formulas are the foundation. Everything else - growth rates, margins, forecasts - builds on net sales. Get this wrong and every downstream number is off.
Gross Sales Formula
Gross Sales = Units Sold x Average Selling Price (ASP)
Gross sales captures total revenue before any deductions. It's the top-line number before reality kicks in.
Worked example:
A company sells 200,000 units at an ASP of $40.
200,000 x $40 = $8,000,000 gross sales
That's the number your sales team celebrates. It's not the number your CFO uses.
Net Sales Formula
Net Sales = Gross Sales - Returns - Discounts - Allowances
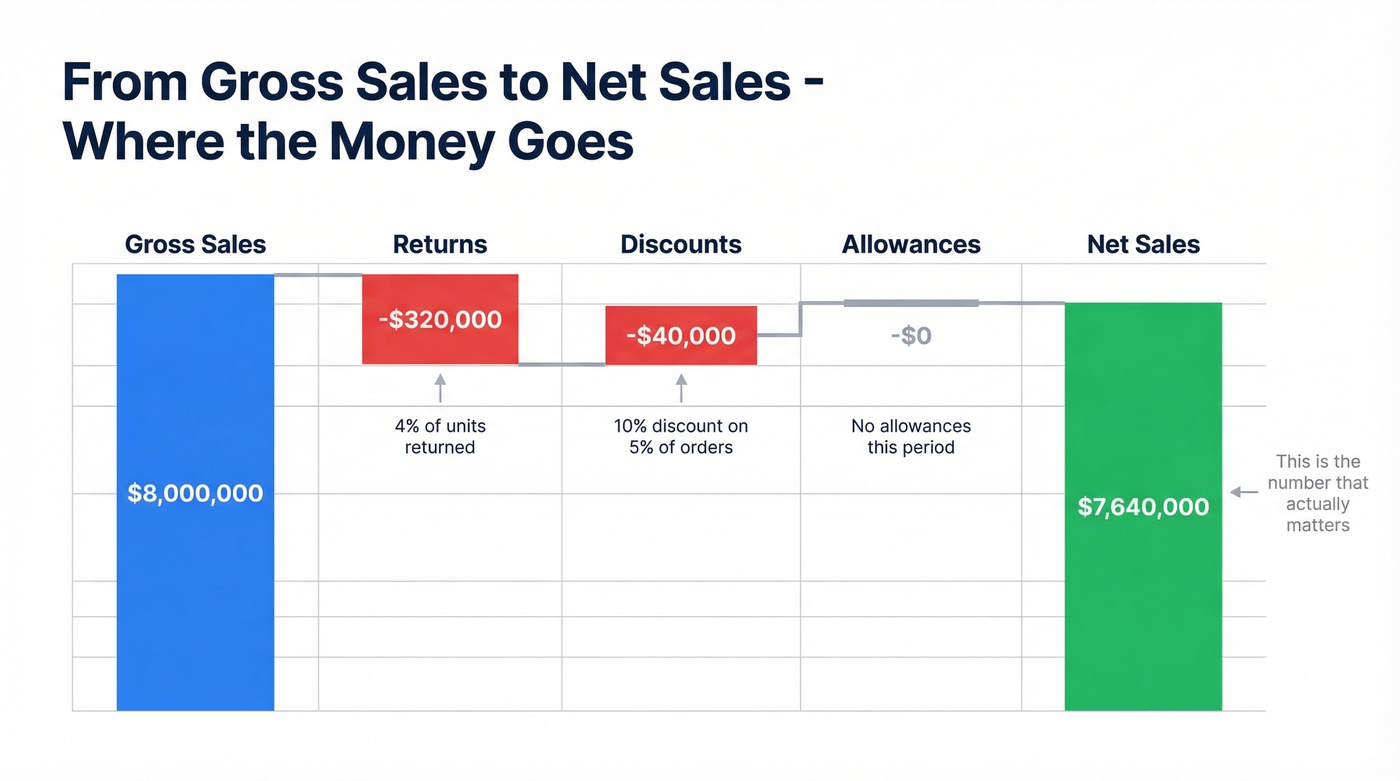
Net sales is what you actually collected. Three categories of deductions bring gross down to net:
- Returns - the customer sends the product back and gets a full reversal.
- Discounts - price reductions offered as incentives, like early payment terms, volume pricing, or promo codes.
- Allowances - post-purchase price reductions for minor defects or issues. The customer keeps the product but pays less.
Worked example (continuing from above):
- Gross sales: $8,000,000
- Discounts: 10% discount used on 5% of transactions = $40,000
- Returns: 4% of units returned = 8,000 x $40 = $320,000
- Allowances: $0
$8,000,000 - $320,000 - $40,000 - $0 = $7,640,000 net sales
Here's the thing: gross sales is a vanity metric. Net sales is what matters for every decision you'll actually make - margin analysis, growth tracking, forecasting, investor reporting. If someone asks "what were sales last quarter?" they mean net sales.
A note for subscription businesses: if you sell annual contracts, you might "sell" $120K but only "recognize" $10K per month under GAAP. That's a revenue recognition timing issue, not a sales calculation issue, but it trips people up when reconciling CRM numbers against the income statement.
Finding Net Sales on a 10-K
There's a recurring thread on r/Accounting where people ask whether "total revenues" on the income statement equals "net sales" or whether adjustments are needed.
Under GAAP, the top line of the income statement is typically presented net of returns, discounts, and allowances. It may be labeled "Net sales," "Net revenue," or simply "Revenue." The gross-to-net reconciliation - showing each deduction separately - often appears in the footnotes. If you're looking for the gross number, check the notes.
How to Calculate Sales Growth Rate
Growth rate tells you whether you're accelerating or decelerating. It's the single number your board cares about most, and the formula is dead simple.
The Formula (YoY, QoQ, MoM)
Sales Growth Rate = (Current Period Sales - Prior Period Sales) / Prior Period Sales x 100
Pick two fixed periods - same quarter year-over-year, same month, whatever - and use net sales for both.
Worked example:
H&M reported Q1 2020 net sales of approximately $9.75B and Q1 2021 net sales of approximately $10.1B (converted to USD):
($10.1B - $9.75B) / $9.75B x 100 = 3.5% YoY growth
For a more stable view, compute growth rates for each year over a multi-year window and average them. This smooths out anomalies like a pandemic quarter dragging your baseline down.
What's a "Good" Growth Rate?
It depends entirely on your stage and industry. A few benchmarks to anchor against:
For mature companies, 5% annual growth is a common rule-of-thumb target. Many large enterprises would be thrilled with consistent mid-single-digit growth.
For SaaS startups, the bar is dramatically higher. A Lighter Capital study of 155 private B2B SaaS companies, based on CY 2020-2024 data, found a median annual revenue growth rate of 28.29%, with the 75th percentile hitting 65.40%. Those numbers are down from the prior year's median of 47.25%, reflecting a broader market cooldown.
Smaller companies naturally show higher percentage growth from a smaller absolute base. Going from $500K to $750K is 50% growth - impressive on paper, but it's a $250K increment. Context matters more than the percentage alone.
Let's be honest: if your average deal is under $10K and you're growing below 30% annually, you don't have a growth problem. You have a pricing problem. Raise prices before you hire another SDR.
How to Calculate Sales Margin
Sales margin tells you how much profit each transaction generates after direct costs. It's the number that determines whether your pricing actually works.
Transaction-Level Formula
Sales Margin = Revenue - Discounts - COGS - Commission
Sales Margin % = Sales Margin / Net Sales
This is a deal-level profitability metric. In financial reporting, gross profit margin is more common and typically excludes sales commissions. Sales leaders often include commission because it's a real, direct cost of closing the deal.
Worked example:
- Revenue: $100,000
- Discount (10%): $10,000
- Labor/COGS: $65,000
- Commission (2%): $2,000
$100,000 - $10,000 - $65,000 - $2,000 = $23,000 margin (23%)
Sales margin excludes overhead like rent, admin, and R&D. For full profitability, you need net profit margin.
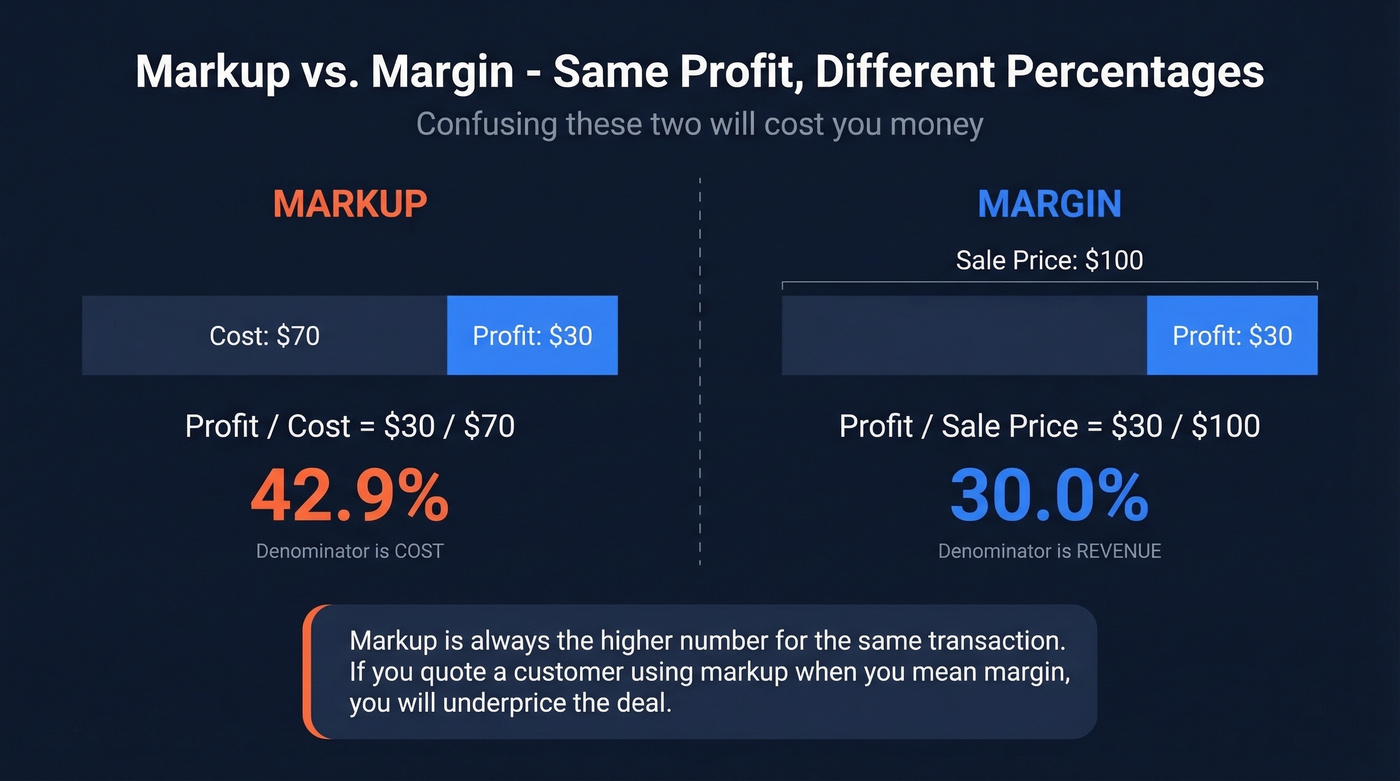
Markup vs. Margin
This trips people up constantly. Markup and margin use the same dollar amount of profit but different denominators. On a $30 profit from a $70 cost, markup is $30 / $70 = 42.9%, while margin is $30 / $100 = 30%. Markup is always the higher number for the same transaction. If you're quoting a customer and confuse the two, you'll either leave money on the table or price yourself out of the deal.
Industry Benchmarks
Margins vary wildly by industry. According to NYU Stern data compiled by Vena:
- Average gross profit margin: 36.56%
- Average net profit margin: 8.54%
The extremes are striking. Money-center banks run 100% gross margins because their "product" is money, while auto and truck manufacturers sit at 12.45% gross. Real estate development averages -16.35% net margin, meaning the average developer is losing money after all costs.
If your sales margin is below your industry's gross average, either your pricing is too low, your COGS are too high, or you're discounting too aggressively. Start there before optimizing anything else.
Your sales growth formula only works if the pipeline behind it is full. Prospeo gives you 300M+ verified contacts with 98% email accuracy so every rep has real buyers to call - not dead leads inflating your gross numbers.
Stop calculating growth on a shrinking pipeline. Fill it first.
How to Calculate Sales Tax
Sales tax math is simple. Sales tax compliance is not. Let's handle the math.
Forward Calculation
Sales Tax = Item Price x Tax Rate
Total = Item Price + Sales Tax
Convert the percentage to a decimal first (7% becomes 0.07), then multiply.
A $100 item in a jurisdiction with a combined 7% rate covering state and local taxes:
$100 x 0.07 = $7.00 tax $100 + $7.00 = $107.00 total
The "combined rate" part matters. Most jurisdictions layer state, county, and city taxes. A customer in one zip code pays 6.5% while someone ten miles away pays 8.25%. Multi-state sellers need to track rates per location, and rates change regularly.
Alaska, Delaware, and New Hampshire don't charge state-level sales tax. But local taxes can still apply, so "no state sales tax" doesn't always mean "no sales tax."
Reverse Calculation
When you have a tax-inclusive total and need to back out the pre-tax price:
Pre-Tax Price = Total / (1 + Tax Rate)
Tax Amount = Total - Pre-Tax Price
Your receipt shows $107.00 total in a 7% tax jurisdiction:
$107.00 / 1.07 = $100.00 pre-tax $107.00 - $100.00 = $7.00 tax
A common mistake is multiplying the total by the tax rate ($107 x 0.07 = $7.49). That gives you the wrong number because you're applying the rate to the tax-inclusive amount. Always divide first.
How to Forecast Sales
Forecasting is where sales calculation shifts from backward-looking accounting to forward-looking strategy. Three methods, each suited to different situations.
Historical Projection
Forecast = Previous Period Sales x (1 + Expected Growth Rate)
The simplest approach. Take last quarter's number, apply your expected growth rate, done.
Last quarter: $200,000 in sales. Expected growth: 5%.
$200,000 x 1.05 = $210,000 forecast
This works for stable, predictable businesses. It falls apart when market conditions shift or when you're launching new products. Use it as a sanity check, not as your primary forecast.
Pipeline-Weighted Forecast
Forecast = Sum of (Deal Value x Win Probability)
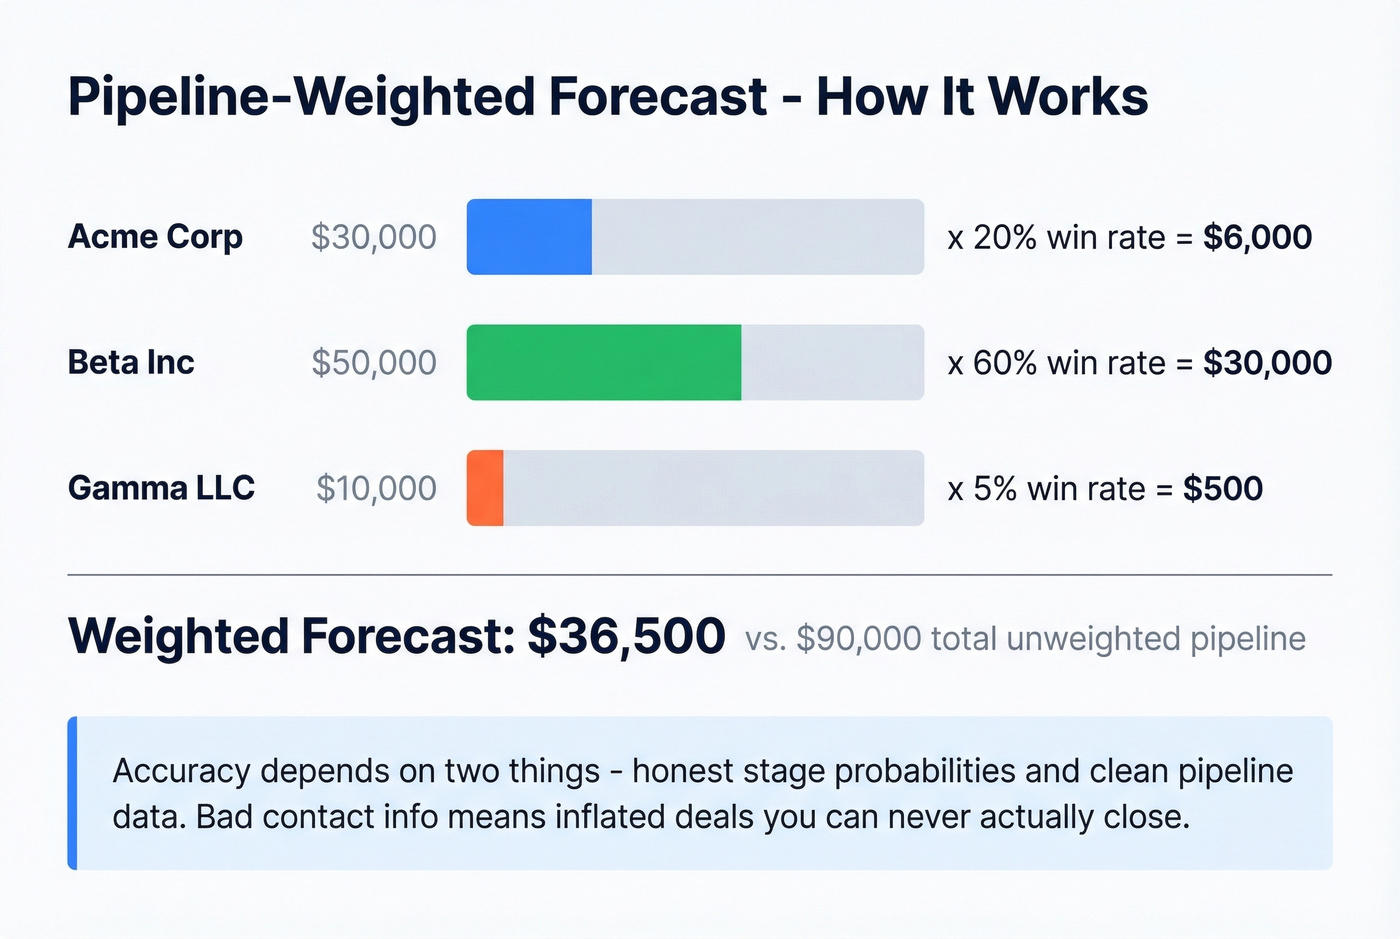
This is the most accurate method for B2B teams because it's grounded in your actual pipeline, not historical averages.
| Deal | Value | Win Probability | Weighted |
|---|---|---|---|
| Acme Corp | $30,000 | 20% | $6,000 |
| Beta Inc | $50,000 | 60% | $30,000 |
| Gamma LLC | $10,000 | 5% | $500 |
| Total | $36,500 |
The accuracy of this method lives or dies on two things: honest stage-probability assignments and clean pipeline data. If your contact data is full of bad emails, your pipeline gets inflated with opportunities you can't actually reach - and your forecast becomes fiction.
Sales-Cycle-Length Forecast
Skip this one if your deal cycles vary wildly. If some close in 2 weeks and others drag for 6 months, the average is meaningless.
Monthly Forecast = Total Pipeline Value / Average Sales Cycle Length (months)
Total qualified pipeline: $800,000. Average sales cycle: 4 months.
$800,000 / 4 = $200,000/month expected revenue
For teams with consistent cycles, this is a useful complement to the pipeline-weighted approach. Use both and compare. If the numbers diverge significantly, your win probabilities or cycle-length assumptions need recalibrating.
How to Calculate Sales Targets
Your CFO asks for a forecast by Friday. Your VP of Sales wants to know how many deals you need this quarter. These formulas bridge the gap between targets and action.
Sales Run Rate
Run Rate = (YTD Sales / Months Elapsed) x 12
Run rate projects your current pace to a full-year number. It's the quickest way to answer "are we on track?"
There's a real scenario from r/learnmath that captures this well: last year's sales were ~$122K, and current YTD through July was ~$71K.
$71,000 / 7 x 12 = $121,714 projected annual sales
That's 99.8% of last year's total - essentially flat. If the target is growth, the team knows by July they need to accelerate. Run rate is a blunt instrument, but it's the fastest way to spot trouble.
Break-Even with Multiple Products
This comes up constantly on r/excel - "I sell three products at different prices. How many do I need to sell to hit my profit goal?"
The naive approach is averaging prices. Don't do that. It only works if you sell equal quantities of each product, which almost never happens. Instead, use a weighted contribution margin approach:
- Calculate contribution margin per product (price minus variable cost)
- Estimate your product mix as a percentage of total units
- Compute weighted average contribution margin
- Divide your profit target by the weighted margin
| Product | Price | Variable Cost | Margin | Mix % | Weighted |
|---|---|---|---|---|---|
| Basic | $50 | $20 | $30 | 60% | $18.00 |
| Pro | $120 | $45 | $75 | 30% | $22.50 |
| Enterprise | $300 | $100 | $200 | 10% | $20.00 |
| Weighted Avg | $60.50 |
Profit target: $100,000 after fixed costs.
$100,000 / $60.50 = 1,653 total units needed
For complex product-mix scenarios with constraints like minimum order quantities or capacity limits, Excel's Solver add-in handles the optimization. Set your profit target as the objective, your unit quantities as variables, and your constraints as limits.
From Revenue Target to Prospects
Here's where the math gets actionable. You need a specific number of new customers, but how many prospects is that?
Prospects Needed = Target Deals / Close Rate
- Revenue target: $500,000
- Average deal size: $10,000
- Deals needed: 50
- Close rate: 10%
50 / 0.10 = 500 qualified prospects needed
That's 500 people you need verified contact data for - not 500 names in a spreadsheet with bounced emails. Once you know the number, the bottleneck shifts to building that list fast and accurately. We've seen teams at this stage waste weeks manually hunting for emails when tools like Prospeo's B2B database can build a verified list of 500 prospects in minutes using 30+ filters like job title, industry, and buyer intent.
Sales Formulas in Excel
Every formula above translates directly into a spreadsheet. Here are copy-paste-ready formulas for Excel and Google Sheets.
| Calculation | Excel Formula | Example |
|---|---|---|
| Line-item revenue | =A2*B2 |
Units x Price |
| Total revenue | =SUM(C2:C50) |
Sum revenue column |
| Net sales | =B2-C2-D2-E2 |
Gross - Returns - Disc - Allow |
| Growth rate (%) | =(B2-B1)/B1*100 |
Current vs. prior period |
| Sales margin ($) | =B2-C2-D2-E2-F2 |
Revenue - Disc/Allow - COGS - Commission |
| Sales margin (%) | =(B2-C2-D2-E2-F2)/(B2-C2-D2-E2) |
Margin / Net sales |
| Sales tax | =A2*B2 |
Price x Rate |
| Reverse tax | =A2/(1+B2) |
Total / (1 + Rate) |
| Run rate | =(B2/C2)*12 |
YTD / Months x 12 |
| Pipeline forecast | =SUMPRODUCT(B2:B10,C2:C10) |
Values x Probabilities |
| Avg revenue/unit | =B2/B3 |
Total revenue / Units sold |
| Quarterly growth | =(D3-D2)/ABS(D2)*100 |
Handles negative priors |
A few tips that save time: use named ranges instead of cell references for complex models - it makes formulas readable six months later. The ABS() wrapper in the quarterly growth formula handles negative prior periods without breaking. And if you're building a sales analysis dashboard, pivot tables are your best friend for slicing revenue by product, region, or rep. To find the percentage of sales for a specific product line or channel, a simple =product_revenue/total_revenue formula in a pivot table gives you that breakdown instantly.
All of these work identically in Google Sheets. No syntax changes needed.
Margins collapse when reps waste hours chasing bad data. Prospeo delivers verified emails at $0.01 each and 125M+ direct dials with a 30% pickup rate - so your cost-per-meeting drops and sales margin actually improves.
Better data means better margins. Teams book 26% more meetings with Prospeo.
FAQ
What's the difference between sales and revenue?
"Sales" refers specifically to income from product or service transactions, while "revenue" is broader - it includes sales plus other income like interest, royalties, and licensing fees. For most sales teams, the distinction doesn't matter day-to-day. On income statements, the terms are often used interchangeably.
Should I use gross or net sales for analysis?
Net sales. Always. It reflects what you actually collected after returns, discounts, and allowances. Gross sales overstates your real top line and distorts every ratio you derive from it - margins, growth rates, efficiency metrics. Use gross only when analyzing discount or return rates specifically.
How do I calculate growth with a negative prior period?
Use absolute values in the denominator: (Current - Prior) / ABS(Prior). The standard formula breaks because dividing by a negative flips the sign - a 20% improvement from -$100K to -$80K would misleadingly show as -20%. For periods with losses, dollar-change reporting is often clearer than percentages.
What tools help automate these calculations?
Excel and Google Sheets handle every formula in this article. For pipeline forecasting at scale, CRM reporting in HubSpot or Salesforce automates the pipeline-weighted method. For building the prospect lists that feed your pipeline, Prospeo covers 300M+ profiles with 98% verified email accuracy and 30+ search filters, with a free tier of 75 emails per month.
How often should I recalculate forecasts?
Monthly at minimum for historical projections and margin tracking. For pipeline-weighted forecasts in high-velocity sales environments, weekly recalculation catches deals that stall or accelerate before the month-end surprise. The faster your sales cycle, the more frequently you should update.