How to Improve Sales Forecasting Accuracy
It's Monday morning. The forecast call starts in ten minutes, and three "committed" deals just pushed to next month - again. You're not alone. Four in five sales and finance leaders missed a quarterly forecast in the past year. Only 7% of sales organizations achieve forecast accuracy at or above 90%. And 69% of sales ops leaders say forecasting is getting harder, not easier.
Most forecasting problems are data problems, not model problems. Fix three things - your data quality, your review cadence, and your method - and accuracy can jump 10-15 points.
What "Accurate" Actually Means
The median sales org lands in the 70-79% accuracy range. That often translates to being off by roughly 20-30% every quarter. Here's how to frame your own number:
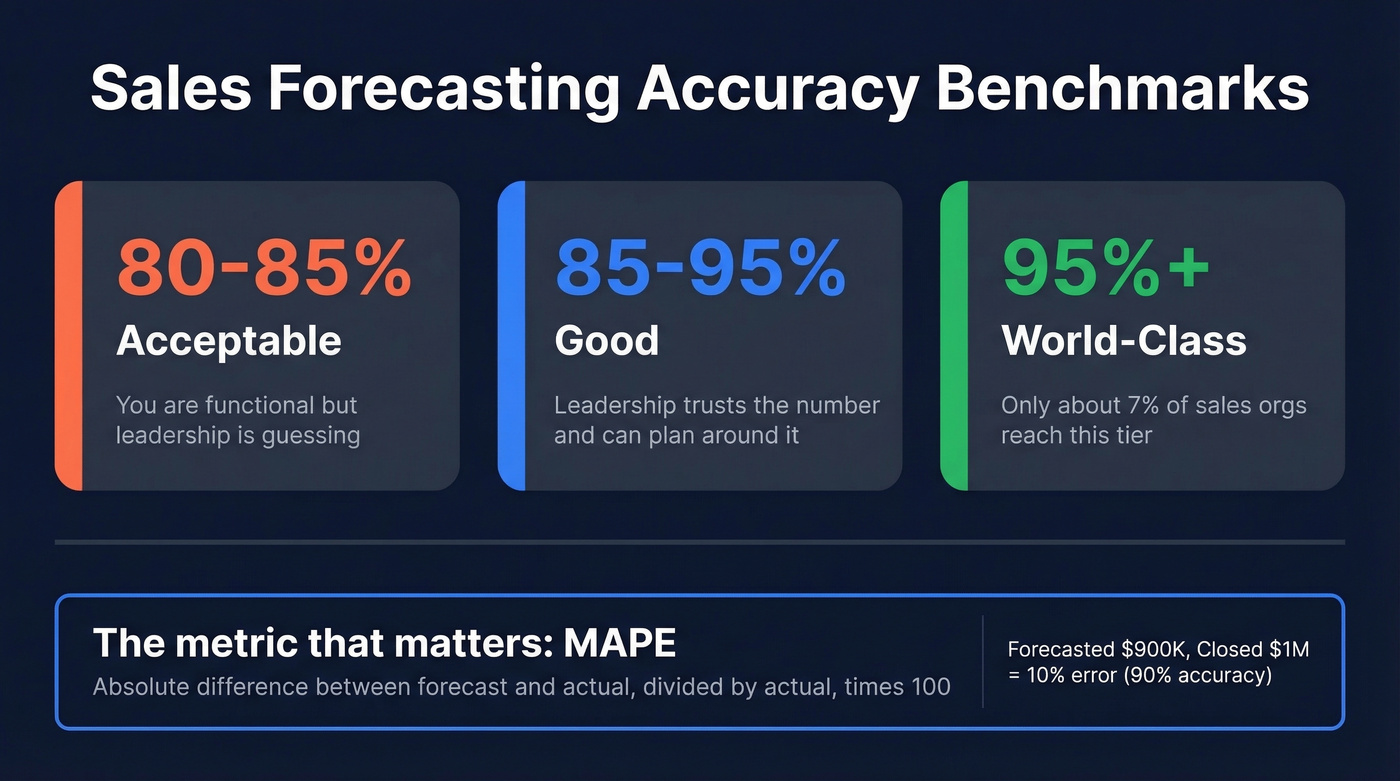
| Tier | Accuracy Range | What It Means |
|---|---|---|
| Acceptable | 80-85% | You're functional |
| Good | 85-95% | Leadership trusts the number |
| World-class | 95%+ | Only ~7% of orgs get here |
SMB transactional teams with short cycles typically hit 85%+ more easily than enterprise teams running 6-month deals, so adjust your benchmark accordingly.
The metric that matters most is MAPE - mean absolute percentage error. Take the absolute difference between forecast and actual, divide by actual, multiply by 100. Forecasted $900K and closed $1M? That's 10% error, or 90% accuracy. Track it quarterly.
One distinction worth internalizing: forecast error tells you how far off you were, while forecast bias tells you whether you consistently over- or under-predict. Bias is the one that reveals whether your team sandbags or wears rose-colored glasses.
Why Your Forecast Is Wrong
These five failure modes account for the vast majority of forecast misses.
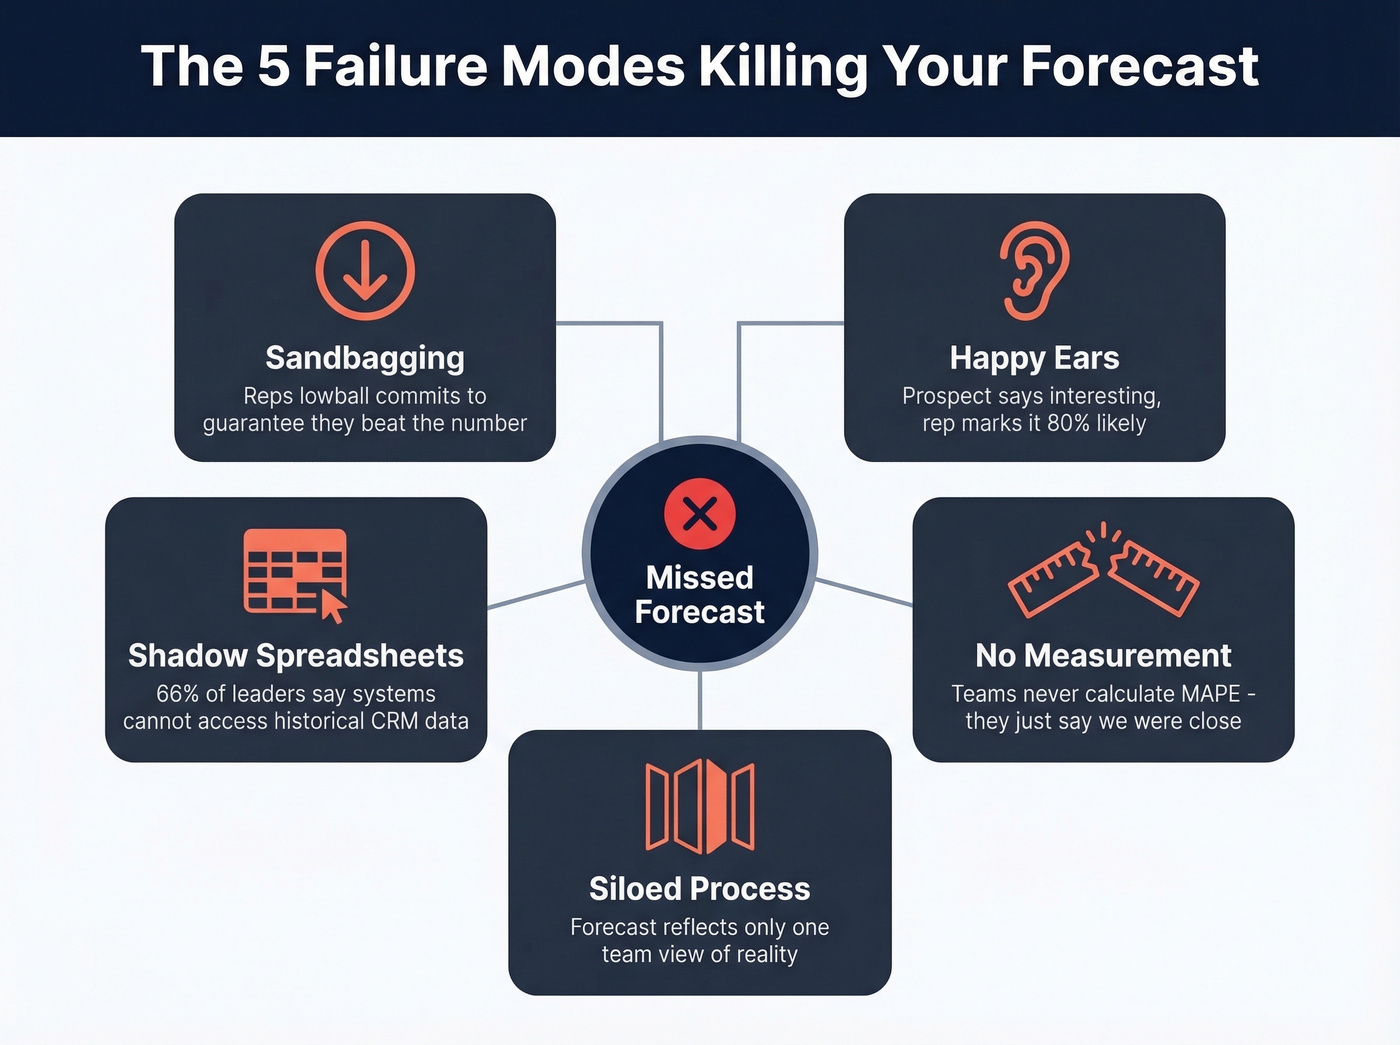
Sandbagging. Reps lowball commits to guarantee they "beat" the number. If your team consistently over-delivers by 15-20%, you don't have great sellers - you have a sandbagging culture. That's a leadership problem, not a forecasting one.
Happy ears. A prospect says "this looks interesting" and the rep marks it 80% likely to close. The consensus on r/sales is brutal about this - committed deals getting bumped month after month because someone heard what they wanted to hear. We've all been there.
Stale CRM data and shadow spreadsheets. When reps don't trust the system, they build their own spreadsheets. Now you've got two sources of truth, neither of which is actually true. 66% of leaders say their reporting systems can't even access historical CRM data.
No measurement discipline. Most teams never calculate MAPE. They talk about forecasting in qualitative terms - "we were close" or "we missed" - without quantifying how far off they were. You can't fix what you don't measure.
Siloed process. When forecasting lives exclusively in sales, it ignores marketing pipeline contribution, finance's capacity models, and CS expansion signals. 79% of sales organizations miss their forecast by more than 10%, and a big reason is that the forecast reflects only one team's view of reality.
Pick the Right Method
Your method should match your data maturity, deal volume, and sales cycle length.
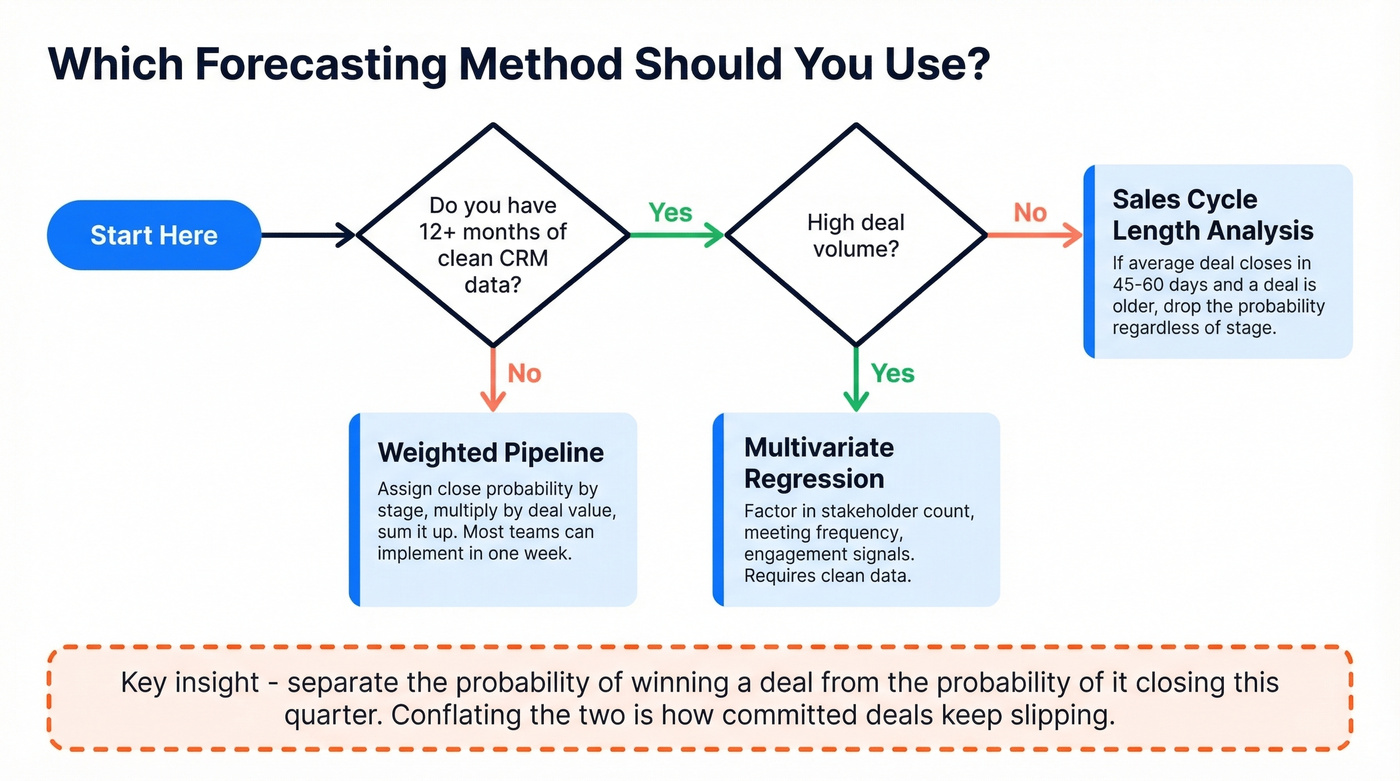
| If your situation is... | Use this method |
|---|---|
| Less than 12 months of clean CRM data | Weighted pipeline |
| 12+ months of clean data, high deal volume | Multivariate regression |
| Predictable sales cycle, lower volume | Sales cycle length analysis |
Weighted pipeline is the right starting point for most B2B teams. Assign close probabilities by stage, multiply by deal value, sum it up. It's not perfect - stagnating deals inflate the number - but it's transparent and improvable. Most teams can implement it in a week.
Multivariate regression factors in variables like stakeholder count, meeting frequency, and engagement signals. Real talk: most teams aren't ready for this, and that's fine. If your CRM data isn't clean enough for weighted pipeline to work, regression won't save you.
Sales cycle length analysis is underrated. If your average deal closes in roughly 45-60 days and a deal has been open longer than that, the probability should drop - regardless of what stage it's in.
Here's the nuance most teams miss: distinguish between the probability of winning a deal and the probability of it closing this month. A deal can be 90% likely to close but only 30% likely to close in Q1. Conflating the two is exactly how "committed" deals keep slipping quarter after quarter, and separating these two probabilities in every review is what separates functional forecasts from fiction.
Rep-submitted gut-feel forecasting? Dead last. Skip it entirely if you can.
Your forecast is only as good as the pipeline feeding it. When half your contacts have wrong titles or dead emails, every stage probability is a fiction. Prospeo's 98% verified emails and 7-day data refresh mean the pipeline you're forecasting against reflects reality - not stale CRM records and shadow spreadsheets.
Stop forecasting on bad data. Start with contacts that are actually real.
Six Tactics That Move the Needle
1. Weekly review cadence with variance tracking. Monthly reviews are too slow. By the time you spot a miss, the quarter's half over. In our experience, teams that switch to weekly reviews often see accuracy jump 10-15 points within a single quarter. Flag any deal whose forecast value changed by more than 20% since last week.
2. Close-date discipline and deal aging rules. If a deal's close date has pushed three times, it's not committed - it's a hope. Set automatic rules: any deal that pushes past its original close date by more than 30 days gets downgraded one stage. No exceptions, no override without manager approval.
3. Cross-functional alignment. 97% of leaders say sales and finance need to collaborate better on forecasting. Get sales, finance, and marketing in the same room weekly. None of them has the full picture alone, and the forecast shouldn't pretend otherwise.
4. Stage-exit criteria. Define what it takes to leave a stage - a signed security review, a confirmed budget holder, a scheduled technical evaluation - and don't let deals advance without meeting the criteria. This single change eliminates the "happy ears" problem at its root.
5. Conversation intelligence as a leading indicator. Call recordings and email sentiment are leading indicators that CRM fields can't capture. One RevOps leader reduced their margin of error from roughly 15% to 5% by changing how they scored and analyzed calls. If you're not using call data yet, start here.
6. Scenario planning with three tracks. Run best-case, realistic, and downside scenarios every quarter. If your realistic forecast is $2M, best case might be $2.4M and downside $1.6M. Leadership doesn't want a single number. They want a range they can plan around.
Fix Your Data Before Your Model
Let's be honest about something: most teams obsess over forecasting methods when their real problem is upstream. We've seen SDR teams book 40 meetings in a month where half the contacts had wrong titles or dead email addresses. Those "meetings" inflate pipeline, which inflates the forecast, which inflates the miss. No methodology overhaul will overcome garbage inputs.
Bad contact data - wrong titles, unverified emails, stale records - poisons every model you build on top of it. Prospeo addresses this at the source with 98% email accuracy and a 7-day data refresh cycle versus the six-week industry average. If your CRM contacts are decaying and your pipeline probabilities are built on fiction, cleaning the data is step zero.

Your 30/60/90-Day Plan
Days 1-30: Calculate your current MAPE using last quarter's data. Audit CRM data quality - how many contacts have verified emails and accurate titles? Clean stale records and enrich the gaps. This is the foundation everything else depends on. If you need a template, borrow a 30/60/90-day plan structure and adapt it for RevOps.
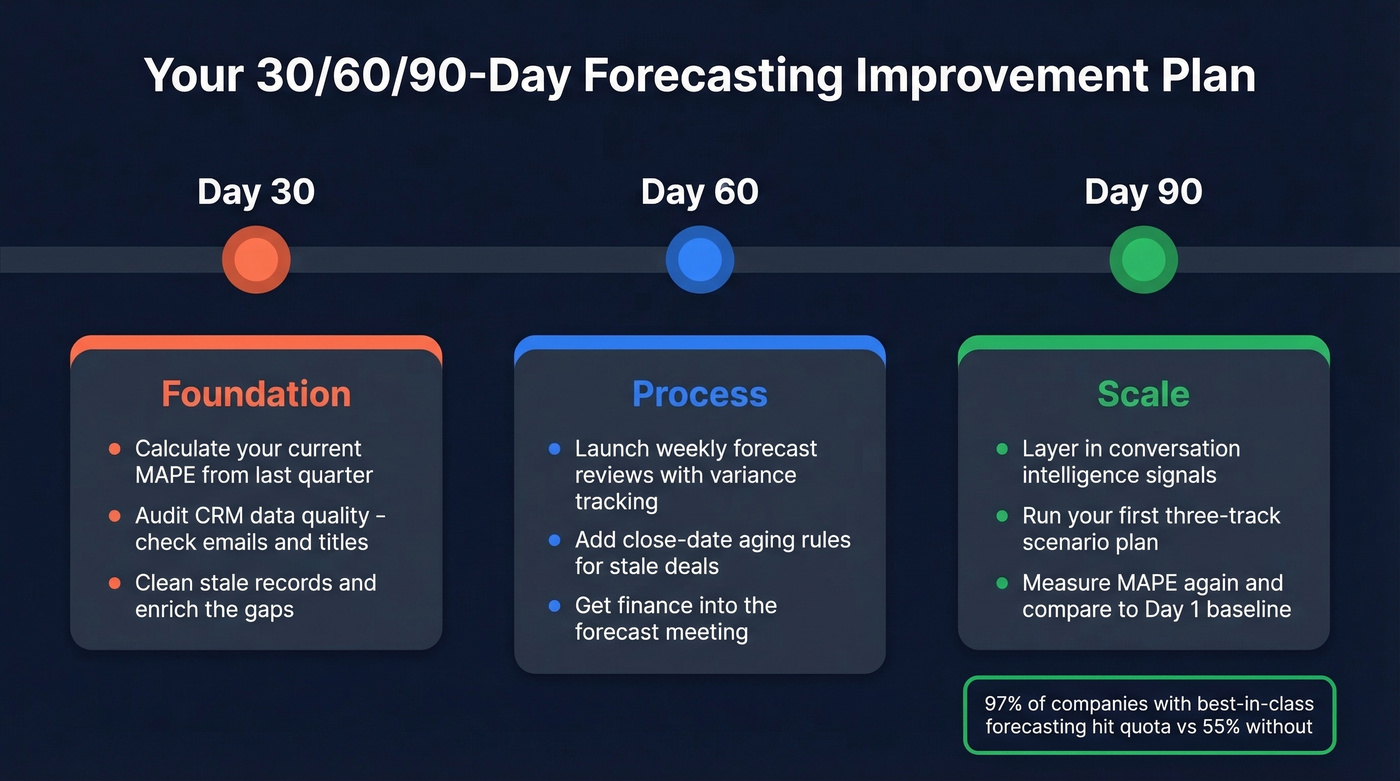
Days 31-60: Implement weekly forecast reviews with variance tracking. Add close-date aging rules. Get finance into the forecast meeting. You'll feel the difference almost immediately.
Days 61-90: Layer in conversation intelligence signals. Run your first three-track scenario plan. Measure MAPE again and compare to your Day 1 baseline. 97% of companies implementing best-in-class forecasting processes achieve their quotas, compared to 55% without them. That gap is your opportunity.
Stale CRM data is one of the five forecast killers - and 66% of leaders can't even access their historical data properly. Prospeo's CRM enrichment returns 50+ data points per contact at a 92% match rate, so your deal stages, titles, and contact info stay current on a 7-day refresh cycle. Accurate forecasts start with accurate records.
Enrich your CRM now and watch your forecast accuracy climb.
FAQ
What's a good forecast accuracy percentage?
85-95% is the target for most B2B teams - leadership can plan hiring, spend, and capacity around it. Below 80%, prioritize data quality and weekly reviews before changing methodology. Above 95% is world-class, reached by roughly 7% of organizations.
How do you calculate MAPE for sales forecasting?
Take the absolute difference between your forecasted revenue and actual closed revenue, divide by actual, and multiply by 100. A $900K forecast against $1M actual equals 10% error, or 90% accuracy. Track it quarterly and compare period-over-period to measure progress.
Can bad contact data affect forecast accuracy?
It's the most overlooked root cause. If pipeline contacts have outdated titles or unverified emails, your deal-stage probabilities are built on fiction. CRM enrichment that returns 50+ verified data points per contact at a 92% match rate gives your pipeline the clean foundation accurate forecasts require.
How long does it take to see measurable improvement?
Most teams see gains within 60-90 days. The biggest early wins come from cleaning CRM data and switching to weekly reviews - those two changes alone can improve results by 10-15 percentage points before you touch your methodology or add AI tools.