How to Track Sales: The Operational Playbook for 2026
It's Friday afternoon. You're pretty sure you had a strong week - lots of calls, a few good demos, one deal that felt close. But when your VP asks which deals are closing this month, you stare at your screen and realize you can't answer with any confidence.
You're not alone. 84% of sales reps missed quota last year, and a big chunk of that failure traces back to the same root cause: nobody's tracking the right things, in the right way, at the right cadence. Learning how to track sales isn't about buying software. It's about building a system that tells you what's real and what's fiction in your pipeline.
The Three Things to Do This Week
If you implement nothing else from this article, do these three things:
- Build a follow-up system around "Next Actions" - not reminders you'll snooze, but a color-coded queue of what happens next on every deal.
- Define a single pipeline with exit criteria for each stage. If a deal can sit in "Qualified" forever with no definition of what qualified means, your pipeline is fiction.
- Create a dashboard with 8-12 reports and review it weekly. Not 25 reports. Not monthly. Weekly, with the same views, on a fixed cadence.
That's it. Everything below is the how.
What Sales Tracking Actually Means
Sloppy language leads to sloppy systems. Sales metrics describe what's happening - calls made, emails sent, deals in pipeline. KPIs measure performance against a specific business goal. Every KPI is a metric, but not every metric is a KPI. "Emails sent" is a metric. "Emails sent vs. the 150/week target that correlates with quota attainment" is a KPI.
Then there's the leading vs. lagging distinction. Leading indicators are things you can control today - call volume, meetings booked, follow-ups completed. Lagging indicators are outcomes - win rate, deal cycle time, revenue. You need both, but most teams over-index on lagging indicators and then wonder why they can't course-correct mid-quarter.
Who sees what matters too. A rep needs activity metrics and deal-level next steps. A manager needs pipeline coverage and stage conversion rates. An exec needs forecast accuracy and revenue velocity. Same data, different views. Understanding what sales tracking means at each level prevents the common mistake of building one dashboard and expecting it to serve everyone.
Pick Your Tracking System
The right system depends on your team size and deal complexity, not on which vendor has the best marketing.
| Criteria | Spreadsheet | CRM | Hybrid |
|---|---|---|---|
| Best for | Solo / <$50K pipeline | 2+ reps / multi-stage | Analysis + pipeline |
| Cost | Free | $15-50/user/mo | Free + CRM cost |
| Follow-ups | Manual (Next Actions) | Built-in tasks | CRM tasks |
| Reporting | Basic charts | Dashboards + automation | CRM + custom models |
| Breaks when... | >1 rep touches deals | Reps don't log | Spreadsheet goes stale |
Spreadsheet (Solo or Early Stage)
A Google Sheets template with a Next Actions follow-up system, color-coded due dates, and six pre-built reports is genuinely all you need if you're a solo seller with a straightforward sales cycle. OnePageCRM publishes a free template that nails this - date formulas auto-flag overdue tasks in red, today's tasks in orange, and future tasks in grey.
The catch: it doesn't scale past one rep. Version control becomes a nightmare, and you lose all visibility the moment someone forgets to update a row.
CRM (Multiple Reps or Multi-Step Deals)
Industry surveys put CRM adoption at 87% for sales tracking. If you've got more than one rep or deals with multiple stages, you need one.
HubSpot CRM is the easiest on-ramp - the free tier is legitimately useful, Starter runs $20/mo, and Professional jumps to $500/mo for automation and custom reporting. Zoho CRM earned PCMag's "Best Overall" pick for deep customization and AI features, with paid plans in the $15-$50/user/mo range. monday CRM offers a free option for two users, with paid tiers from $12-$28/seat/mo - solid for teams that want visual pipeline boards.
One Salesforce-specific caveat: Einstein Activity Capture reflects activity rather than storing it as usable CRM records, which creates reporting gaps that are surprisingly hard to diagnose. We've seen teams spend weeks troubleshooting dashboards before realizing the data simply isn't where they think it is.
Hybrid (Spreadsheet + CRM)
Use the CRM for pipeline management and the spreadsheet for ad-hoc analysis - sales forecast models, what-if scenarios, board-level summaries. This is how most mature revenue operations teams actually work, and it's the setup we'd recommend for any team past the five-rep mark.
Set Up Your Pipeline
A pipeline without exit criteria is just a list of company names.
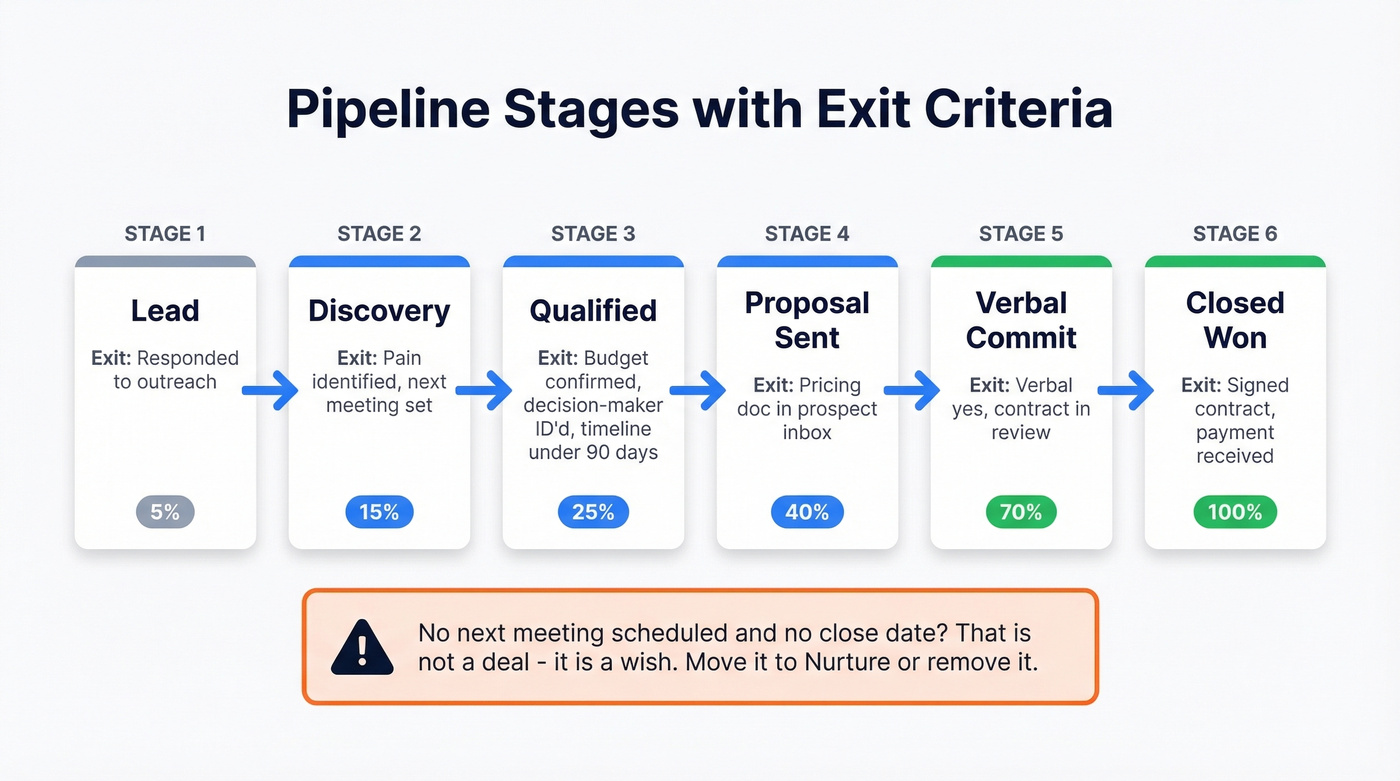
Every stage needs a clear definition of what qualifies a deal to be there and what moves it forward. "Qualified" means budget confirmed, decision-maker identified, and timeline under 90 days. If any of those three are missing, the deal stays in Discovery. "Proposal Sent" means the prospect has a document with pricing in their inbox - not that you mentioned pricing on a call.
Weight your stages by historical close probability. If 40% of deals that reach "Verbal Commit" actually close, weight that stage at 40%. This gives you a weighted pipeline value that's dramatically more accurate than summing raw deal amounts.
Here's the thing: if a deal has no next meeting scheduled and no close date, it's not a deal. It's a wish. Remove it or move it to a nurture stage. Your sales forecast will thank you.
Build a Follow-Up System
Most follow-up systems fail because they're built on reminders that are easy to ignore. The fix is a "Next Actions" methodology - every deal has exactly one next action with a due date, and those actions are visible in a single queue sorted by urgency.
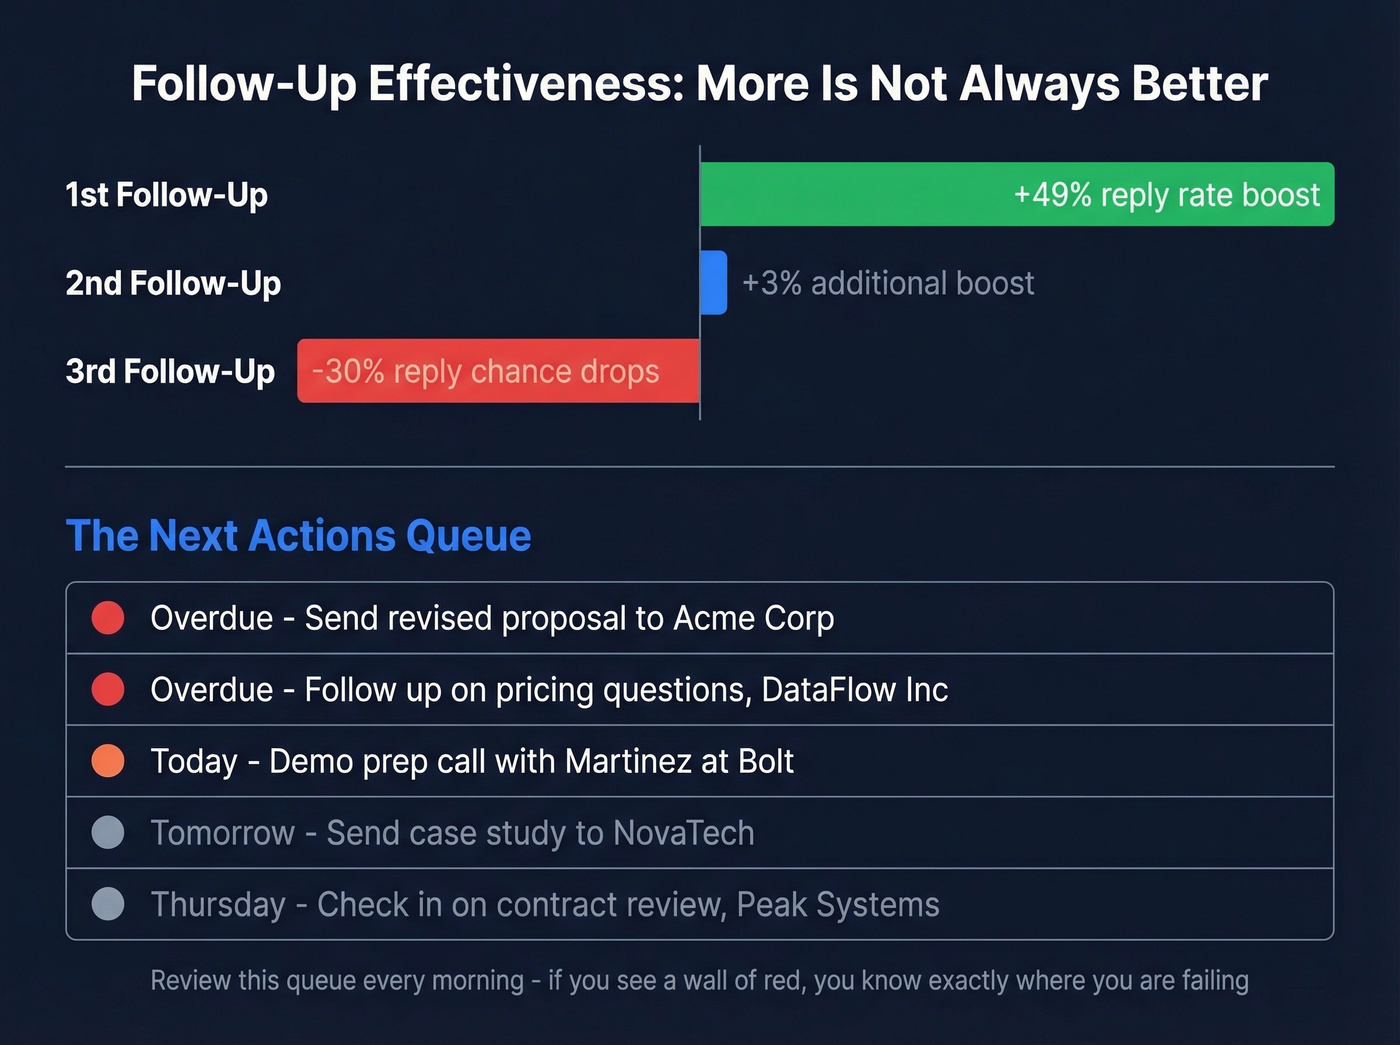
Color-coding makes this work at a glance: red for overdue, orange for due today, grey for future. If you open your queue and see a wall of red, you know exactly where you're failing.
The data backs this up. Most B2B deals require 5-12 touchpoints before closing, but not all touchpoints are equal. A first follow-up email boosts reply rates by 49%. A second adds just 3%. A third actually decreases your reply chance by 30%. The system isn't about more follow-ups - it's about timely, well-placed ones.
Skip this approach if you think setting a calendar reminder counts as a follow-up system. It doesn't. In CRMs, follow-up reminders can be surprisingly easy to lose in the noise if you don't have a single "next actions" queue you review every morning.
You can't track sales effectively when half your pipeline is built on bad contact data. Prospeo gives you 98% verified emails and 125M+ direct dials so every deal in your CRM connects to a real buyer - not a dead inbox.
Fix your pipeline data before you build dashboards on top of it.
KPIs That Actually Matter
You don't need 20 metrics. You need 6-10 that you review on a fixed cadence, with definitions locked so everyone's measuring the same thing.
Here's a benchmark matrix to calibrate against:
| KPI | Type | Weekly Benchmark | Why It Matters |
|---|---|---|---|
| Calls made | Leading | 80-120 | Pipeline generation |
| Emails sent | Leading | 100-150 | Top-of-funnel activity |
| Meetings booked | Leading | 8-12 | Qualified pipeline |
| Follow-ups done | Leading | 15-25 | Deal progression |
| Inbound response time | Leading | <15 min | 50% of sales go to first responder |
| CRM notes updated | Leading | 90% of active pipeline | Data hygiene + forecast accuracy |
| Win rate | Lagging | 20-35% | Closing effectiveness |
| Deal cycle time | Lagging | 30-45 days | Velocity + forecasting |
| Meeting-to-opp | Lagging | 30-40% | Qualification quality |
Let's be honest: if your average deal size is under $10K, you probably don't need a 15-metric dashboard or an enterprise CRM. A spreadsheet with five leading indicators and a weekly review will outperform a bloated Salesforce instance that nobody updates. The best tracking system is the one your team actually uses.
Review leading indicators through weekly performance check-ins - same day, same time, same dashboard. Review lagging indicators monthly. Forecast accuracy and revenue velocity belong in quarterly executive reviews. Match the cadence to the decision-maker.
Dashboards People Actually Use
Dashboards fail for one reason: teams add too many reports. A dashboard with 25 charts is a screensaver, not a management tool.
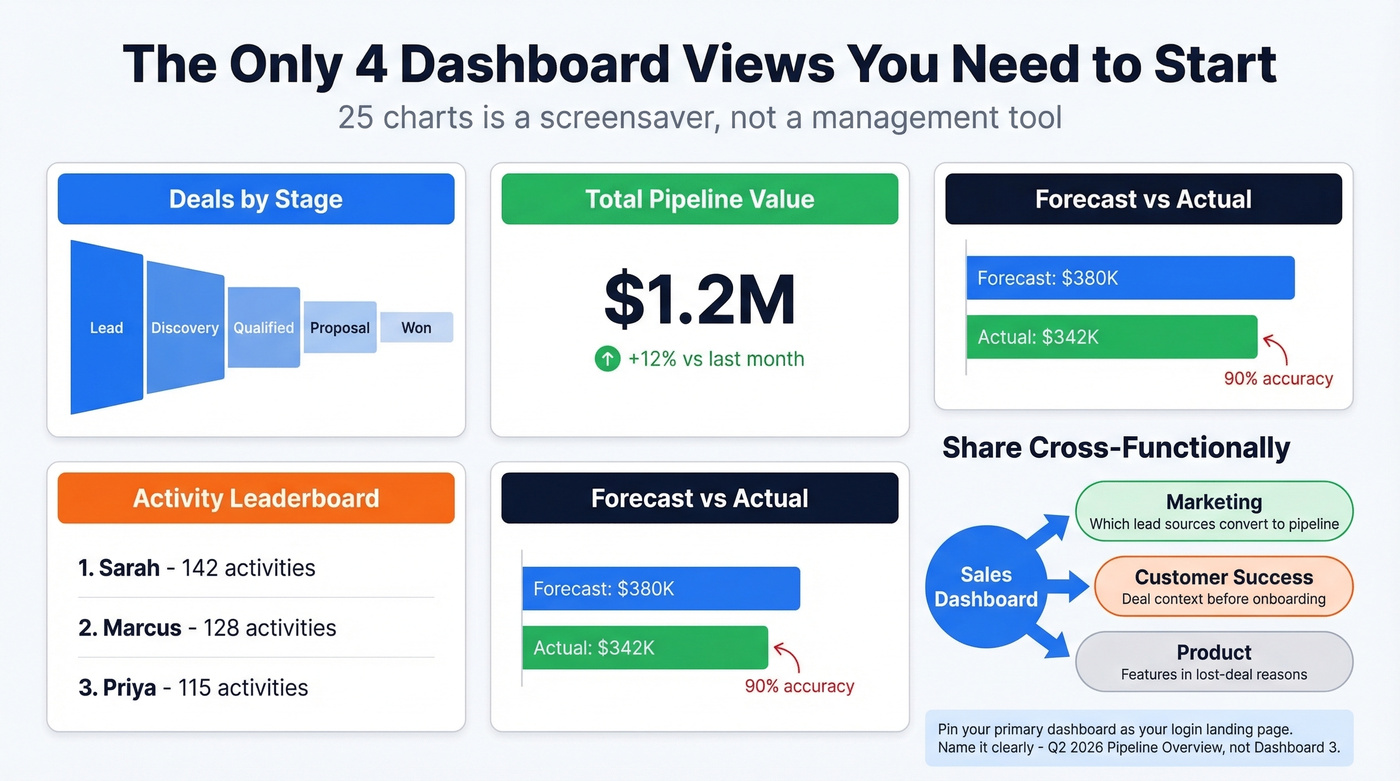
Start with four views: deals by stage, total pipeline value, activity leaderboard, and forecast vs. actual. Build from there only when someone has a specific question the existing reports can't answer. For monthly growth monitoring, add a simple month-over-month revenue trend line - one chart, not five.
Share your dashboards cross-functionally. Marketing needs to see which lead sources convert to pipeline. Customer success needs deal context before onboarding. Product needs to see which features come up in lost-deal reasons. Most teams silo sales data and then complain about misalignment - the fix is access, not more meetings.
Pin your primary dashboard so it's the first thing you see when you log in. Use clear names - "Q2 2026 Pipeline Overview," not "Dashboard 3." Schedule automated sends: daily activity summaries for managers, weekly pipeline snapshots for leadership.
Data Hygiene
You can "have a CRM" and still not know what's in your pipeline. That's a data hygiene failure, not a software problem.
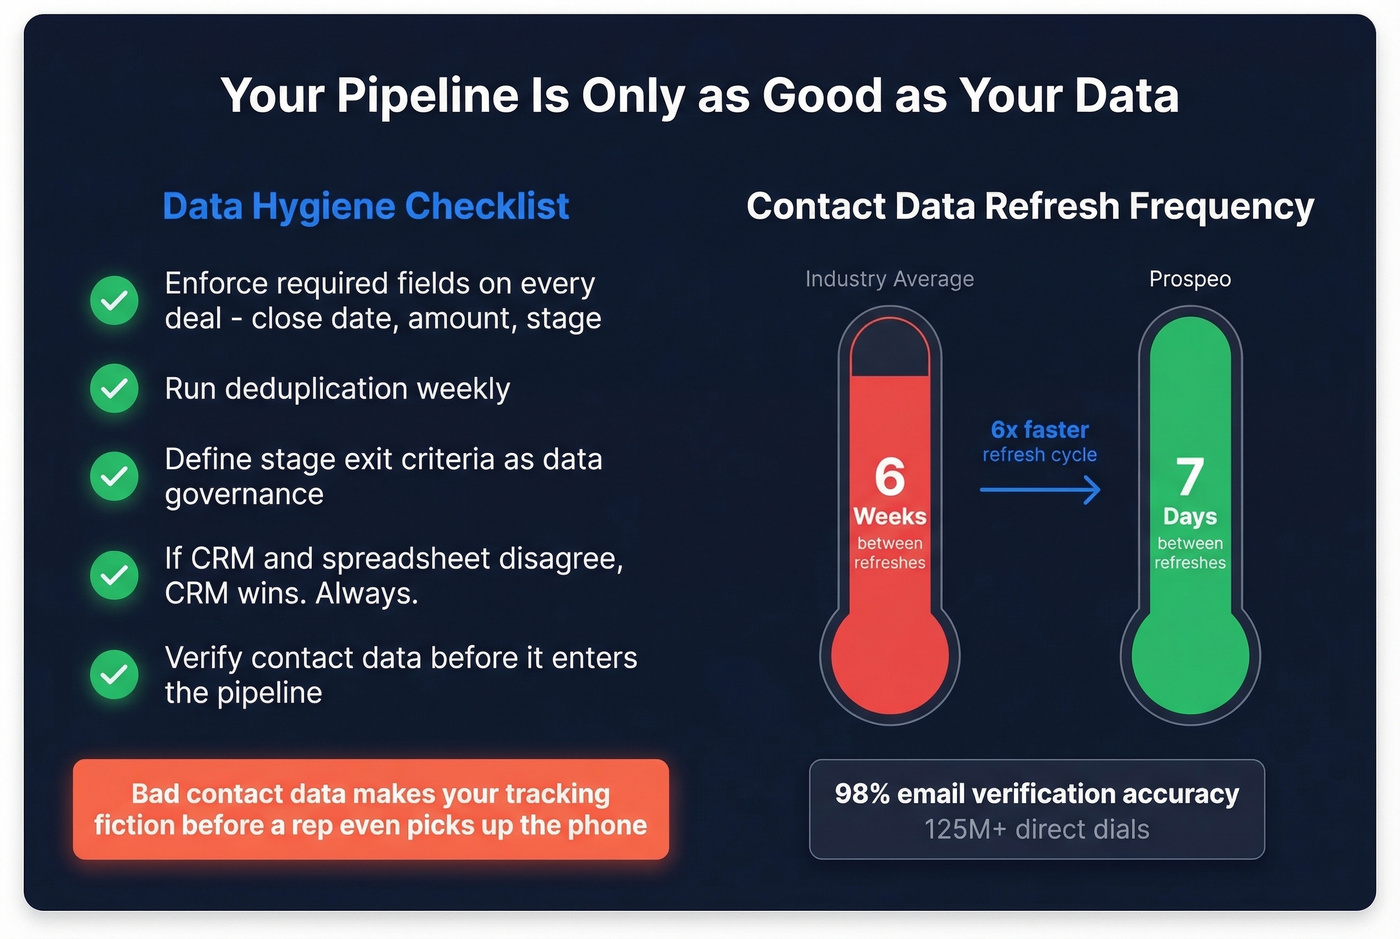
The basics: enforce required fields on deal creation - no deal without a close date, amount, and stage. Run deduplication weekly. Define stage exit criteria as data governance, not just sales process. If the CRM and the spreadsheet disagree, the CRM wins. Always.
For outbound-heavy teams, bad contact data makes your tracking fiction before a rep even picks up the phone. Prospeo verifies emails with 98% accuracy and refreshes data every 7 days - compared to the 6-week industry average - so the pipeline numbers you're tracking reflect reality rather than bounced emails and dead-end phone numbers.

Track Differently by Business Model
Don't copy a SaaS playbook if you're running an ecommerce operation. The metrics that matter shift dramatically.
B2B SaaS teams live in pipeline coverage, deal velocity, and stage conversion rates. The SaaS "magic number" - net new ARR divided by prior-quarter sales and marketing spend - is the single best health metric for SaaS growth efficiency. Above 1.0 means you're spending efficiently. Below 0.5 means something is broken.
B2B ecommerce, a market projected to reach $61.9T by 2030, cares more about conversion rate, abandoned cart rate, web store adoption, online vs. offline purchase ratios, basket size, and total cost of ownership. Services businesses should track utilization rates, proposal-to-close ratios, and project profitability alongside pipeline. 73% of B2B buyers now expect the same online experience as B2C, so your tracking system needs to capture digital buying signals - not just rep-reported activity.
Mistakes That Break Your Tracking
We've audited dozens of sales tracking setups over the years, and the same six problems keep showing up:
- Tracking revenue only, ignoring CAC and CLV. Revenue tells you what happened. CAC and CLV tell you whether it was worth it.
- Tracking results without activities. If you only measure closed deals, you can't diagnose why the pipeline dried up three months ago.
- No standardized definitions across reps. If every rep defines "qualified" differently, your rollup is meaningless.
- Collecting data without analyzing it. A CRM full of untouched reports is just expensive storage.
- No accountability tied to metrics. Tracking without targets is observation, not management.
- Not maintaining the system as you scale. The process that worked for 3 reps breaks at 15. Revisit quarterly.
Number three is the one that frustrates us most, because it's the easiest to fix and the most commonly ignored. A 30-minute meeting to align on definitions saves months of bad forecasting.
The best follow-up system in the world fails when your emails bounce. Teams using Prospeo cut bounce rates from 35%+ to under 4% and book 26% more meetings - because every contact in their pipeline is verified on a 7-day refresh cycle.
Stop tracking deals that were never real. Start with verified data.
FAQ
What's the best free way to track sales?
A Google Sheets template with Next Actions follow-up logic, color-coded due dates, and pre-built reports. It works well for solo sellers or teams under three reps - no registration, no software cost, and you can start in five minutes.
When should I switch from a spreadsheet to a CRM?
When more than one person touches deals, when you need automated follow-up reminders, or when your pipeline exceeds roughly 50 active opportunities. At that point, versioning and manual updates become a revenue risk, not just an inconvenience.
How many sales metrics should I track?
Six to ten, reviewed on a fixed weekly cadence. Focus on 3-4 leading indicators (calls, emails, meetings, follow-ups) and 3-4 lagging indicators (win rate, deal cycle, pipeline value, forecast accuracy). More than that and nobody looks at the dashboard.
How do I keep CRM data clean for accurate reporting?
Enforce required fields, deduplicate weekly, and verify contact data before it enters your pipeline. For outbound teams, using a data provider with a short refresh cycle - 7 days rather than the typical 6 weeks - prevents stale records from polluting your reports.
What's the difference between sales metrics and KPIs?
Metrics describe activity - calls made, emails sent, deals created. KPIs measure performance against a specific business goal - win rate vs. target, pipeline coverage vs. quota. Every KPI is a metric, but not every metric is a KPI. Pick the ones tied to outcomes you can actually influence.