10 Inside Sales KPIs With the Benchmarks You Actually Need
A rep makes 2,000 dials in a month and books 6 meetings. The manager sees "high activity" on the dashboard and moves on. Meanwhile, pipeline is flat and the quarter's slipping.
That disconnect between activity and outcomes is where most inside sales KPI programs fall apart. Here are the 10 metrics that actually matter - with formulas, benchmarks, and the review cadence to keep them useful in 2026.
Start Here: The Three Tiers
Track three tiers and work backward from revenue, not forward from activity:
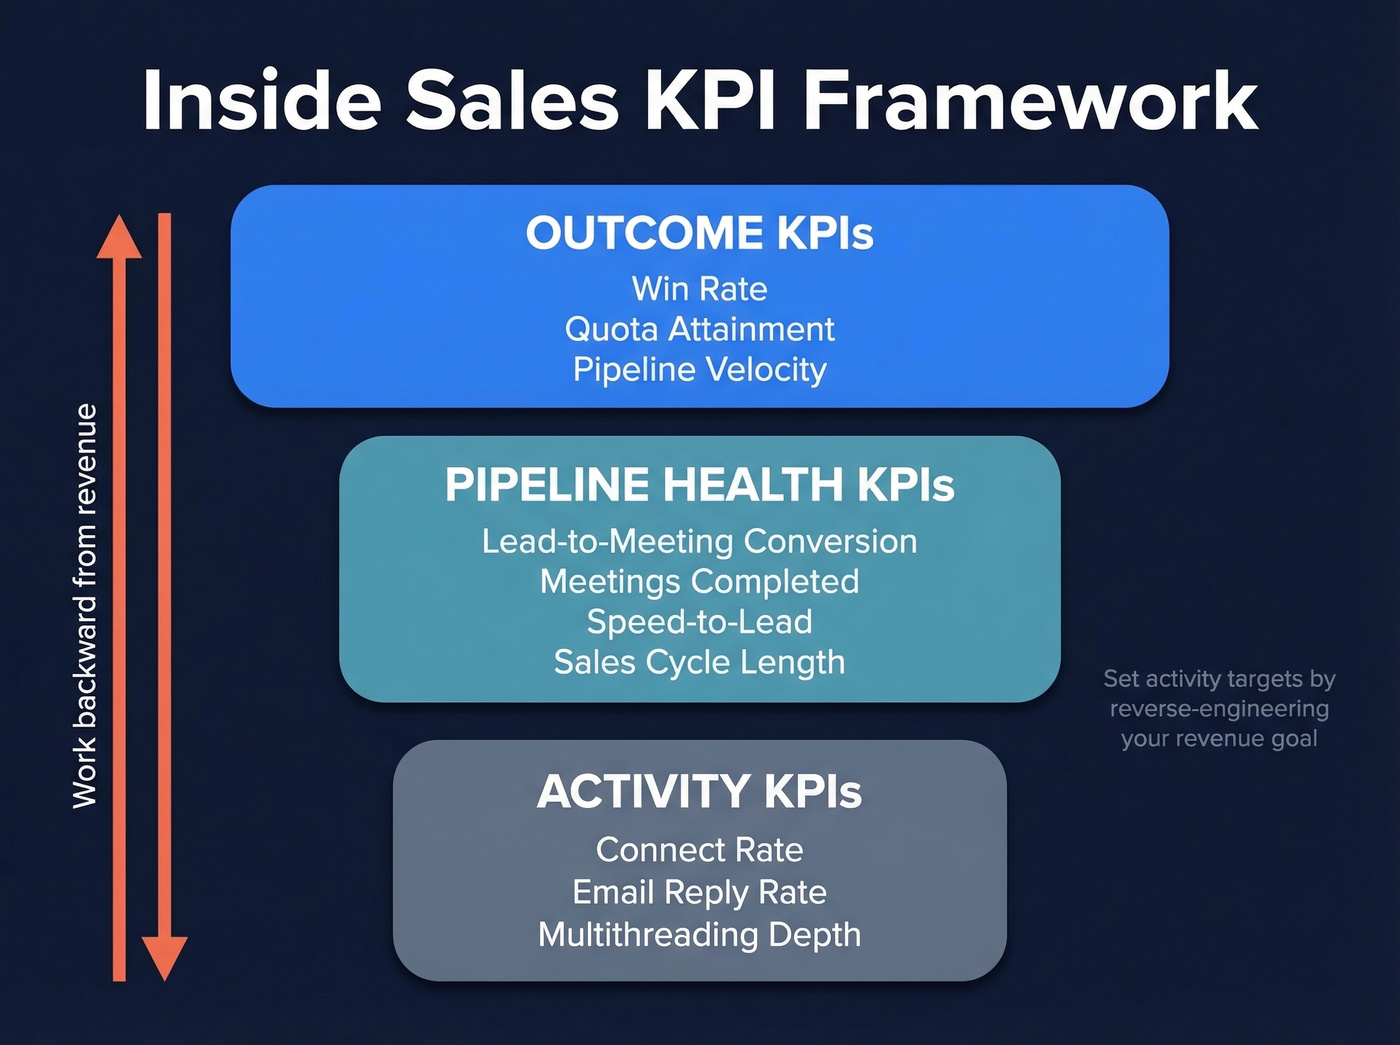
- Outcome KPIs: win rate, quota attainment, pipeline velocity
- Pipeline health KPIs: lead-to-meeting conversion, meetings completed, speed-to-lead, sales cycle length
- Activity KPIs: connect rate, email reply rate, multithreading depth
Set activity targets by reverse-engineering your revenue goal. If your connect rate or reply rate is below benchmark, check your data quality before blaming the rep.
KPIs vs. Metrics
Not every number on a dashboard is a KPI. A KPI is a metric tied to a critical business goal - total emails sent is a metric; reply rate tied to pipeline creation is a KPI.
Inside sales operates in a specific context: remote selling, 40-60 touches per day, $5K-$50K ACV, and 2-8 week sales cycles. Your performance metrics need to reflect that velocity, not the 6-month enterprise playbook.
The 10 Metrics That Move Pipeline
Bookmark this table. It's the reference you'll come back to.
| KPI | Formula | Benchmark | Tier |
|---|---|---|---|
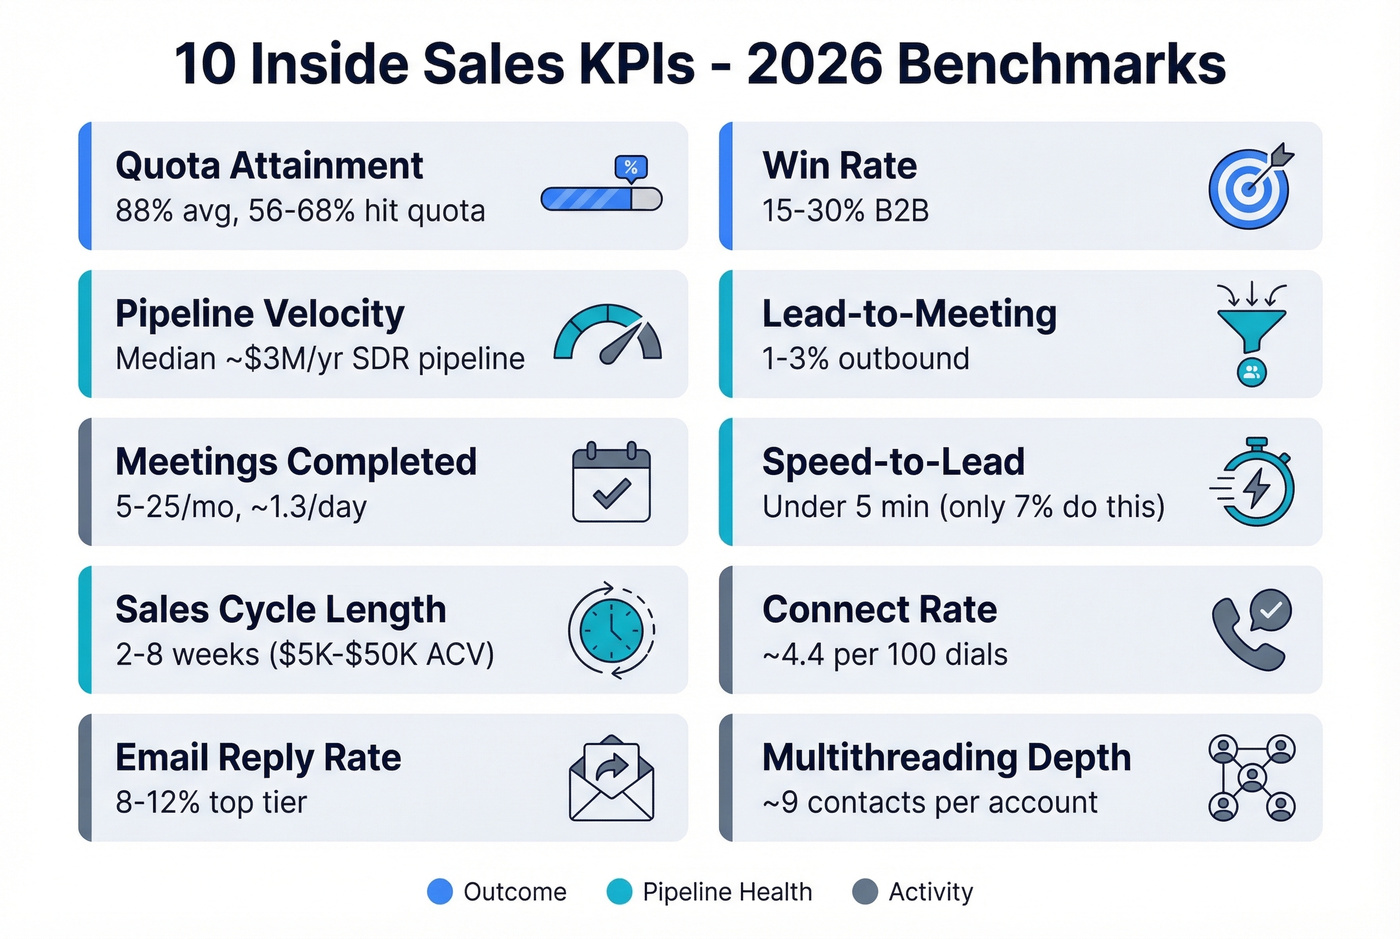
| Quota Attainment | (Revenue / Quota) x 100 | ~88% avg attainment; 56-68% hit quota | Outcome |
| Win Rate | (Won / Total Opps) x 100 | 15-30% B2B | Outcome |
| Pipeline Velocity | (Opps x Deal Val x Win%) / Cycle | Median SDR pipeline: ~$3M/yr | Outcome |
| Lead-to-Meeting | (Meetings / Leads) x 100 | 1-3% outbound | Pipeline |
| Meetings Completed | Booked - No-shows | 5-25/mo; ~1.3/day | Pipeline |
| Speed-to-Lead | Time to first response | Only 7% respond under 5 min | Pipeline |
| Sales Cycle Length | Opp created to Closed | 2-8 weeks ($5K-$50K ACV) | Pipeline |
| Connect Rate | Connects / Dials | ~4.4 per 100 dials | Activity |
| Email Reply Rate | Replies / Emails Sent | 8-12% top tier | Activity |
| Multithreading | Contacts per Account | ~9 contacts/account | Activity |
Outcome KPIs
1. Quota Attainment. (Actual revenue / quota) x 100. BDRs hit ~88% of quota on average per 2026 benchmark data, but only 56-68% of SDRs actually achieve full quota depending on the study. A few crushers pull the mean up - don't confuse average attainment with the percentage who hit it. HubSpot's latest data shows 59.9% of teams on track to meet revenue targets.
2. Win Rate. (Closed-won / total opportunities) x 100. Typical B2B inside sales win rates land between 15% and 30%, depending on ACV and market. The encouraging signal: 91% of sales teams report their win rate is stable or improving. If yours is declining while activity is up, you've got a qualification problem, not a volume problem.
3. Pipeline Velocity. Here's the one metric to rule them all. (Number of opportunities x average deal value x win rate) / sales cycle length. It captures volume, value, efficiency, and speed in a single number. Median SDR-generated pipeline runs about $3M per year - use that as a directional benchmark, then calculate your own velocity figure. If you could only track one KPI, this would be it.
Pipeline Health KPIs
Let's be honest: if your deal size is under $15K and your sales cycle is under 4 weeks, speed-to-lead matters more than every other metric on this list. Fix your response time before you optimize anything else.
4. Lead-to-Meeting Conversion Rate. For outbound, 1-3% is the benchmark. A fully ramped SDR should generate 10-20 qualified meetings per month. Below 1%? The issue is targeting or messaging - not effort.
5. Meetings Completed. Not booked - completed. No-show rates eat 20-30% of your calendar. Benchmarks range from 5-25 meetings per month depending on deal complexity, with 1.3 per day as a solid target for a ramped rep.
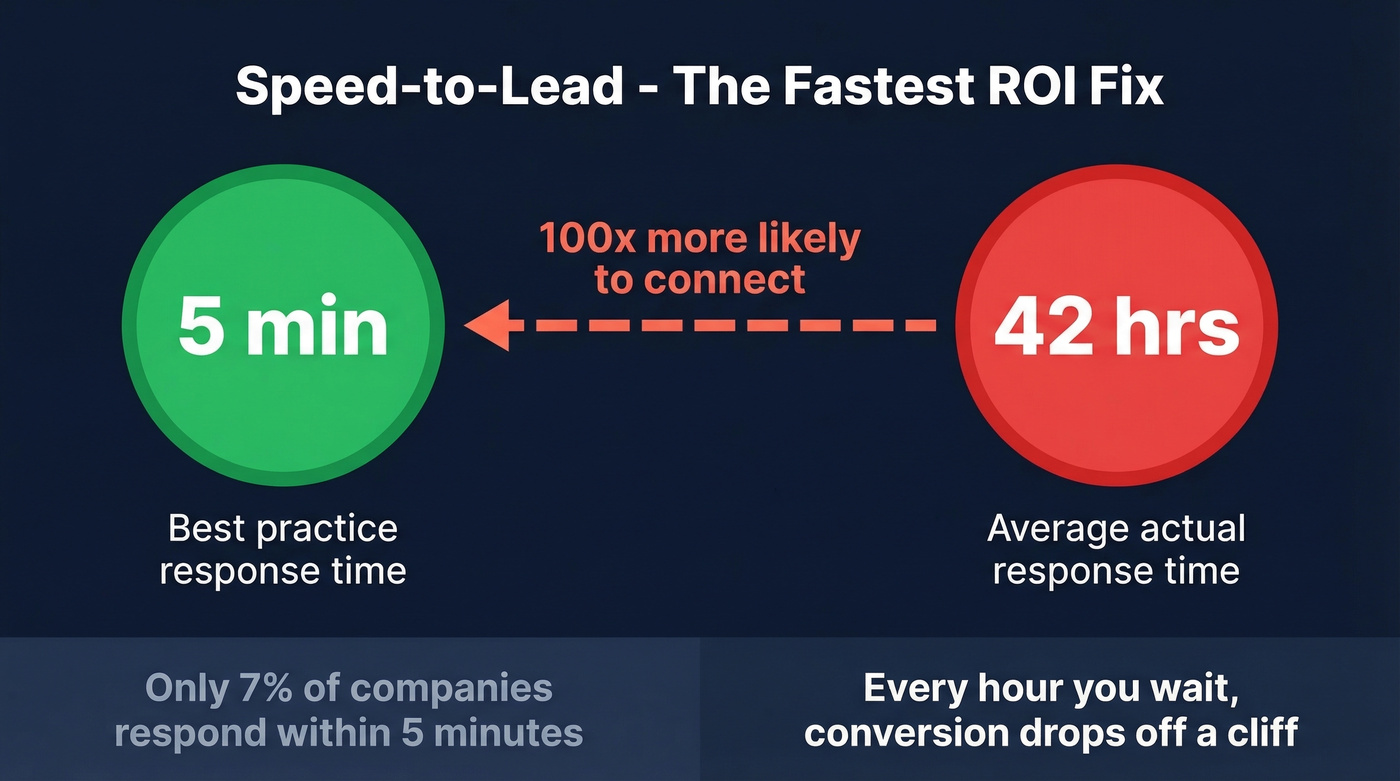
6. Speed-to-Lead. Only 7% of companies respond to inbound leads within 5 minutes. The average response time? 42 hours. In our experience, this is the single fastest ROI fix for any inside sales team. Every hour you wait, conversion probability drops off a cliff - and unlike most KPIs, fixing this one costs nothing. InsideSales research found that responding within 5 minutes makes you 100x more likely to connect than waiting 30 minutes.
7. Sales Cycle Length. For inside sales ACV ranges ($5K-$50K), expect 2-8 weeks. 22% of sales pros prioritize this metric, and for good reason - shortening your cycle by even a week compounds across every deal in the quarter. Track it by segment, not as a blended average, or you'll miss where deals actually stall.
Activity KPIs
8. Connect Rate. Picture this: a rep dials 100 numbers and reaches 4 people. That's the reality - per Gartner data compiled by Gradient Works, it takes 18+ dials to get a single connect, and callback rates run under 1%. Stop celebrating call volume. A rep making 80 calls at a 2% connect rate with bad phone data is wasting 78 dials.
9. Email Reply Rate. Top-tier teams hit 8-12%. Below 3% means your targeting or messaging is broken. The environment is getting harder - 69% of cold email senders report declining performance year-over-year due to spam filtering and AI content fatigue.
10. Multithreading Depth. 90% of BDRs now multithread, reaching ~9 contacts per account (up from 6.4). The average cadence runs 21 attempts per contact across roughly 5 social touches, 8 calls, and 8 emails, stretched over 53 days. Single-threading is dead.
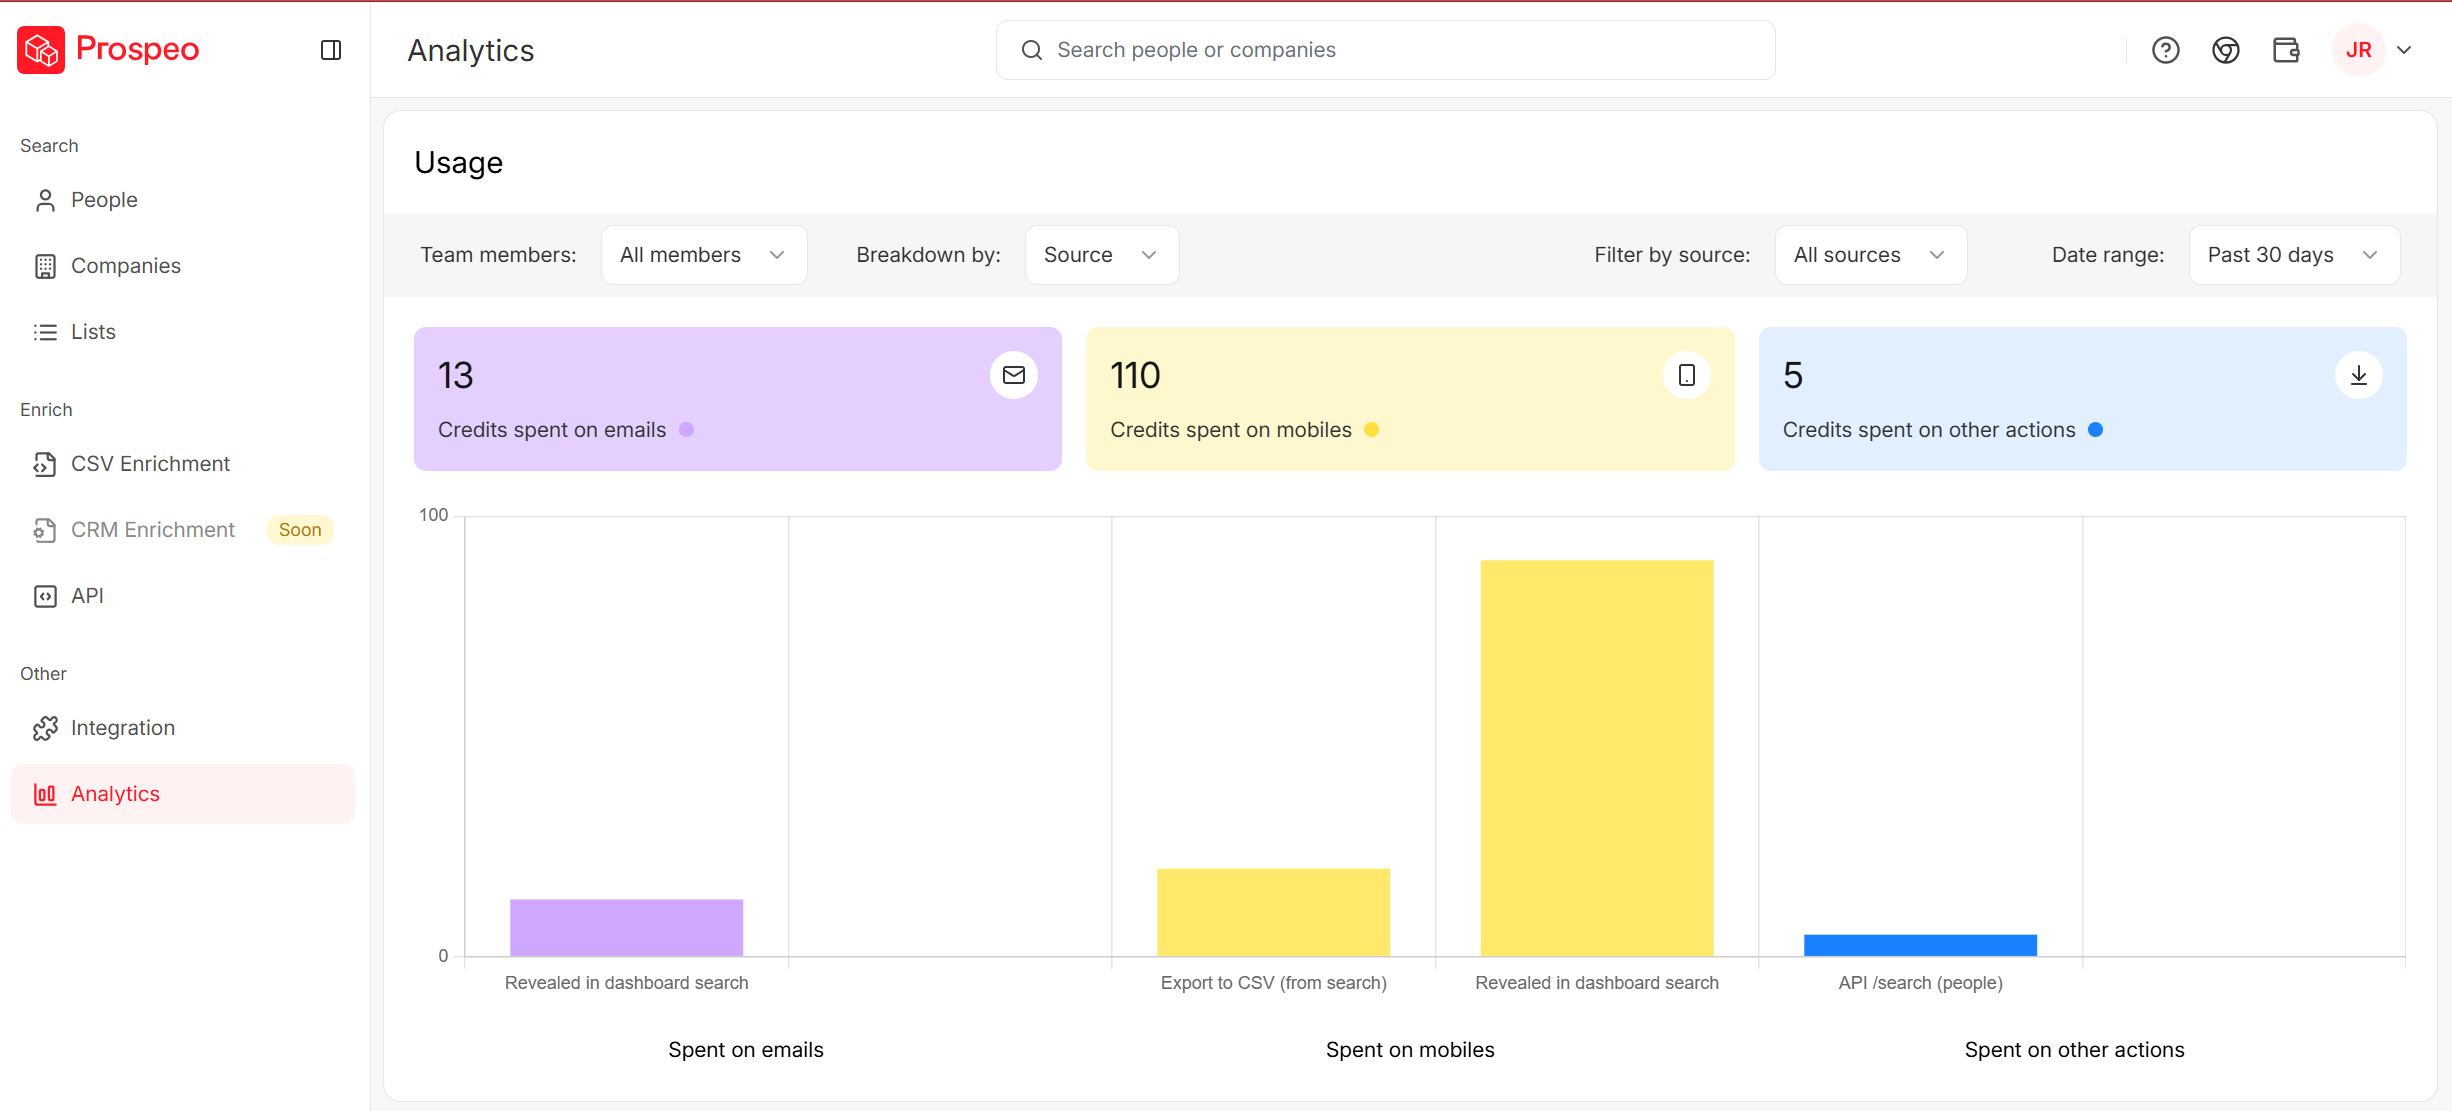
Every KPI on this list - connect rate, reply rate, meetings completed - degrades when your data is bad. Prospeo delivers 98% email accuracy and 125M+ verified mobile numbers with a 30% pickup rate, so your reps hit real people instead of dead ends.
Stop letting bad data make good reps look like underperformers.
When Bad Data Poisons Your KPIs
Here's the thing: if your connect rate and reply rate are consistently below these benchmarks, the problem might not be your reps. It's your data.
Bounced emails and wrong numbers silently poison every downstream KPI. We've seen this pattern repeatedly. Meritt's team was running a 35% bounce rate before switching to Prospeo, which dropped it under 4%. Their connect rate tripled to 20-25%. Bad data doesn't just waste dials - it makes good reps look like bad ones.
Skip the data quality conversation if your bounce rate is already under 5%. But if it's above 10%, fix that before you touch anything else on this list.
KPI Mistakes That Kill Performance
We've audited dozens of sales dashboards, and the most common problem is always the same: too many metrics, not enough decisions.
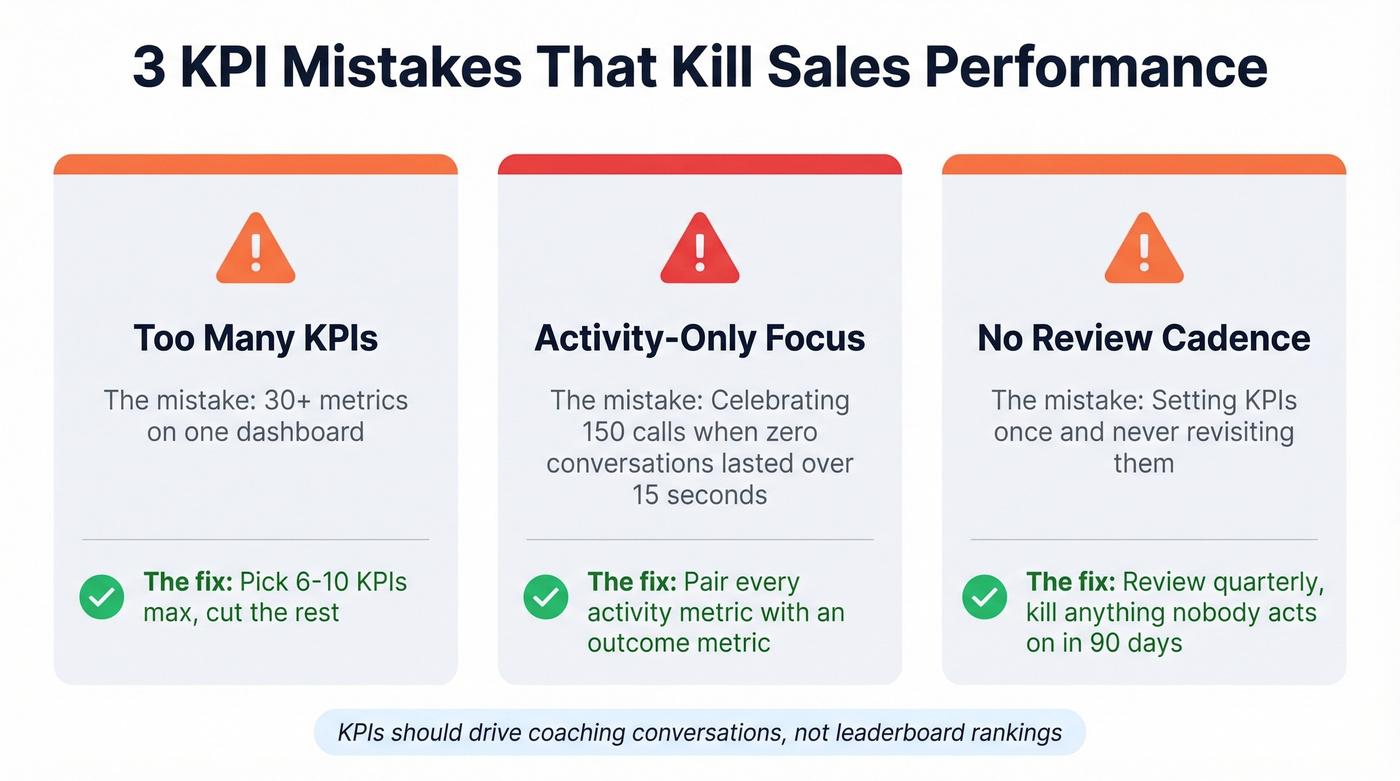
Tracking too many KPIs. If your dashboard has 30+ metrics, nobody's acting on any of them. Pick 6-10 and cut the rest.
Activity-only focus without outcome context. When reps get measured purely on calls and emails, they game the numbers. A rep who logs 100 "calls" averaging 8 seconds isn't prospecting - they're performing for the dashboard. I've watched managers celebrate a rep's 150-call day only to discover zero conversations lasted longer than 15 seconds.
No review cadence. Review quarterly and kill anything nobody acts on. One r/managers thread captured this well: newer staff found monthly KPI comparisons demoralizing even when they were improving. Multiple commenters argued that KPIs should drive coaching conversations, not leaderboard rankings. Use them accordingly.
How AI Is Reshaping These Metrics
Stop tracking calls per day as a primary KPI. 60% of BDRs already use AI tools, and Gartner projects that by 2028, AI will handle 70% of sales cycles by automating prospecting, qualification, and negotiation. The shift is from volume to quality: deal acceleration impact, buyer engagement quality, objection resolution effectiveness.
If your inside sales performance metrics still reward "most dials," you're optimizing for a world that's already disappearing.
How to Track Inside Sales KPIs
Three dashboard views, matched to who's looking:
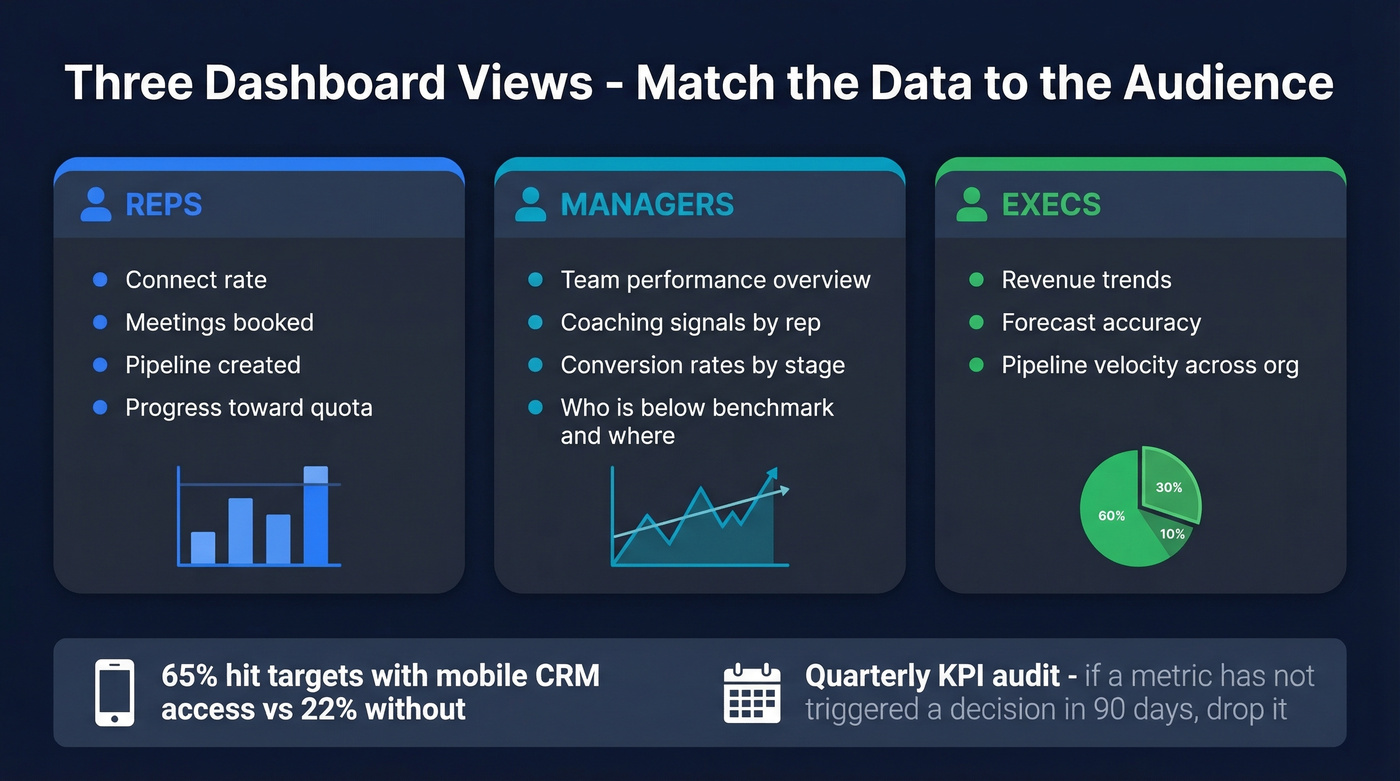
Reps see personal activity metrics, pipeline status, and progress toward quota - connect rate, meetings booked, pipeline created. Keep it simple. Managers see team performance, coaching signals for who's below benchmark on which metric, and conversion rates by stage. Execs see revenue trends, forecast accuracy, and pipeline velocity across the org.
Teams with mobile CRM access hit targets at a 65% rate vs. 22% for teams without it. Make sure your dashboards work on phones. And build in a quarterly KPI audit - if a metric hasn't triggered a decision or coaching conversation in 90 days, drop it.
Multithreading 9 contacts per account means nothing if half those emails bounce. Prospeo refreshes all 300M+ profiles every 7 days - not every 6 weeks - so your outbound hits verified contacts, not spam traps. Teams using Prospeo see bounce rates under 4% and connect rates 3x higher.
Fix your data quality and watch every downstream KPI improve overnight.
FAQ
How many KPIs should an inside sales team track?
Six to ten, grouped into outcomes, pipeline health, and activity inputs. Review quarterly and cut anything nobody acts on - a KPI that doesn't drive a decision or coaching conversation isn't a KPI, it's dashboard clutter.
What's the difference between inside sales metrics and KPIs?
A KPI is a metric tied directly to a critical business goal. Quota attainment maps to revenue - that's a KPI. Total emails sent tells you volume without context on whether that volume creates pipeline - that's just a metric.
How does data quality affect inside sales KPIs?
A 15% email bounce rate means one in seven messages never arrives, dragging down reply rate, meetings booked, and pipeline created. Verified contact data keeps your metrics clean so they reflect actual rep performance instead of database rot.
What's a good connect rate benchmark in 2026?
Expect roughly 4.4 connects per 100 dials on average. Below 3%, your phone data likely needs a refresh - verified mobile numbers with a 30% pickup rate can triple connect rates compared to generic office lines.
Which single KPI matters most for inside sales?
Pipeline velocity. It combines opportunity count, deal value, win rate, and cycle length into one number. Improving any of those four inputs accelerates revenue, making it the most complete indicator of team health.