Pipeline Value: What It Is, Why Yours Is Wrong, and How to Fix It
Your CRM says you've got $2.4M in pipeline. Your weighted number is $680K. You miss the quarter by 30%, and the board wants to know what happened.
This story plays out every quarter at companies of every size, and the root cause is almost always the same: nobody understands what pipeline value actually means, and nobody's doing the math honestly. A sales leader on r/sales managing 150 reps put it bluntly - their pipeline was inflated by roughly 60%, packed with wrong dollar values, outdated close dates, and stale contacts. That inflated number drove inflated quotas, which drove missed targets, which destroyed trust between reps and leadership.
Here's the short version: pipeline value is the total dollar amount of open opportunities in your CRM. But raw pipeline value is a vanity metric. Weighted pipeline value - adjusted by stage probability - is what actually predicts revenue. And if your weighted coverage sits below 2.1x quota, you're in miss-risk territory.
What Is Pipeline Value?
Pipeline value is the sum of every open opportunity's dollar amount in your CRM at a given point in time. That's it. No magic.
The basic formula: Sum of all open opportunity amounts. A pipeline with 40 deals averaging $25K each has a gross total of $1M. Don't confuse this with deal value (the amount on a single opportunity) or revenue (money you've actually collected from closed-won deals). Pipeline value is forward-looking - it's a forecast input, not a result. Revenue is what shows up on the income statement after the deal closes, the contract signs, and the invoice gets paid.
The raw number tells you almost nothing about what you'll actually close. It's the starting point, not the answer.
How to Calculate Pipeline Value
Gross Pipeline Value
Gross Pipeline Value = Sum of all open opportunity amounts
Five deals worth $20K, $50K, $35K, $80K, and $15K? Your total is $200K. Simple addition. Every CRM dashboard shows this number by default.
Weighted Pipeline Value
Weighted pipeline value adjusts each deal by its probability of closing based on what stage it's in:
Weighted Pipeline Value = Sum of (Opportunity Amount x Stage Probability)
This is where the number gets honest. A $50K deal in Discovery isn't worth $50K to your forecast - it's worth $50K x 22% = $11K. That same $50K in negotiation is worth $36K. Same dollar amount, very different forecast contribution.
Worked Example
| Deal | Amount | Stage | Probability | Weighted Value |
|---|---|---|---|---|
| Acme Corp | $80K | Negotiation | 72% | $57,600 |
| Beta Inc | $50K | Discovery | 22% | $11,000 |
| Gamma Ltd | $35K | Proposal | 45% | $15,750 |
| Delta Co | $20K | Verbal Commit | 88% | $17,600 |
| Echo LLC | $15K | Initial Qual | 8% | $1,200 |
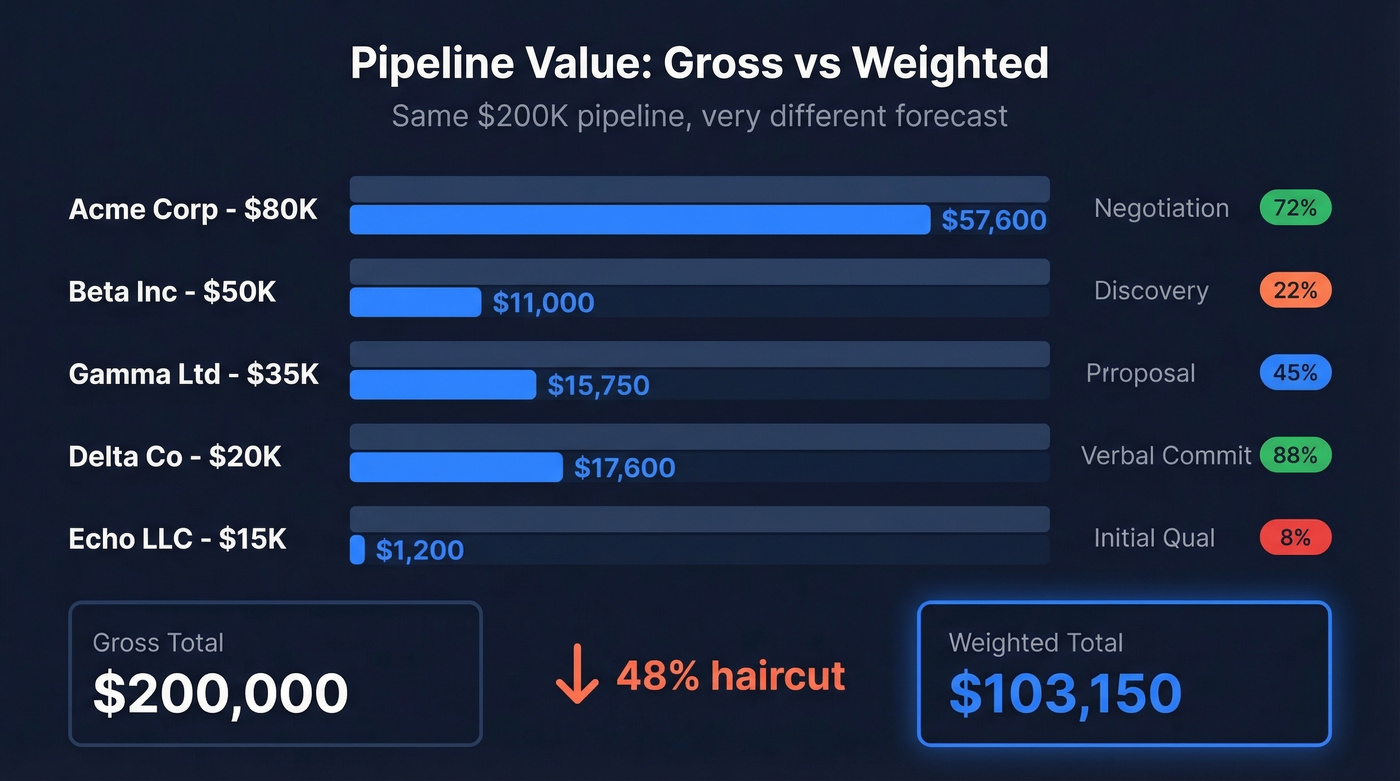
Gross total: $200K. Weighted total: $103,150.
That's a 48% haircut. And this example is generous - in practice, weighted pipeline typically runs 25-40% of raw pipeline depending on stage distribution. If your weighted number is above 50% of gross, your probabilities are too optimistic.
Gross vs. Weighted: Where Forecasts Break
The gap between gross and weighted pipeline value is where forecast accuracy lives or dies.
For $5M-$50M B2B tech companies, the median raw pipeline coverage is 3.4x quarterly target while probability-weighted coverage is just 1.8x. That 1.6x gap is the difference between what your CRM shows and what you'll actually close. A VP who tells the board "we've got 3.4x coverage" is painting a very different picture than one who says "our weighted coverage is 1.8x." Both are technically true. Only one is useful.
Per Salesforce's State of Sales report, high-performing organizations are 2.8x more likely to use weighted pipeline forecasting. Gartner's Sales Analytics research shows weighted pipeline reduces forecast variance by roughly 35% compared to unweighted models. These aren't marginal improvements - they're the difference between a forecast your CFO can plan around and one that's fiction.
Stage Probability Benchmarks
Example Probability Table
| Stage | Probability | $100K Deal -> Weighted |
|---|---|---|
| Initial Qualification | 8% | $8,000 |
| Discovery Complete | 22% | $22,000 |
| Proposal/Evaluation | 45% | $45,000 |
| Negotiation | 72% | $72,000 |
| Verbal Commit | 88% | $88,000 |
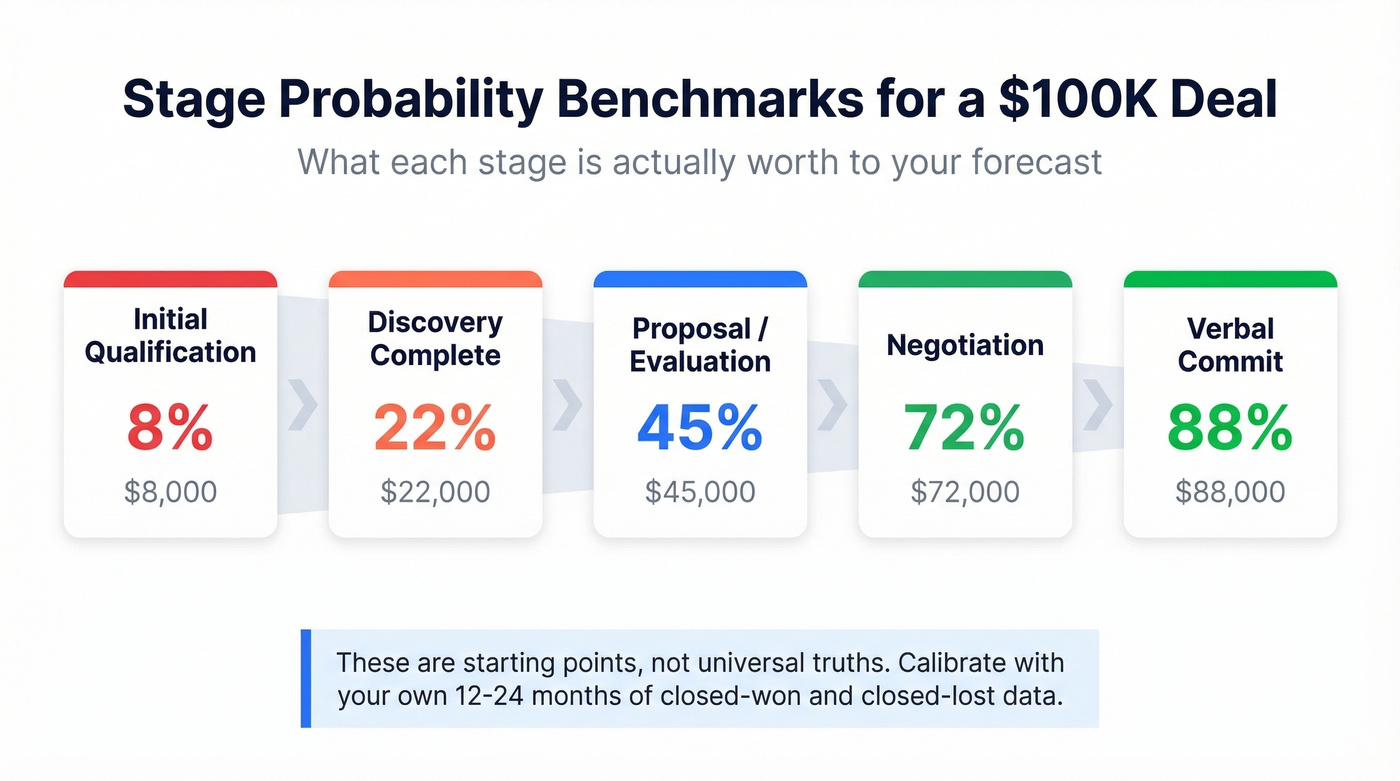
These aren't universal truths. They're starting points. Your actual stage probabilities should reflect your historical win rates, not whatever defaults Salesforce shipped with your instance. Most CRM default probabilities are arbitrary round numbers (10%, 25%, 50%, 75%, 90%) that have zero relationship to how your deals actually convert.
How to Calibrate Stage Probabilities
Pull 12-24 months of closed-won and closed-lost data. For each stage, calculate the percentage of deals that entered that stage and eventually closed-won. That's your real probability. Organizations that do this see 15-25% forecast accuracy improvement versus unweighted models.
Go further: group opportunities by creation month and track outcomes over time. These cohorted win rates reveal where in the funnel deals actually die - information that flat, all-time win rates hide completely. In our experience, recalibrating probabilities quarterly is the single highest-ROI forecasting improvement most teams can make. Win rates shift with market conditions, product changes, and team composition. A probability table from 18 months ago is dangerously stale.
Segment by deal type too. New business, expansion, and renewal deals convert at very different rates by stage, and lumping them together produces probabilities that are wrong for all three.
Inflated pipeline starts with bad data - wrong contacts, stale emails, bounced outreach. Prospeo's 98% email accuracy and 7-day data refresh mean every deal in your pipeline is attached to a real, reachable buyer. No more phantom opportunities dragging down your weighted forecast.
Stop forecasting on contacts that bounce. Start with data that connects.
Coverage Ratio Benchmarks
Why Your Coverage Ratio Is Lying
Let's be honest: pipeline coverage ratios are overrated without composition context. A 3x pipeline that's 80% early-stage is worse than 1.5x that's 60% late-stage. We've seen teams with 5x coverage miss quota because the vast majority of that pipeline was sitting in discovery with no buyer commitment. Stop chasing a ratio - analyze composition.
One heuristic we use: if your top 10 deals represent more than 40-50% of total pipeline value, your forecast volatility is elevated. One deal slipping can blow your quarter.
Coverage by Segment
The formula for how much coverage you need is simple: coverage needed = 1 / win rate. A team with a 25% win rate needs 4x coverage. A team closing 35% needs roughly 3x.
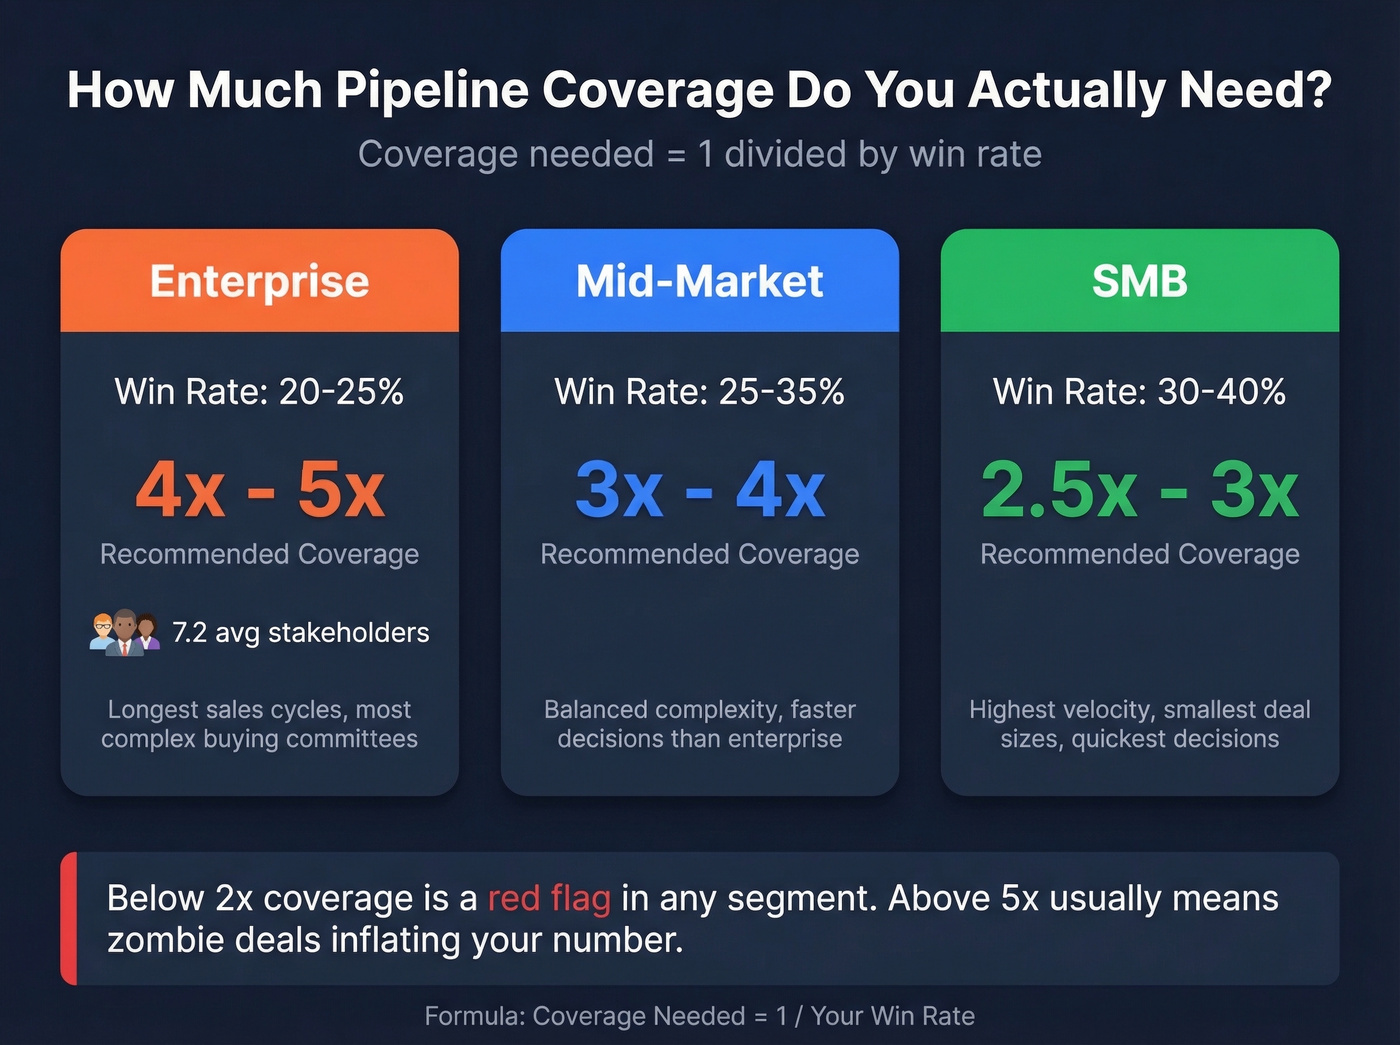
| Segment | Win Rate | Min. Coverage | Recommended |
|---|---|---|---|
| Enterprise | 20-25% | 4x-5x | 4x-5x |
| Mid-market | 25-35% | 3x-4x | 3x-4x |
| SMB | 30-40% | 2.5x-3x | 2.5x-3x |
Enterprise deals involve an average of 7.2 stakeholders, which is why win rates are lower and coverage needs are higher. Below 2x is a red flag regardless of segment. Above 5x usually means bloat - zombie deals inflating the number without any real chance of closing.
Stage Distribution
A healthy pipeline follows a predictable shape. Early stages (1-3) should hold 40-50% of value, middle stages 30-35%, and late stages 20-25%.
More than 60% in early stages? You've got a conversion problem. Less than 15% in late stages means near-term revenue risk. More than 40% in late stages signals either sandbagging or stalled deals that reps won't close-lost.
The "hits plan" profile: weighted coverage of 2.1x or higher, 70%+ of weighted pipeline from Stage 2+, and less than 25% of pipeline stuck in the same stage for more than 45 days. That combination predicts plan attainment with 78% accuracy.
Why Your Pipeline Value Is Wrong
Average quota attainment is 43% in 2026. Most sales orgs are building forecasts on fantasy pipeline numbers.
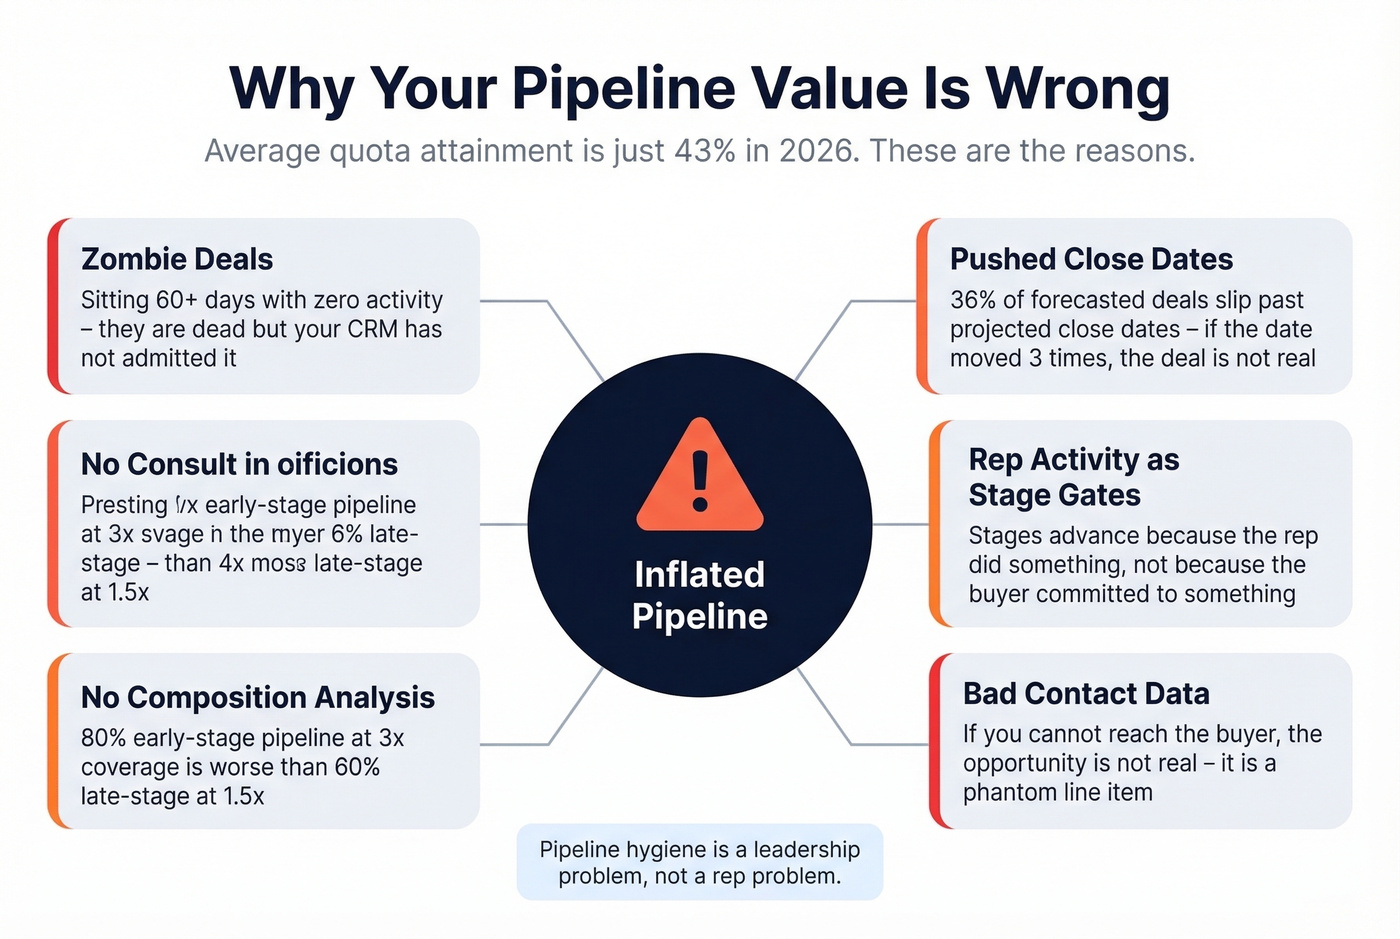
The warning signs are predictable. Zombie deals sit 60+ days with no activity - they're dead, your CRM just hasn't admitted it. Close dates get pushed from this quarter to next quarter to the quarter after; if a close date has moved three times, the deal isn't real. Reps move deals forward based on their own activity ("I sent the proposal") rather than buyer commitments ("They scheduled a technical review with their team"). And 36% of forecasted deals slip past projected close dates - if a third of your pipeline is going to slip, your gross number is lying to you by definition.
Bad contact data creates phantom pipeline too. If you can't actually reach the buyer, the opportunity isn't real - it's a line item that makes the dashboard look better. Prospeo verifies emails with 98% accuracy on a 7-day refresh cycle, so the opportunities you enrich represent reachable prospects, not ghosts.
Here's the thing: pipeline hygiene is a leadership problem, not a rep problem. Don't blame reps for dirty CRM data when they have no time, incentive, or tooling to maintain it.
Pipeline Hygiene Checklist
- 30-day rule: Pull any deal with no activity in the past 30 days for manager review. Not automatic deletion - review.
- 60-day rule: Move deals with no activity in 60 days out of active pipeline entirely. No exceptions.
- Buyer-verified stage gates: Stage advancement requires a buyer action, not a rep action. "Proposal sent" isn't a stage gate. "Proposal reviewed with feedback received" is.
- Snapshot-based reporting: Report pipeline as of the first business day of each month. This prevents the moving-target problem where numbers shift daily and nobody can agree on what's real.
- Opportunity load limits: Enterprise AEs should carry 15-30 active opportunities. Mid-market, 30-50. SMB, 50-100+. Anything above these ranges means reps can't give deals adequate attention, and pipeline quality degrades fast.
Pipeline Velocity - The Companion Metric
Pipeline value tells you how much is in the pipe. Pipeline velocity tells you how fast it's moving through. You need both.
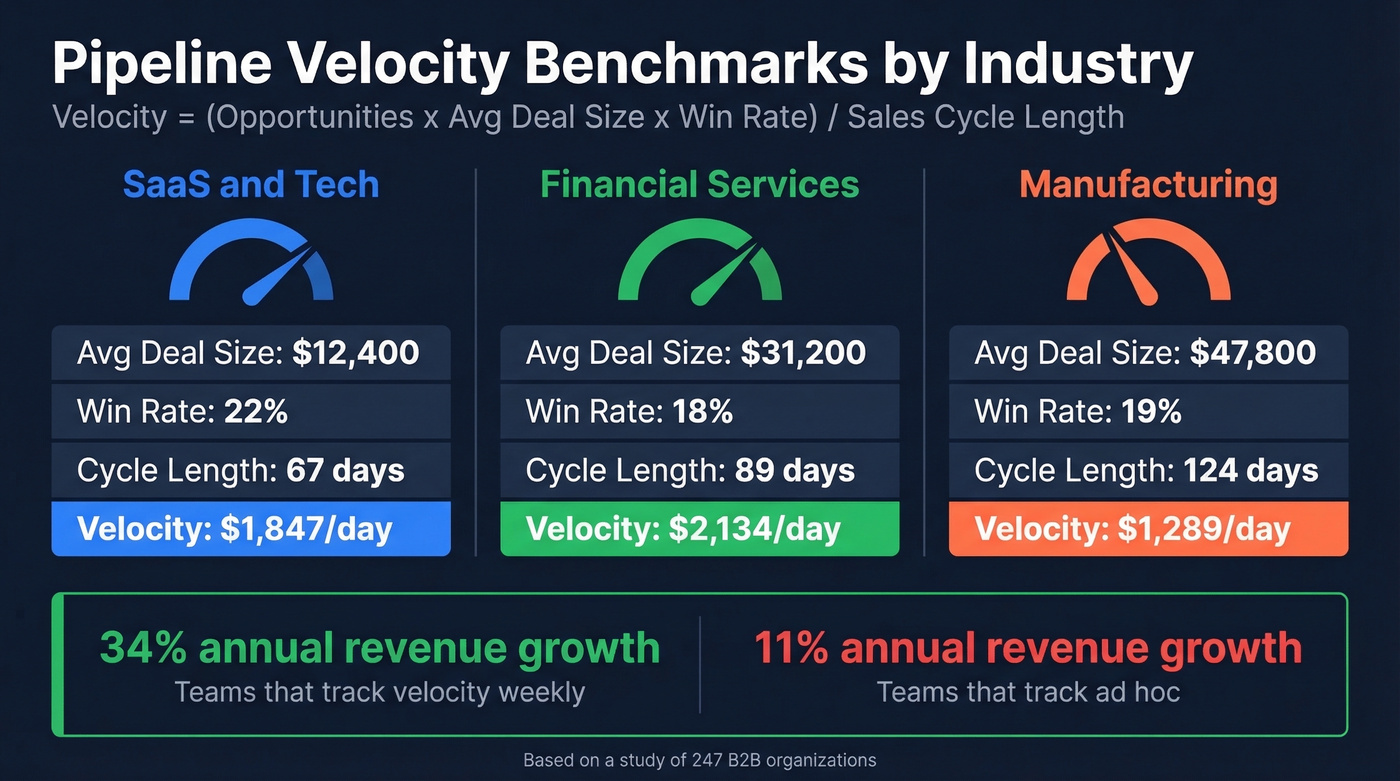
Velocity = (# Opportunities x Avg Deal Size x Win Rate) / Sales Cycle Length
A study of 247 B2B organizations produced these daily velocity benchmarks:
| Industry | Avg Deal Size | Win Rate | Cycle Length | Velocity |
|---|---|---|---|---|
| SaaS & Tech | $12,400 | 22% | 67 days | $1,847/day |
| Financial Svcs | $31,200 | 18% | 89 days | $2,134/day |
| Manufacturing | $47,800 | 19% | 124 days | $1,289/day |
The most striking finding: companies that track pipeline velocity weekly see 34% annual revenue growth and 87% forecast accuracy. Teams that track ad hoc? 11% growth and 52% accuracy. The act of measuring forces the discipline that improves the outcome.
Track pipeline waterfall alongside velocity - pipeline created, pipeline won/lost, and what remains open by period. This tells you whether you're building or depleting, which raw totals alone never reveal. Teams that track revenue pipeline end-to-end, from opportunity creation through close, gain the visibility needed to course-correct mid-quarter instead of running a post-mortem after a miss.
AI-Powered Forecasting in 2026
Traditional forecast accuracy runs 70-80%. AI-powered forecasting pushes that to 90-95%, and the AI-in-sales market is valued at roughly $6.3B. Tools like Clari, Gong, and 6sense are building revenue intelligence layers that analyze email sentiment, call patterns, and engagement signals to predict outcomes.
Consistent pipeline value tracking is the foundation these AI tools depend on. Without clean, timestamped snapshots of your pipeline, even the best models produce garbage outputs. David Sacks' three-layer pipeline framework - pipeline generation, pipeline conversion, and active pipeline - provides the analytical structure these AI tools build on. Skip this if you don't have clean CRM data yet; fix the foundation before buying the AI layer.
Coverage ratios mean nothing if your reps can't reach decision-makers. Prospeo gives you 300M+ verified profiles with 30+ filters - buyer intent, headcount growth, funding - so every opportunity you add to pipeline has a real path to closed-won. At $0.01 per email, filling coverage gaps costs less than one missed forecast.
Turn your coverage ratio from fiction into a number your CFO trusts.
FAQ
What's the difference between pipeline value and revenue?
Pipeline value is the total dollar amount of open opportunities in your CRM - it's forward-looking. Revenue is money collected from closed-won deals and appears on your income statement. Think of pipeline as potential; revenue is realized.
How do you calculate weighted pipeline value?
Multiply each open opportunity's dollar amount by its stage probability, then sum all weighted values. A $50K deal at 45% probability equals $22,500 in weighted value. Use historical win rates per stage, not CRM defaults.
What's a good pipeline coverage ratio?
For most B2B companies, 3x-5x quarterly target. The exact ratio depends on your win rate: coverage needed = 1 / win rate. Enterprise teams with 20% win rates need 5x; SMB teams closing at 35%+ can operate at 3x.
How often should you review pipeline metrics?
Weekly. Companies that track pipeline metrics weekly see 34% annual revenue growth and 87% forecast accuracy, versus 11% growth for teams that review ad hoc. Monthly snapshots add accountability.
How does bad contact data inflate pipeline value?
Opportunities tied to invalid emails or outdated contacts can't close - they're phantom deals inflating your numbers. Verifying contact data before it enters your pipeline, and re-verifying on a regular cycle, eliminates these ghosts and gives your weighted forecast a foundation it can actually stand on.