QBR Meaning: Quarterback Rating & Quarterly Business Reviews
QBR can mean two totally different things depending on context. Your QB threw for 350 yards and 3 TDs on Sunday, but his QBR was 42. Meanwhile, your VP of Sales just pinged you to "prep the QBR deck by Thursday." Understanding the QBR meaning you need starts with knowing which world you're in - football or business.
What Does QBR Stand For?
Which definition matters depends entirely on whether you're arguing about football or sitting in a conference room.
Quick disambiguation:
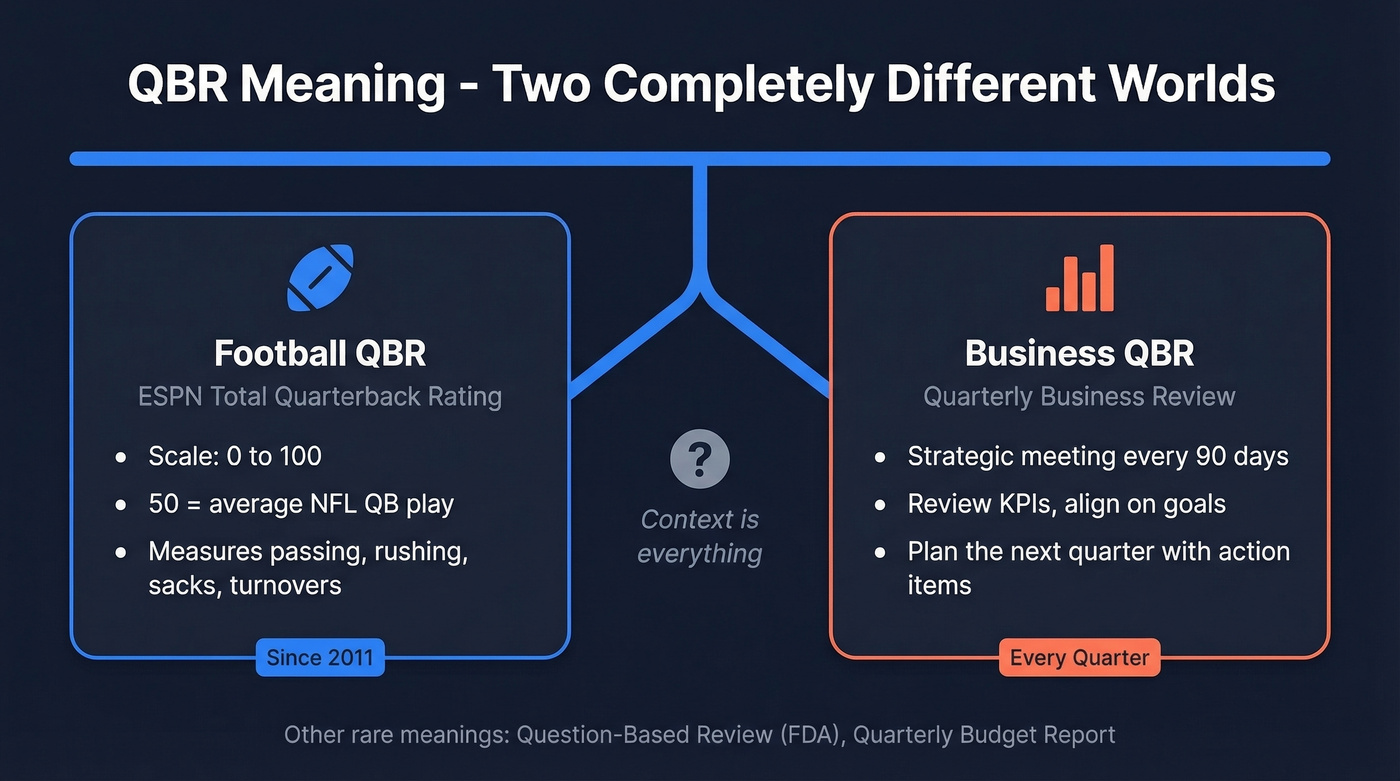
In football: QBR = ESPN's Total Quarterback Rating. A 0-100 scale where 50 is average. It measures a QB's total contribution to winning - passing, rushing, turnovers, and situational context.
In business: QBR = Quarterly Business Review. A strategic meeting held every three months to evaluate performance, align teams, and plan the next quarter.
Other meanings: Question-Based Review (FDA), Quarterly Budget Report, Queen's Baton Relay - all rare.
If you're here from a football argument, jump to the football section. If your boss told you to "prep the QBR," skip ahead to the business section.
ESPN's Total Quarterback Rating
ESPN introduced Total QBR in 2011 to solve a real problem: traditional passer rating only captures a fraction of what a quarterback does. It doesn't include rushing. It leaves out sacks, fumbles, and penalties that can swing games.
Total QBR measures a quarterback's total contribution to winning on a 0-100 scale, with 50 representing average NFL performance. It incorporates passing, rushing, sacks, turnovers, and penalties - everything a QB touches - with play-level context baked in.
How QBR Is Calculated
QBR is built on Expected Points Added (EPA), which measures how much each play changes a team's expected point total given the game situation. Here's the process:
Start with EPA. Every play gets a value based on how it changed the team's expected points. A 3rd-and-long conversion deep in your own territory is worth more than a 1st-and-10 checkdown at midfield.
Divide credit between QB and teammates. On completed passes, ESPN allocates play value using factors like air yards, expected yards after catch versus actual, and charting inputs such as whether the QB was under pressure. A screen that turns into a 60-yard run doesn't get credited the same way as a tight-window throw into double coverage.
Include non-passing plays. Rushing value, sack responsibility, fumbles, and penalties attributed to the QB all factor in. This is a major departure from passer rating, which ignores all of them.
Discount garbage time. Plays in low-leverage situations can be discounted by as much as 30%, based on score, time remaining, and field position. This prevents late-game stat-padding from inflating a QB's number.
Adjust for opponent strength. The rating accounts for the quality of opposing defenses faced.
Scale to 0-100. The final value gets translated to the 0-100 scale, with 50 calibrated as average.
The tradeoff is transparency - ESPN doesn't publish the complete formula and weights, which drives fans crazy.
What's a Good QBR?
| QBR Range | Rating | What It Means |
|---|---|---|
| Below 30 | Poor | Actively hurting the team |
| 30-39 | Below avg | Struggling more than helping |
| 40-49 | Slightly below avg | Not quite keeping up |
| 50 | Average | League-average QB play (by design) |
| 60-69 | Good | Solid, winning-level play |
| 70-79 | Great | Top-tier performance |
| 80+ | Elite | MVP-caliber |
For current 2026 season leaders, ESPN maintains a live leaderboard: https://www.espn.com/nfl/qbr
Over a full season, the metric does a strong job separating elite quarterbacks from average ones. Single-game scores are noisier, and that's where most fan frustration comes from.
QBR vs Passer Rating
These two stats get confused constantly, but they're measuring fundamentally different things.
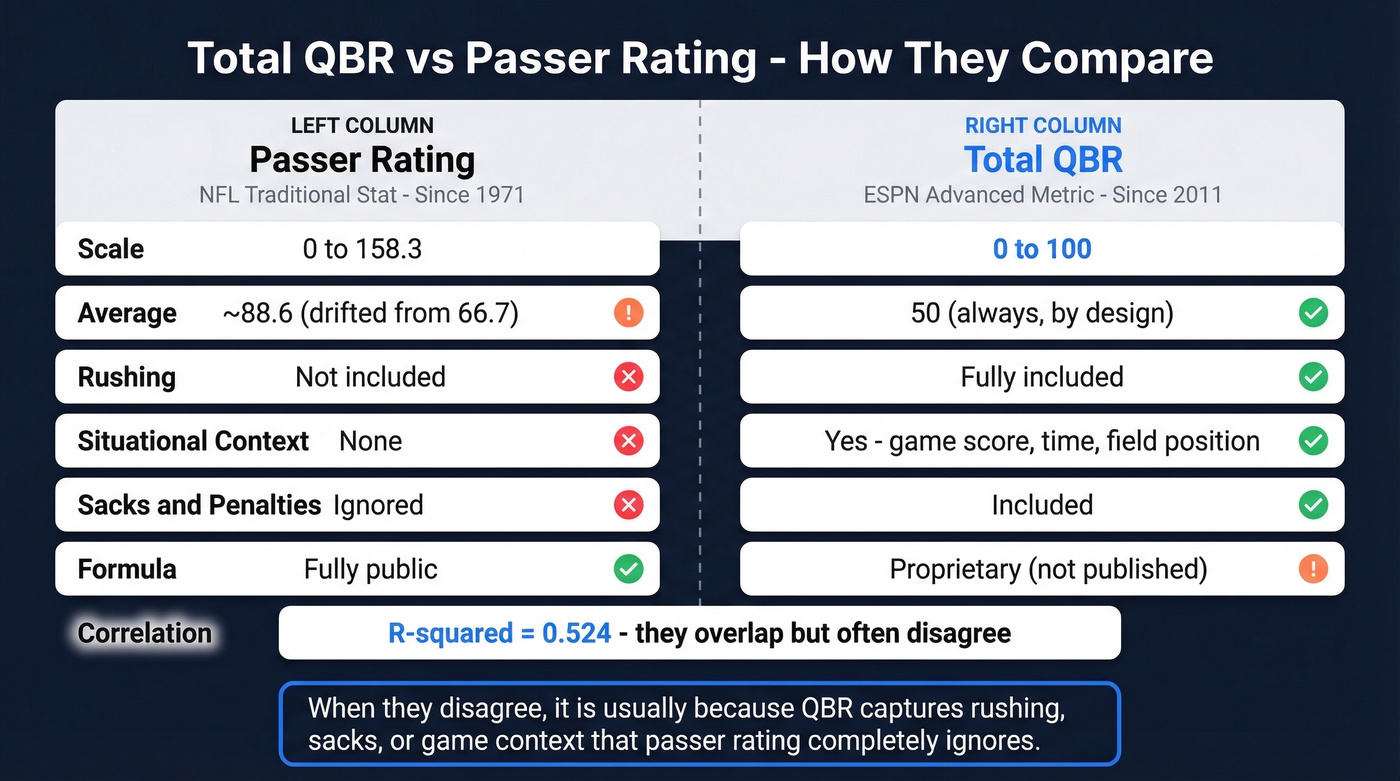
| Feature | Passer Rating | Total QBR |
|---|---|---|
| Scale | 0-158.3 | 0-100 |
| Average | ~88.6 (2021) | 50 (by design) |
| Components | Comp%, yards, TDs, INTs | Play value (EPA) across pass, rush, sacks, penalties |
| Includes rushing | No | Yes |
| Situational context | No | Yes |
| Creator | NFL (Don Smith) | ESPN |
| Year introduced | 1971 | 2011 |
| Formula public | Yes | No (proprietary) |
Passer rating was designed in 1971 so that an average QB would score about 66.7. By 2021, the league average had inflated to 88.6 - about a 22-point drift that makes the scale increasingly less intuitive. A "100 passer rating" used to be excellent. Now it's only slightly above average.
The two metrics correlate at an R-squared of 0.524, meaning they overlap a lot but still diverge often. When they diverge, it's usually because QBR captures rushing, sacks/penalties, or situational context that passer rating ignores entirely.
Is QBR a Good Stat?
The criticism is real, and it's mostly about one thing: transparency.
Against QBR: ESPN doesn't publish the full formula. Fans regularly point to games where a QB with better box-score numbers gets a lower rating, and without a public formula, it's hard to explain the "why" in a way that satisfies anyone. The Tim Tebow debates in 2011 gave the metric an early credibility problem it's never fully shaken, even though Tebow actually ranked low in the final season numbers.
For QBR: It correlates strongly with winning and is often argued to track wins better than passer rating. The "clutch-weighting" criticism is largely a myth - only low-leverage garbage time gets discounted, not "clutch" moments.
Here's the thing: QBR is imperfect but genuinely more useful than passer rating for evaluating quarterback impact. If ESPN published the full methodology, half the complaints would disappear overnight.
A great QBR needs great data. If your quarterly reviews keep surfacing the same pipeline gaps, the problem isn't the meeting - it's the data feeding it. Prospeo gives sales teams 300M+ verified profiles with 98% email accuracy, so your next QBR shows real pipeline growth, not excuses.
Stop presenting bounce rates. Start presenting booked meetings.
QBR in Business: Quarterly Business Reviews
So what's a QBR in business? A Quarterly Business Review is a strategic meeting held every three months to evaluate performance, align teams on objectives, and plan the upcoming quarter. In the simplest terms: it's the meeting where you figure out what's working, what isn't, and what to do about it.
We've sat through dozens of QBRs that were glorified status updates - slide decks full of green traffic lights that told leadership nothing useful. If your customer or your leadership team dreads the meeting, you're doing it wrong.
Most companies don't need more QBRs. They need better ones. A single well-run review with the right stakeholders and honest data will outperform four quarterly check-ins where everyone nods along to vanity metrics.
How to Run a Great QBR
Send the agenda in advance. Aim to keep the meeting tight - around 45-60 minutes works well for most teams. Structure it around these sections:
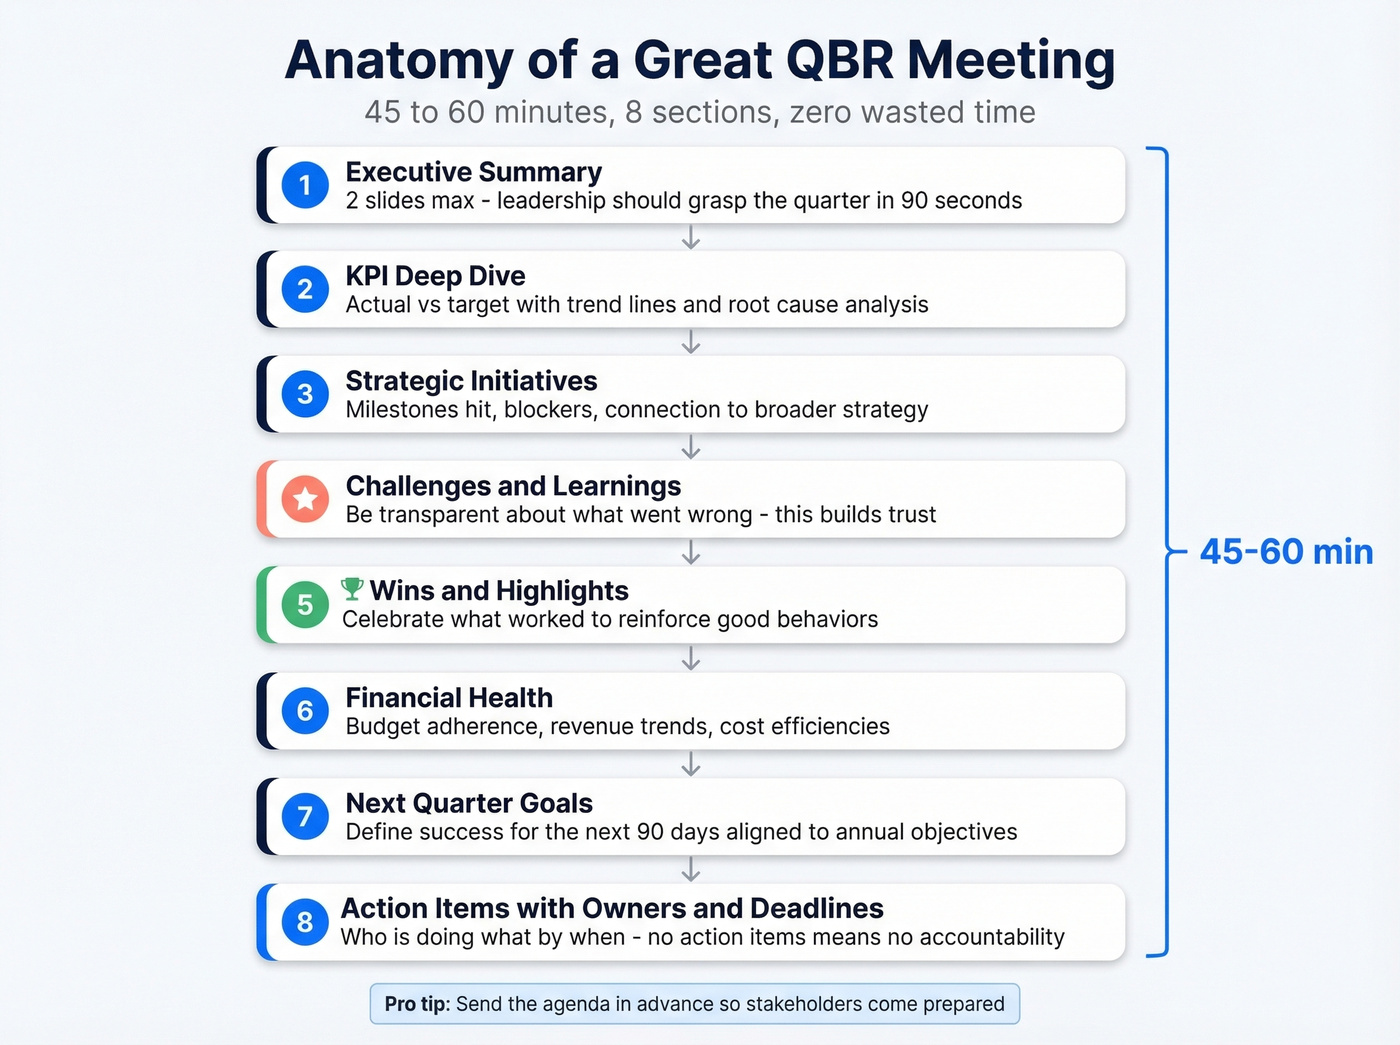
Executive summary - Top-line results vs. goals. Two slides max. If leadership can't grasp the quarter in 90 seconds, you've already lost them.
KPI deep dive - Actual vs. target for your core metrics, with trend lines and root-cause analysis for anything off track. Don't just show the numbers - explain why they moved.
Strategic initiatives - Progress on major projects. Milestones hit, blockers encountered, and how each initiative connects to the broader strategy.
Challenges and learnings - This is where trust gets built. Be transparent about what went wrong. A review that only shows wins is one nobody believes.
Wins and highlights - Celebrate what worked. This reinforces the behaviors and strategies worth repeating.
Financial health - Budget adherence, revenue trends, cost efficiencies. Keep it tight.
Next quarter goals - Define what success looks like for the next 90 days, aligned to annual objectives.
Action items with owners and deadlines - Every meeting should end with a list of who's doing what by when. No action items means no accountability.
What to Measure in a Business QBR
The metrics you track depend on whether you're running an internal review or a customer-facing one, but the categories stay consistent. Here's a framework adapted from DemandFarm's QBR guide:
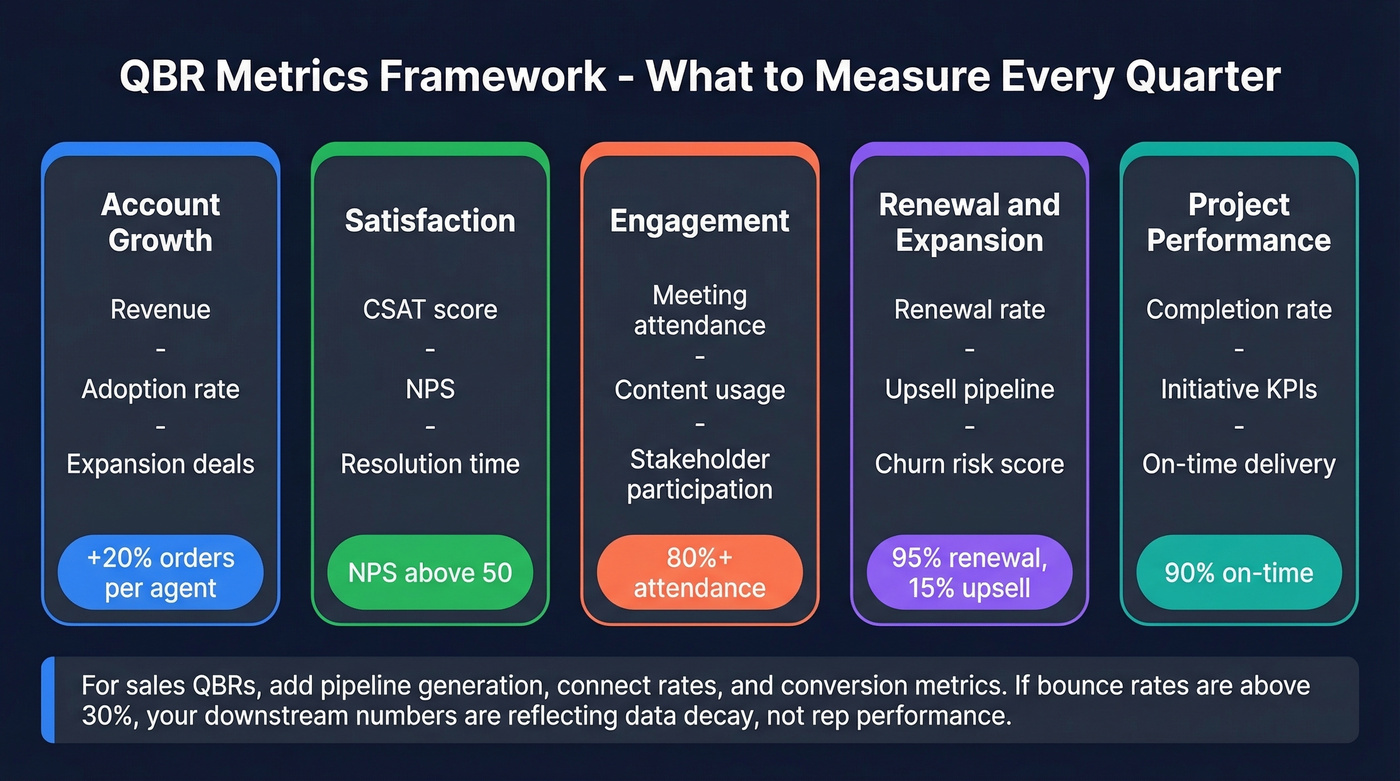
| Category | Key Metrics | Example Targets |
|---|---|---|
| Account growth | Revenue, adoption, expansion | +20% orders/agent |
| Satisfaction | CSAT, NPS, resolution time | NPS above 50 |
| Engagement | Meeting attendance, content use | 80%+ stakeholder attendance |
| Renewal/expansion | Renewal rate, upsell pipeline | 95% renewal, 15% upsell |
| Project performance | Completion rate, initiative KPIs | 90% on-time delivery |
For sales-focused QBRs, the metrics shift to pipeline generation, connect rates, and conversion. One pattern we've seen repeatedly: pipeline metrics look weak not because reps aren't working, but because the underlying contact data is stale. When bounce rates sit above 30%, every downstream number suffers - connect rates, meetings booked, pipeline generated. Tools like Prospeo that refresh data every 7 days fix that root cause so the numbers you present actually reflect rep performance rather than data decay.
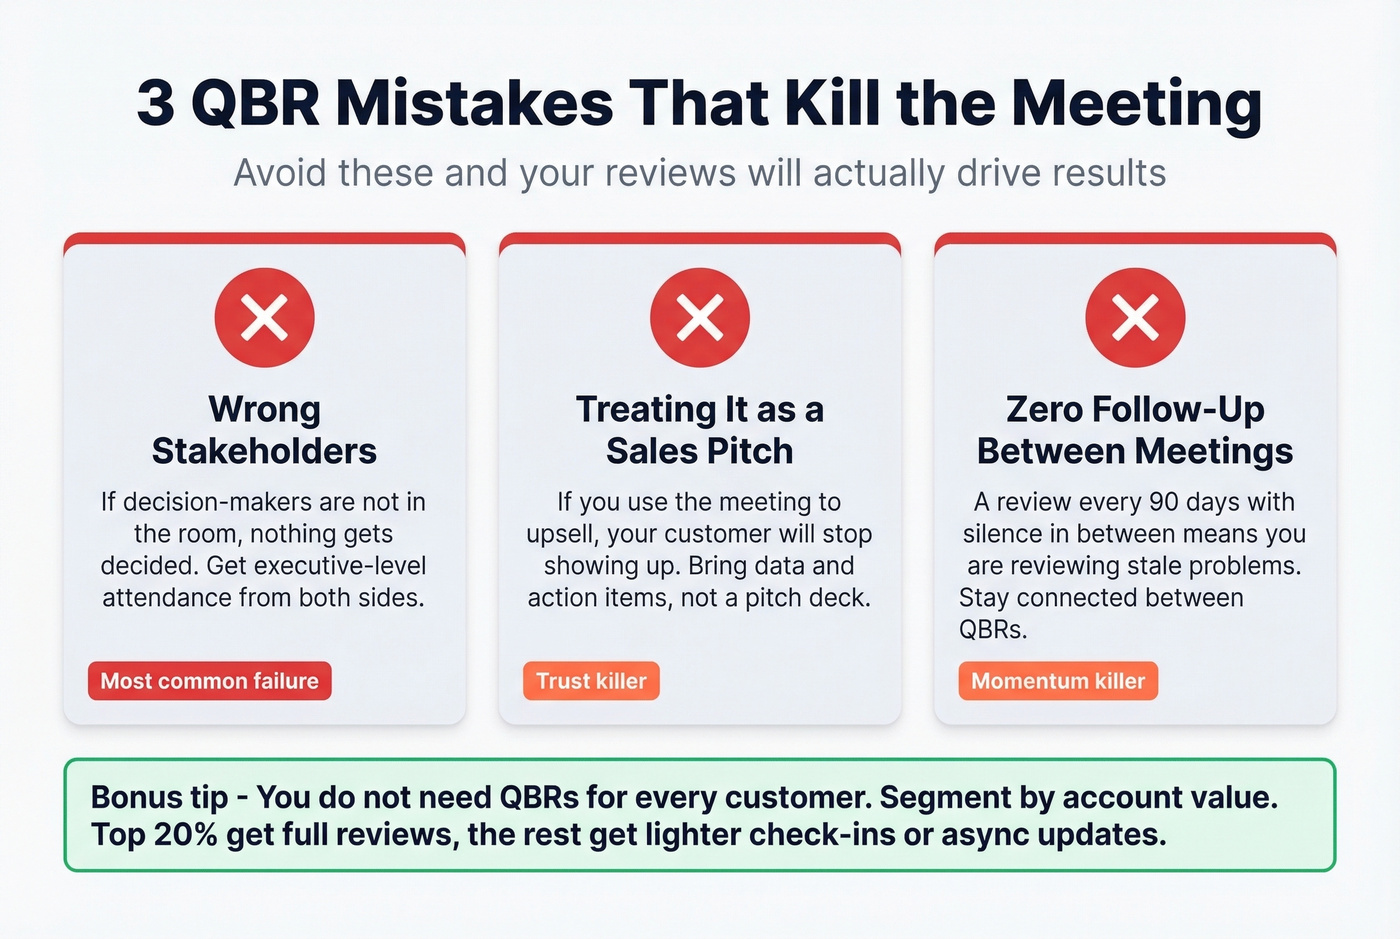
Common QBR Mistakes
The most common failure? Wrong stakeholders in the room. If decision-makers aren't present, nothing gets decided. Get executive-level attendance from both sides.
Beyond that, watch out for these:
- Treating it as a sales pitch. If you're using the meeting to upsell, your customer will stop showing up. A review without data and action items is a wasted hour.
- Zero follow-up between meetings. A review every 90 days with silence in between means you're reviewing stale problems by the time you sit down again.
- Running QBRs for every customer. Skip this if you don't have the bandwidth. Segment by account value: your top 20% get full reviews, the rest get lighter check-ins or async updates.
QBRs for SaaS and Customer Success
In SaaS, quarterly business reviews are the backbone of customer success strategy. The best ones bring executive-level stakeholders from both sides of the table - leaders who can actually make decisions, not just the CSM and their day-to-day contact.
Segmentation is non-negotiable. Prioritize your highest-value accounts and your highest-risk ones. For mid-tier accounts, lighter monthly check-ins work fine. Some teams are moving toward async QBRs - concise written business reports delivered at regular intervals, with a larger live review reserved for about three months before renewal. This works especially well for customers who find live meetings disruptive or who are spread across time zones.
For your largest accounts, consider upgrading to an EBR (Executive Business Review), which focuses on strategic alignment rather than operational metrics. A QBR asks "how are we performing?" An EBR asks "are we aligned on where this partnership is going?" One underused tactic: include benchmarking data showing how the customer compares to their peers. Nothing motivates action like seeing how similar companies are using the same product more effectively.
The best QBR metric is pipeline created. Teams using Prospeo book 26% more meetings than ZoomInfo users and 35% more than Apollo - with emails at $0.01 each and a 7-day data refresh cycle. Walk into your next quarterly review with numbers that actually move.
Make next quarter's QBR the one where leadership stops asking questions.
Other Meanings of QBR
Beyond football and business, QBR pops up in a few niche contexts:
- Question-Based Review - An FDA regulatory process for evaluating drug applications using targeted questions rather than full reviews.
- Quarterly Budget Report - A financial summary published every quarter, common in government agencies.
- Queen's Baton Relay - The Commonwealth Games equivalent of the Olympic torch relay.
- Query Based Reporting - Reports generated from database queries rather than static templates.
Unless you're in pharma regulation or Commonwealth sports, you're looking for one of the two main definitions above.
FAQ
What does QBR stand for?
QBR stands for Total Quarterback Rating (ESPN's 0-100 football metric) or Quarterly Business Review (a strategic meeting held every 90 days). In football, 50 is average; in business, it's where teams assess performance and set next-quarter goals. Less common meanings include Question-Based Review (FDA) and Quarterly Budget Report.
What's a good QBR score in the NFL?
A score of 50 is average by design. Anything above 60 is good, 70+ is great, and 80+ is elite - typically MVP-caliber play. Below 40 means the quarterback hurt his team's chances. Full-season scores are more reliable than single-game results, which can be noisy.
How often should you run a business QBR?
Most companies run full QBRs every three months for their top 20% of accounts by revenue. Mid-tier accounts get lighter monthly check-ins. Running quarterly reviews for every customer wastes time - segment by account value and renewal risk to focus effort where it drives the most retention and expansion.
How do you improve pipeline metrics before a QBR?
Start with data quality. Bad contact data and high bounce rates drag pipeline numbers down regardless of rep effort. Cleaning your database and verifying emails before the quarter closes means the metrics you present reflect actual pipeline health rather than data rot.
What's the difference between a QBR and an EBR?
An EBR (Executive Business Review) involves more senior stakeholders and focuses on strategic partnership alignment, while a QBR covers operational metrics and tactical performance. Companies typically reserve EBRs for their largest accounts and use standard quarterly reviews for the rest. The distinction is scope and seniority, not format.