Return on Sales vs Operating Margin: Same Thing or Not?
You're studying for the CFA, pulling up Investopedia, and the page says ROS uses EBIT while operating margin uses operating income. Then you check Wikipedia, which defines ROS as both operating income/revenue and net profit/revenue - on the same page. A CFA candidate on Reddit can't figure out whether operating profit equals EBIT or EBITDA. The return on sales vs operating margin debate is genuinely broken across sources, and it's not your fault if you're confused.
Let's sort it out.
The Formulas, Side by Side
| Return on Sales (ROS) | Operating Margin | |
|---|---|---|
| Numerator | EBIT | Operating Income (GAAP) |
| Denominator | Net Sales | Revenue |
| Formula | EBIT / Net Sales | Operating Income / Revenue |
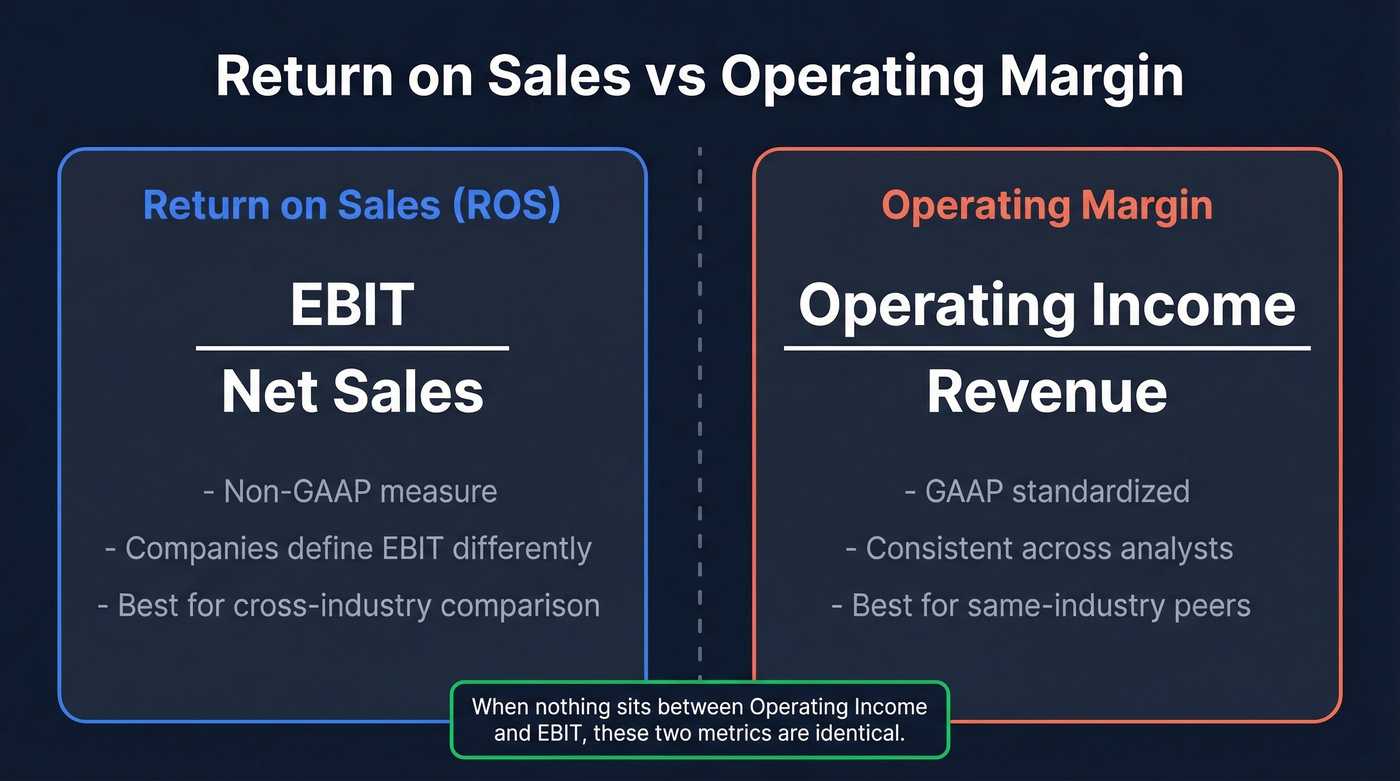
Investopedia frames it this way: both ratios measure profitability from core operations, and they're "often used interchangeably." The difference lives entirely in the numerator - what counts as the profit figure on top.
The GAAP Split
Operating income is a GAAP measure. It shows up as a line item on the income statement, and everyone calculates it the same way.
EBIT is a different animal. Neither GAAP nor IFRS explicitly defines it. Companies and data providers calculate it themselves, which means two analysts looking at the same company can arrive at different EBIT figures depending on which adjustments they make. Becker's CPA prep material defines the ROS numerator as "income before interest income, interest expense, and taxes" - an EBIT-based definition that carries real weight in professional education.
When there's nothing sitting between operating income and EBIT - no other operating/non-operating income, no special charges being folded in - the two numbers are identical. In many real-world cases they end up close, which is exactly why so many sources treat them as synonyms.
When Do They Actually Diverge?
Here's where it gets interesting. EBIT often adjusts operating income for items that don't fit neatly into "core operations" but still land above the interest and tax lines: restructuring charges, gains on asset sales, legal settlements, equity-method affiliate income, FX gains or losses on financing activities.
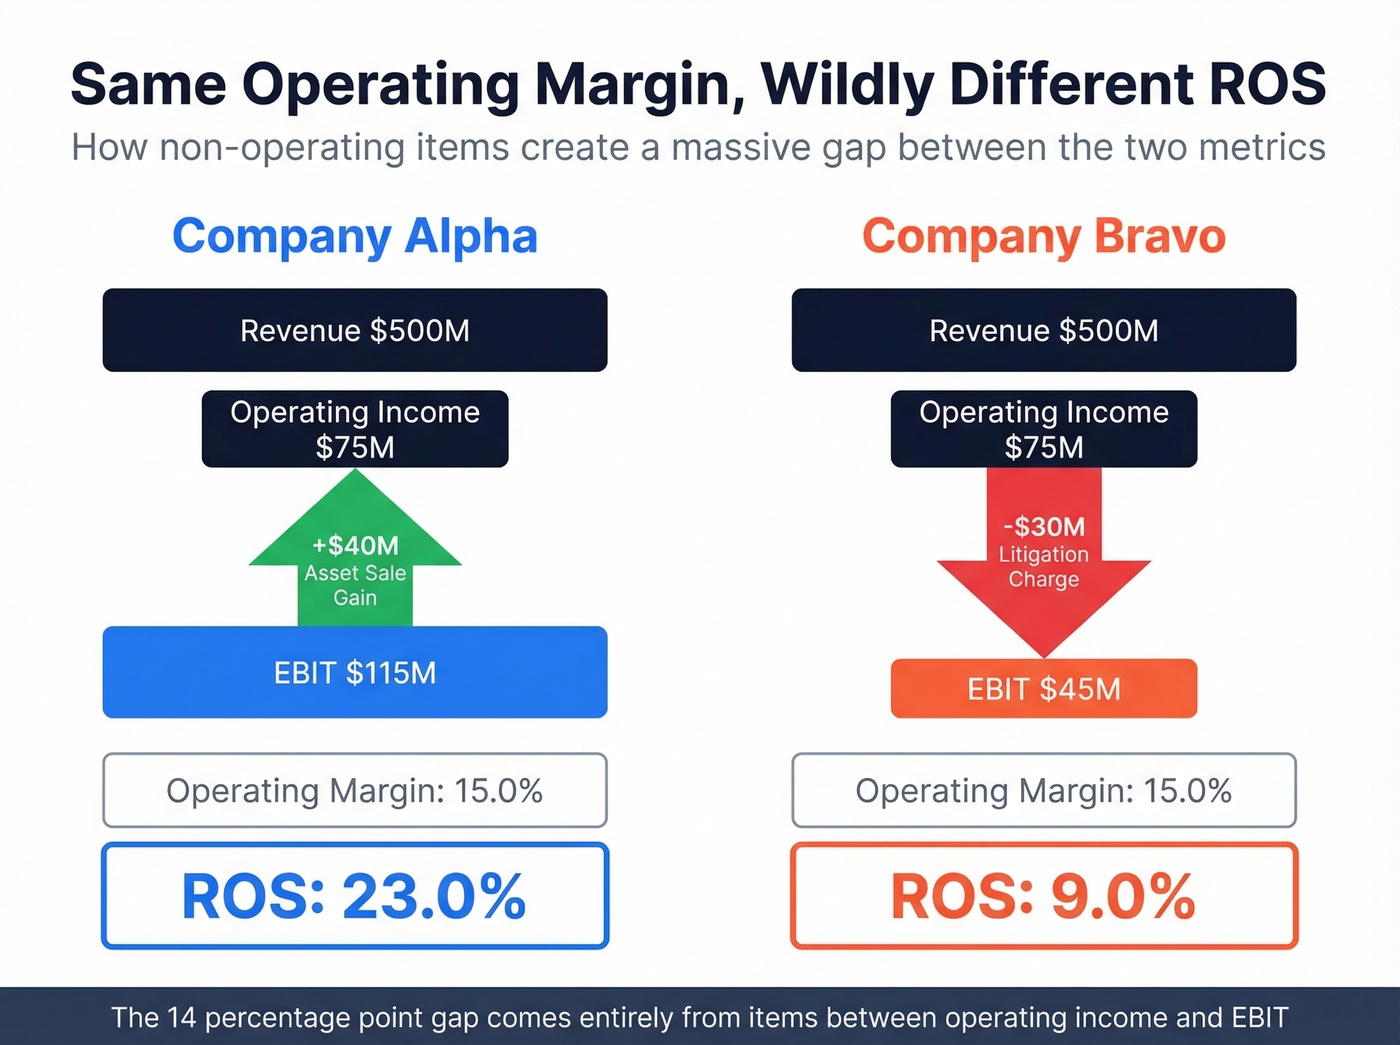
We've built a quick example to make the gap concrete:
| Company Alpha | Company Bravo | |
|---|---|---|
| Revenue | $500M | $500M |
| Operating Income | $75M | $75M |
| Gain on Asset Sale | +$40M | - |
| Litigation Charge | - | -$30M |
| EBIT | $115M | $45M |
| Operating Margin | 15.0% | 15.0% |
| ROS (EBIT-based) | 23.0% | 9.0% |
Same operating margin. Wildly different ROS. If you pulled ROS from one data provider and operating margin from another, you'd get conflicting numbers - not because you made an error, but because the providers used different numerators. This isn't hypothetical. Any company running a large restructuring or divesting a business unit can show a material wedge between the two metrics.
Benchmarking operating margins across industries is step one. Step two is reaching decision-makers at the companies that hit your thresholds. Prospeo's B2B database lets you filter 300M+ profiles by revenue, industry, headcount growth, and 30+ other criteria - then delivers 98% accurate emails so your outreach actually lands.
Go from margin analysis to verified prospect list in under five minutes.
Why Definitions Conflict Across Sources
Wikipedia's operating margin page calls ROS a synonym for operating margin (operating income / revenue), then separately defines ROS as "net profit as a percentage of sales revenue." That's two contradictory definitions on one page. Lendio's profitability guide goes further, explicitly calling net profit margin "the return on sales ratio."
It gets worse in specialized fields. Transfer pricing practitioners using the Transactional Net Margin Method group "Operating Margin (or Net Profit Margin/Return on Sales)" as a synonym cluster. Finance subreddits regularly surface this exact confusion - the CFA candidate thread above is a perfect example.
Here's the thing: most finance glossary pages treat these as either identical or vaguely different. Both positions are incomplete. They're identical only when there's nothing between operating income and EBIT in the way the metric is being calculated. Once non-operating items creep in, the gap can be enormous.
2026 Industry Benchmarks
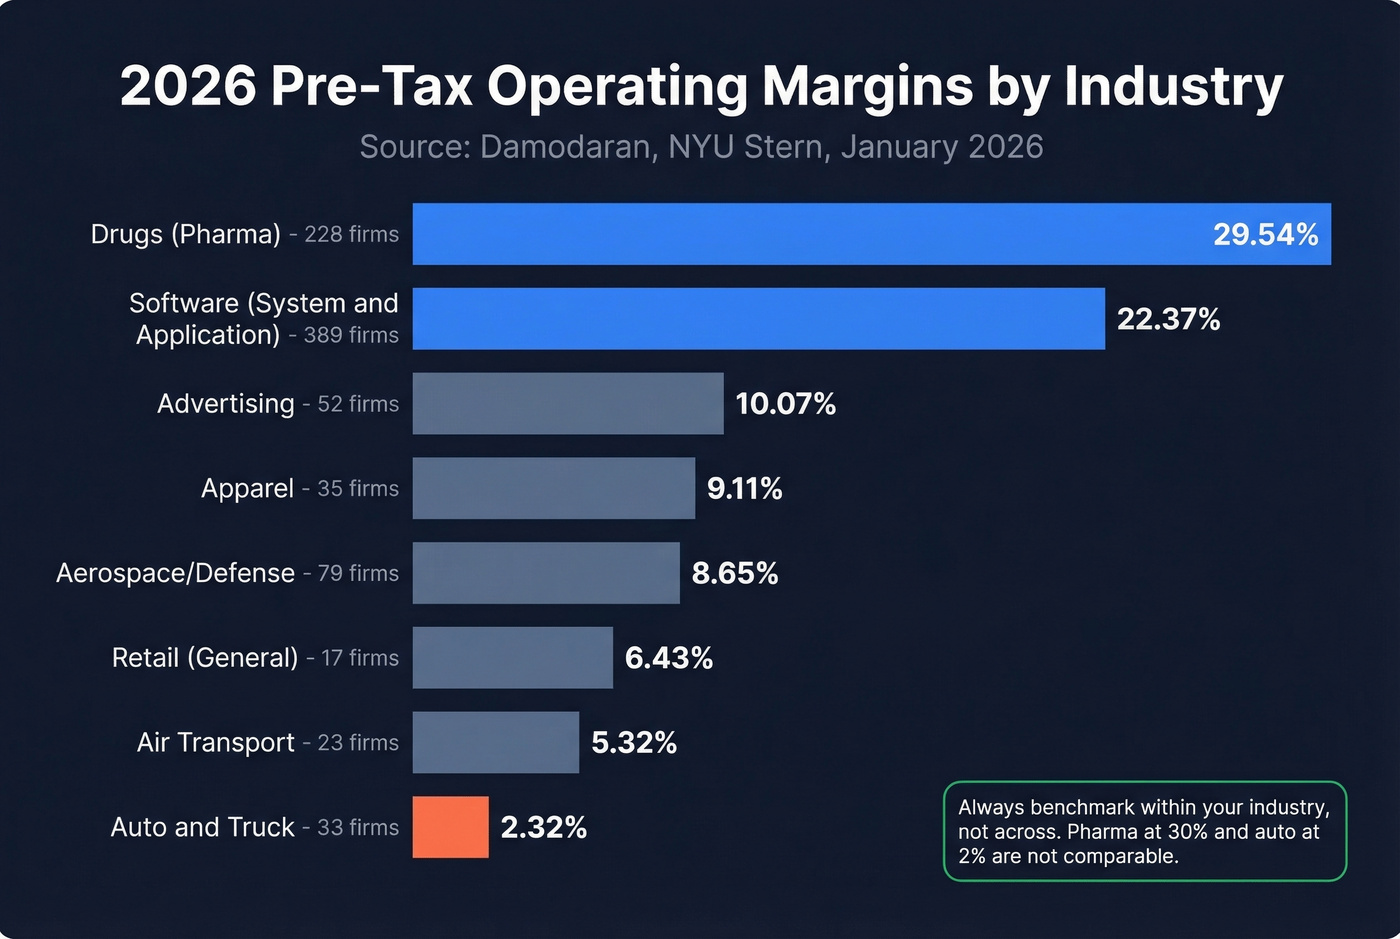
Knowing the formula matters less than knowing what "good" looks like. Damodaran's NYU Stern dataset (January 2026) is the gold standard for industry operating margins. We've pulled eight industries to show the range:
| Industry | Firms | Pre-Tax Operating Margin |
|---|---|---|
| Drugs (Pharma) | 228 | 29.54% |
| Software (System & Application) | 389 | 22.37% |
| Advertising | 52 | 10.07% |
| Apparel | 35 | 9.11% |
| Aerospace/Defense | 79 | 8.65% |
| Retail (General) | 17 | 6.43% |
| Air Transport | 23 | 5.32% |
| Auto & Truck | 33 | 2.32% |
Pharma at ~30% and auto at ~2% aren't comparable. Always benchmark within your industry, not across.
If your company's operating margin is within two percentage points of your industry median, stop obsessing over which profitability ratio to use. The choice between ROS and operating margin won't change your strategic decisions. The gap between your margin and your best competitor's margin will.
Which Metric Should You Use?
GAAP reporting or same-industry peer comparison - go with operating margin. It's standardized and widely comparable within a sector.
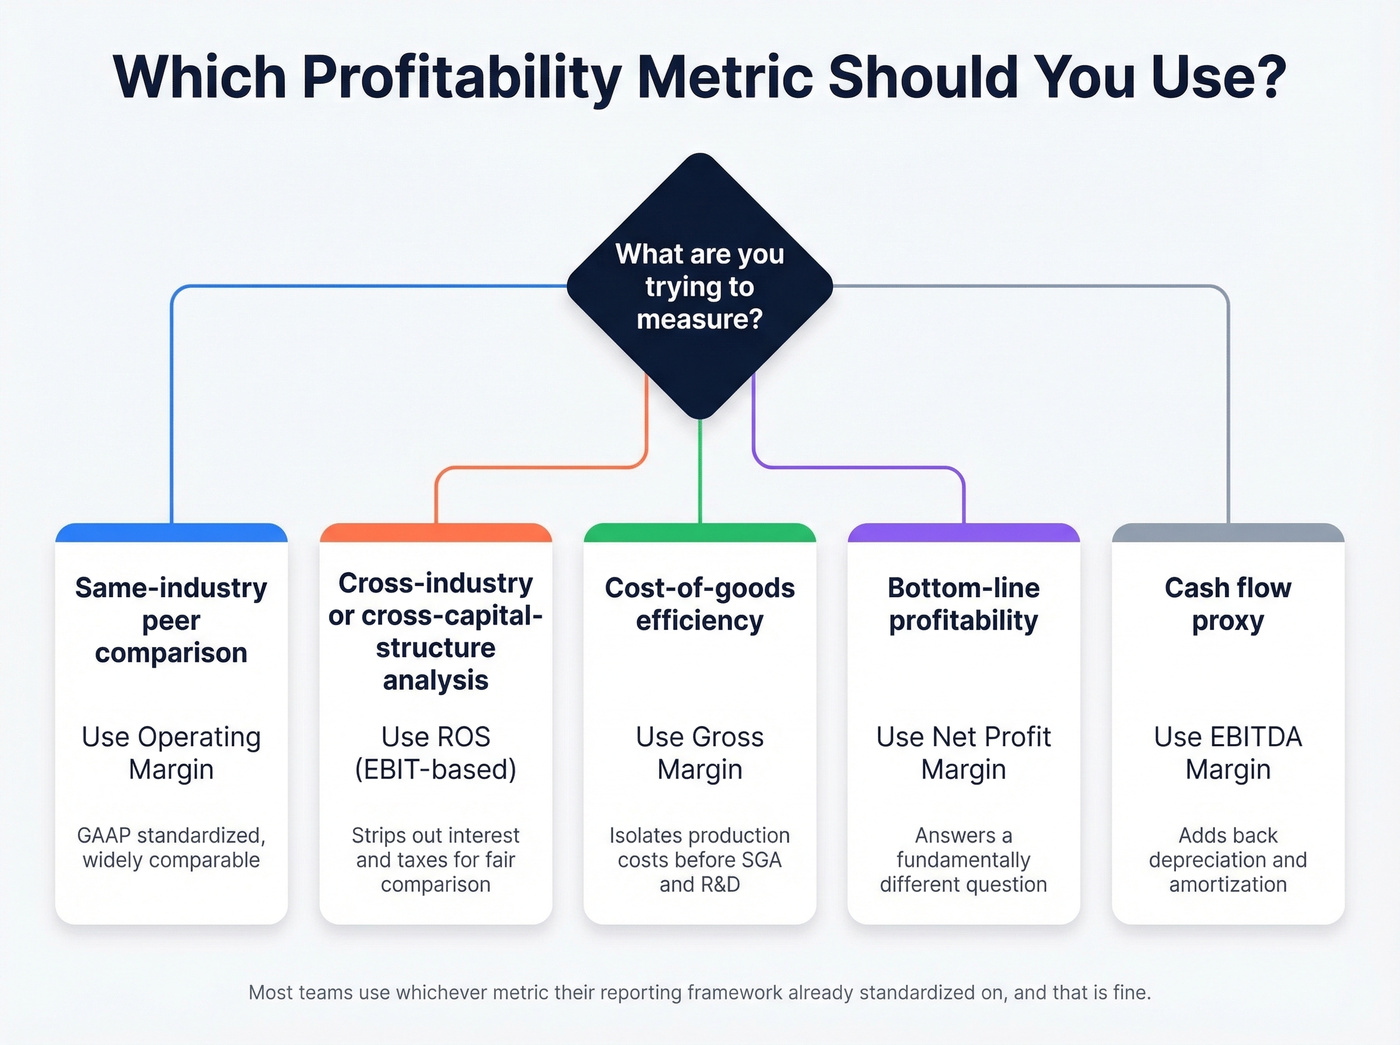
Cross-industry or cross-capital-structure analysis - ROS (EBIT-based) is better. Stripping out interest and taxes makes companies with different debt loads more comparable.
For cost-of-goods efficiency, you want gross margin, which isolates production costs before SG&A and R&D. For bottom-line profitability, net profit margin answers a fundamentally different question. And for a cash-flow proxy, EBITDA margin adds back depreciation and amortization - something neither operating margin nor ROS captures.
In our experience, most teams end up using whichever metric their reporting framework already standardized on, and that's fine. The distinction matters most when you're comparing companies with material items sitting between operating income and EBIT. When it matters, though, it matters a lot - we've seen analysts draw opposite conclusions about the same company because one used ROS and the other used operating margin without realizing the numerators diverged by 40%.
If you're turning margin analysis into outbound prospecting - say, targeting SaaS companies above 20% operating margins - Prospeo's B2B database lets you filter 300M+ profiles by industry, revenue, headcount growth, and 30+ other criteria to go from financial screen to verified contact list in minutes.
FAQ
Is return on sales the same as operating margin?
Nearly identical in practice. ROS uses EBIT (non-GAAP) while operating margin uses GAAP operating income. They diverge when items like asset sale gains, legal settlements, or restructuring charges sit between the two line items - or when different providers calculate EBIT differently.
What's a good return on sales ratio?
It depends entirely on sector. Damodaran's 2026 data shows pharma averaging ~30% while auto sits around 2%. A "good" ROS beats your industry median - cross-industry comparisons are meaningless.
How does ROS differ from net profit margin?
ROS uses EBIT as its numerator, measuring pre-interest, pre-tax profitability. Net profit margin uses bottom-line net income after all expenses. Some sources confusingly call net margin "ROS," but Becker's CPA prep and Investopedia use an EBIT-based definition - making them fundamentally different profitability measures.
If you're screening SaaS companies above 20% operating margins or targeting high-growth firms by revenue, you need contact data that's as precise as your financial filters. Prospeo refreshes every 7 days - not 6 weeks - so you're reaching the right people at the right companies, not bouncing off stale emails.
Stop losing deals to bad data. Emails at $0.01 each, 98% verified.