Revenue Forecast Excel Template: Free Downloads + Methods That Work
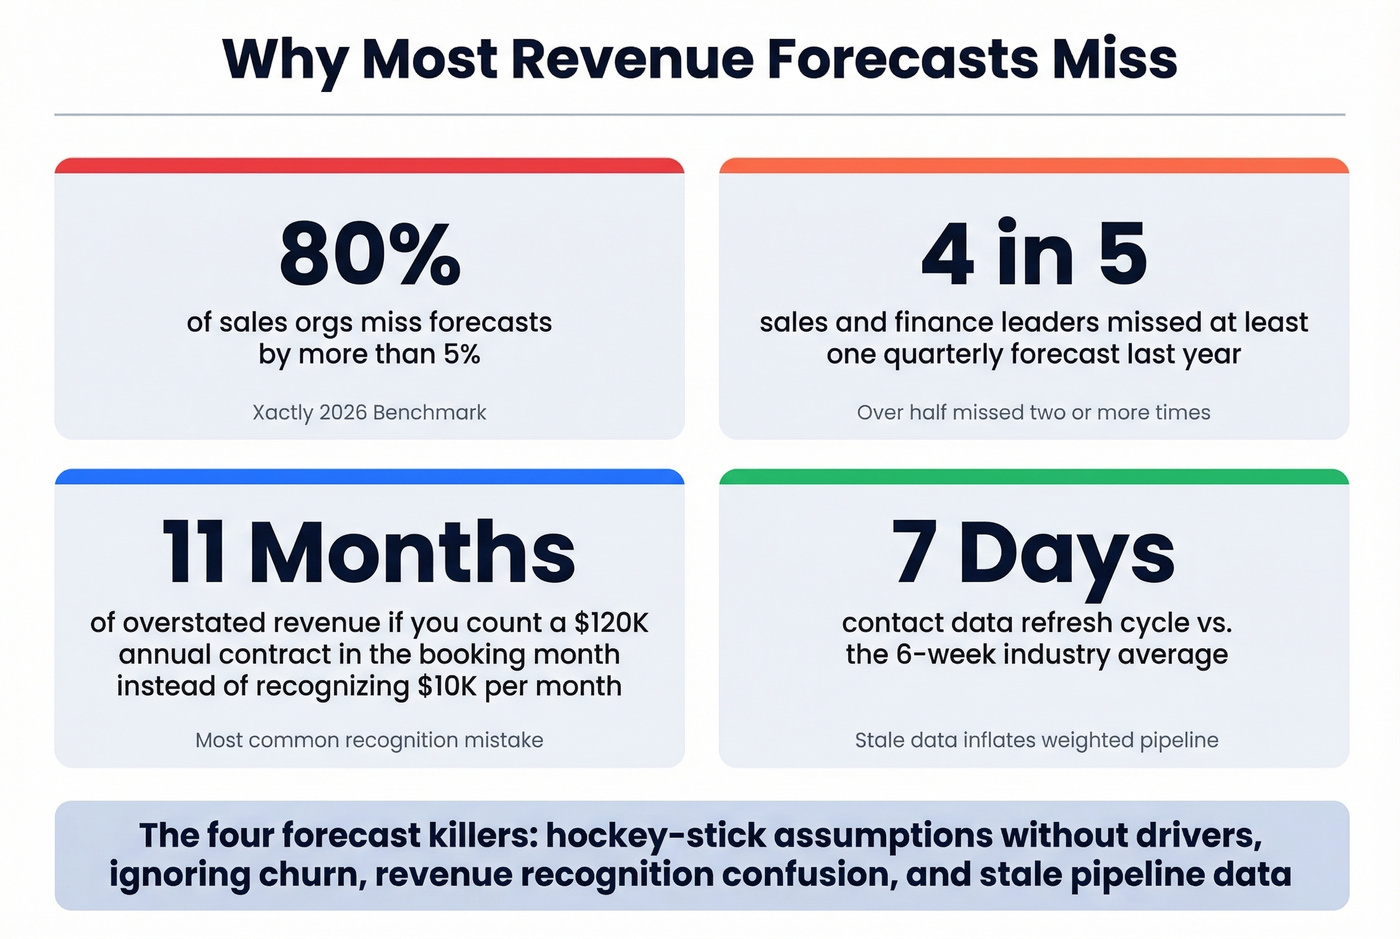
In Xactly's 2026 benchmark survey, only 20% of sales organizations hit forecasts within 5% of projections. The other 80% spent quarter-end scrambling - adjusting numbers, hedging commitments, and hoping finance wouldn't notice the gap. A revenue forecast Excel template won't fix that on its own. The problem is usually what's inside the spreadsheet: wrong method, stale data, or a structure that doesn't match the business model.
Real forecasts are messy, inherited files that evolve over time - not pristine templates you download once and forget. The goal is picking the right starting structure, then customizing it to how your business actually generates revenue. That's what this piece covers: templates, formulas, and the methodology that makes them hold up when the board starts asking questions.
What You Need (Quick Version)
You need one template, not ten - and about 30 minutes to customize it.
- B2B with a multi-stage sales cycle? Grab Gong's pipeline-weighted forecast templates. They map opportunity stages to probability-weighted revenue.
- SaaS or subscription business? Use Smartsheet's SaaS sales forecast template. MRR, churn, CAC, and LTV fields are built in.
- Simple product or retail revenue? Smartsheet's 12-month sales forecast template handles units sold x price per unit with annual totals.
Revenue Forecast vs. Sales Forecast vs. Projection
These three terms get used interchangeably, and that's where things go sideways.
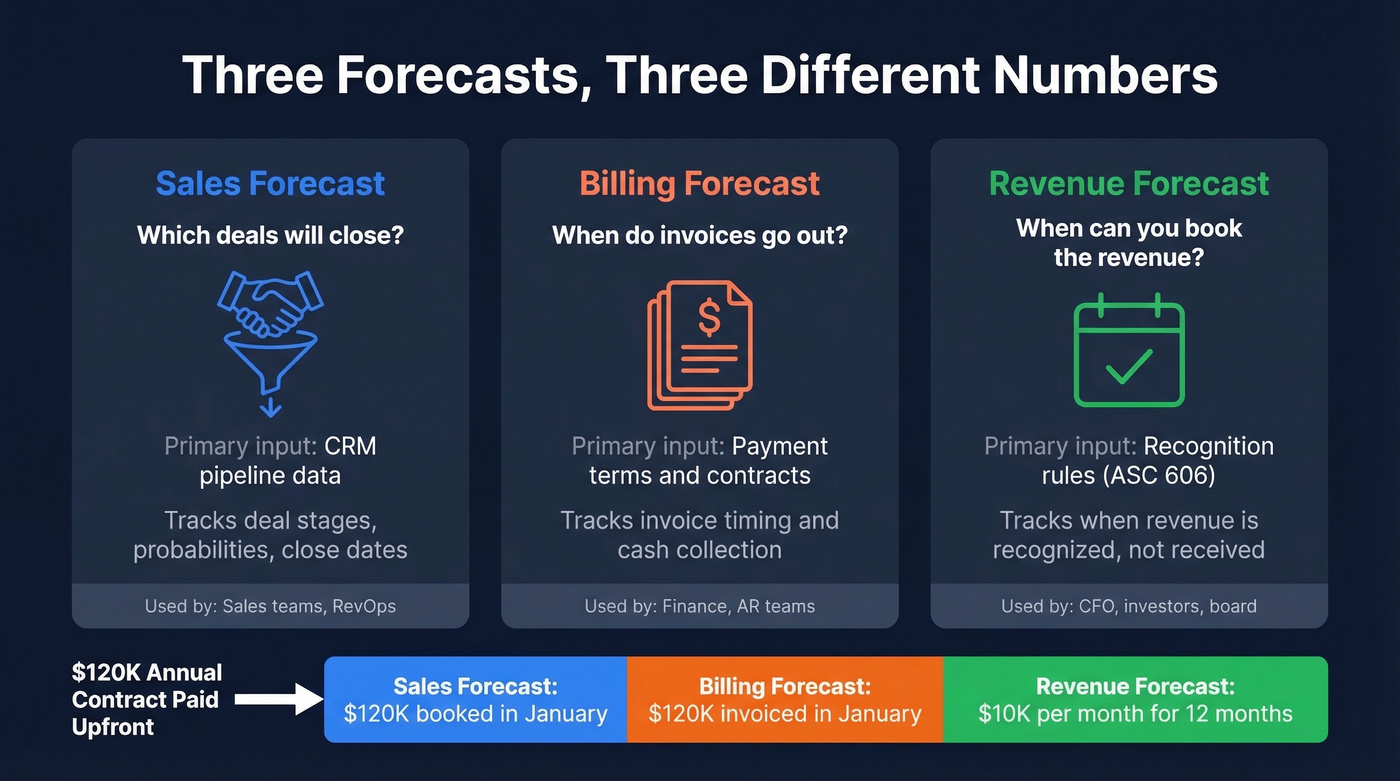
A sales forecast estimates which deals will close in a given period - your CRM is the primary input. A billing forecast projects when invoices go out and cash comes in, based on payment terms. A revenue forecast is about recognition timing: when you can actually book the revenue under accounting rules.
Here's the example that trips everyone up.
A $120K annual contract paid upfront on day one isn't $120K of revenue in January. It's $10K/month recognized over 12 months. The rest sits as deferred revenue on your balance sheet. If your template doesn't account for this, you're really building a bookings forecast - and your CFO will catch it.
Know which of these three you're building before you pick a template. Most operational teams need a sales forecast that feeds a revenue recognition schedule. Investors and finance teams care about the recognized number.
Choosing the Right Forecasting Model
Not every template works for every business. A SaaS company forecasting MRR with churn assumptions needs a completely different structure than a construction firm tracking project-based revenue by quarter.
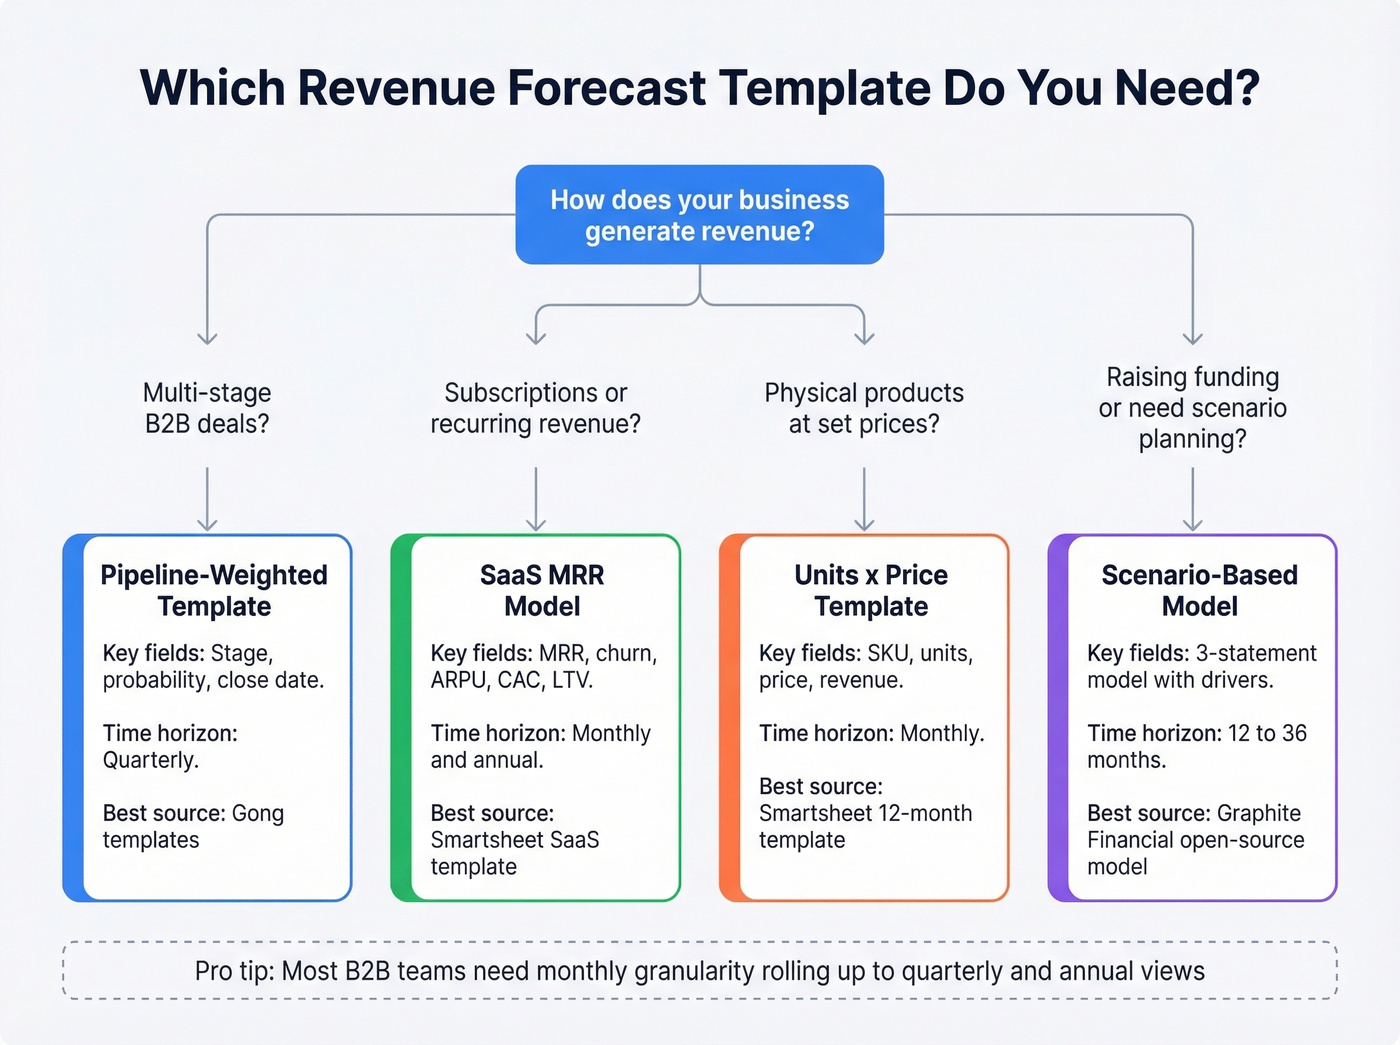
| Business Type | Template Style | Key Fields | Time Horizon |
|---|---|---|---|
| B2B pipeline | Weighted pipeline | Stage, probability, close date | Quarterly |
| SaaS/subscription | MRR model | MRR, churn, ARPU, CAC | Monthly/annual |
| Product/retail | Units x price | SKU, units, price, revenue | Monthly |
| Services/construction | Project-based | Project, stage, booked vs. potential | Quarterly/annual |
| Startup fundraising | Scenario-based | 3-statement + drivers | 12-36 months |
Zapier's taxonomy breaks forecasting spreadsheets into five types by horizon: simple, daily, monthly, 1-year, and 5-year. A daily forecast makes sense for inventory-heavy businesses with dynamic pricing. Most B2B teams should start with monthly granularity rolling up to quarterly and annual views.
The real decision isn't which template looks nicest. It's matching the structure to how your business generates and recognizes revenue.
Free Templates Worth Downloading
Pipeline-Weighted Forecast (Gong)
Use this if you're B2B with a multi-stage sales cycle. Gong's templates include weighted pipeline calculators and coverage views built around a simple method: multiply the deal value in a stage by its win probability to get expected revenue. A $50K deal at 40% shows as $20K of weighted pipeline.
Customize the probability percentages per stage to match your actual conversion rates. That's where most teams introduce error on day one - they leave the default probabilities untouched and wonder why the forecast drifts.
SaaS Revenue Forecast (Smartsheet)
Smartsheet's SaaS template goes deeper than a generic pipeline tracker. It has built-in fields for MRR, churn rate, CAC, LTV, tier breakdowns, and net revenue retention. If you're running a subscription business and your template doesn't account for churn and expansion, you're building fiction. This is the best free starting point we've found for SaaS teams that haven't yet invested in a dedicated forecasting tool.
We've used it internally as a baseline and found the churn modeling especially useful - though you'll want to add a tab for expansion revenue if your pricing includes usage-based components.
Simple 12-Month Template (Smartsheet)
For businesses selling products at known price points, Smartsheet's 12-month template keeps it clean: monthly units sold x price per unit = total revenue, with annual totals across product lines. No frills, no SaaS metrics. Just revenue math that works in both Excel and Google Sheets.
Scenario-Based Forecast (Build Your Own)
No single-sheet forecast survives contact with reality. Duplicate your chosen template into three tabs - best case, base case, worst case - and tie each scenario to different assumptions. Best case might use a 35% close rate and 2% monthly churn. Worst case drops to 20% close rate and 6% churn. The spread between scenarios is what your CFO actually wants to see.
Investor-grade models go further, linking income statement, balance sheet, and cash flow with built-in error checks - Graphite Financial's open-source model is a solid reference if you need that level of rigor.
A weighted pipeline forecast is worthless if the contacts behind those deals are wrong. Prospeo gives you 300M+ profiles with 98% email accuracy and a 7-day refresh cycle - so every opportunity in your spreadsheet maps to a real, reachable buyer.
Fix your pipeline data and your forecast fixes itself.
How to Build a Revenue Forecast in Excel
Three methods dominate Excel-based revenue forecasting. Each has a sweet spot and a blind spot.
Moving Averages
Moving averages smooth out noise by averaging the last N periods. A 3-month moving average is simple: =AVERAGE(B2:B4) dragged across your timeline. Good for short-term directional reads. The limitation: moving averages can't handle seasonality. If your business has a predictable Q4 spike, a moving average will underpredict it every time.
FORECAST.ETS (Exponential Smoothing)
One of Excel's most powerful built-in forecasting functions, and most people don't know it exists. FORECAST.ETS uses exponential triple smoothing to detect seasonality and weight recent data more heavily.
The syntax: =FORECAST.ETS(target_date, values, timeline, [seasonality], [data_completion], [aggregation])
For seasonality to work well, you want at least two full seasonal cycles of historical data. Pair it with FORECAST.ETS.CONFINT to generate confidence intervals - upper and lower bounds instead of a single-point estimate are exactly what leadership needs because they communicate uncertainty honestly rather than pretending precision that doesn't exist.
Linear Regression
Linear regression models the relationship between an independent variable - marketing spend or headcount, for example - and revenue. Excel's FORECAST.LINEAR or the Analysis ToolPak handles this. Useful when you believe a specific driver predicts growth, but it assumes linearity. Revenue rarely scales in a straight line forever.
Method Comparison
| Method | Best For | Seasonality? | Data Needed | Excel Function |
|---|---|---|---|---|
| Moving average | Short-term trends | No | 3-6 months | AVERAGE |
| FORECAST.ETS | Seasonal patterns | Yes | 2+ cycles | FORECAST.ETS |
| Linear regression | Driver-based models | No | Varies | FORECAST.LINEAR |
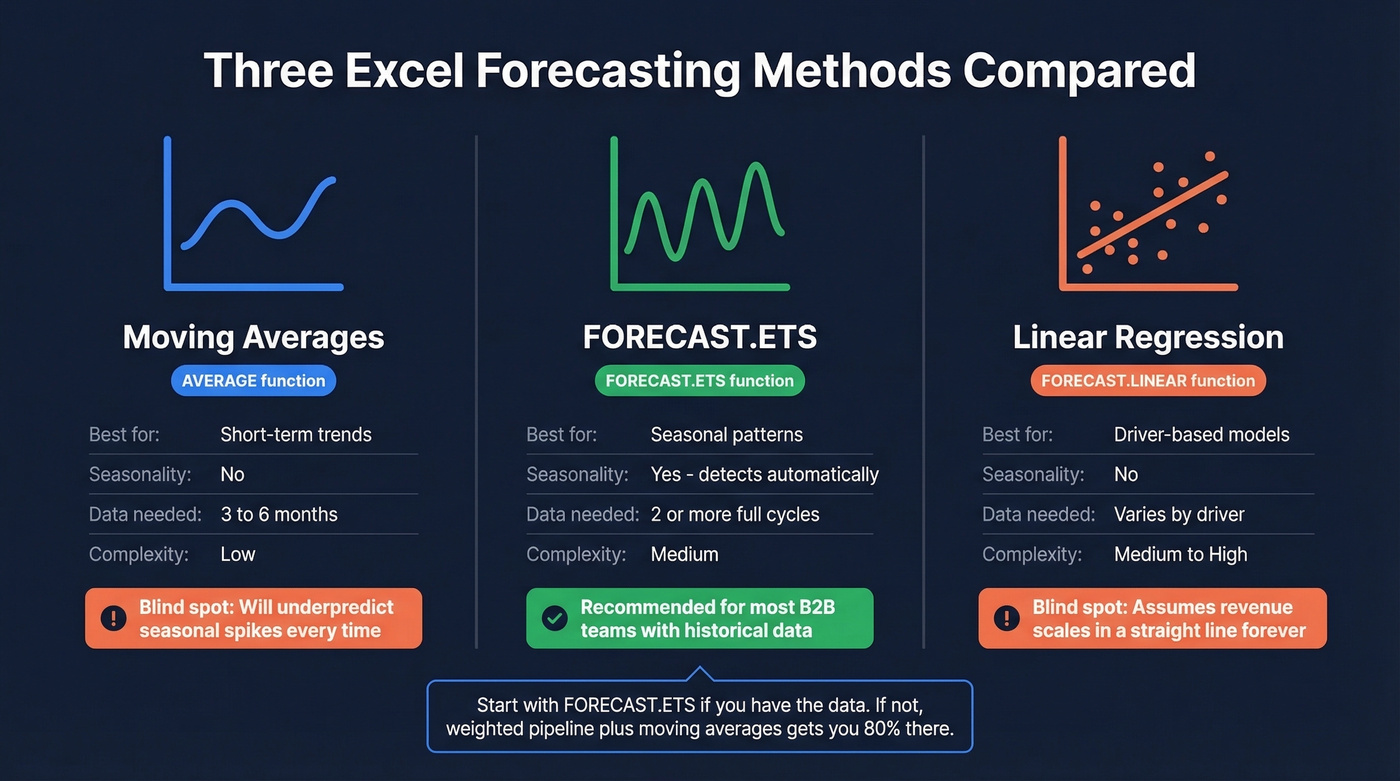
For most B2B teams, FORECAST.ETS is the right starting point if you have the historical data. If you don't, a weighted pipeline model with moving averages gets you 80% of the way there.
SaaS Revenue Forecasting
SaaS companies using a generic revenue projection template are guaranteed to get it wrong. Recurring revenue, churn, expansion, and usage variability create dynamics that a simple units-times-price model can't capture.
A solid SaaS MRR projection model needs five inputs: new customers per month, ARPU, net churn rate, current MRR, and target MRR. From these, you derive ARR (MRR x 12), LTV calculated as ARPU divided by churn rate, and a month-by-month projection curve.
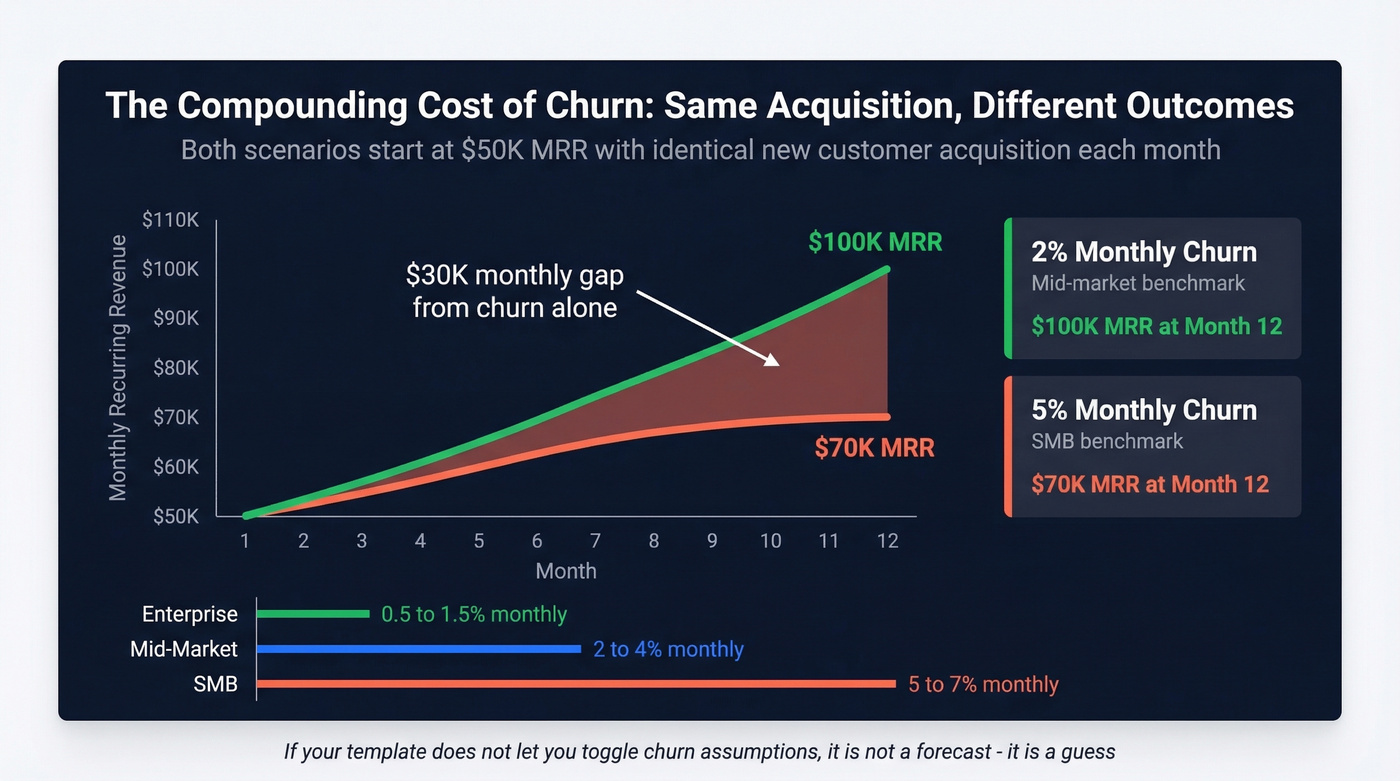
Churn is where most SaaS forecasts fall apart. Benchmarks vary dramatically by segment:
- SMB SaaS: 5-7% monthly churn
- Mid-market: 2-4% monthly churn
- Enterprise: 0.5-1.5% monthly churn
Here's the thing: the compounding effect matters more than people realize. Improving churn from 5% to 2% monthly can mean the difference between $100K MRR and $70K MRR at the 12-month mark - on identical acquisition numbers. If your template doesn't let you toggle churn assumptions and see the downstream impact, it's not a forecast. It's a guess.
Mistakes That Kill Forecast Accuracy
Four in five sales and finance leaders missed a quarterly forecast in the past year. Over half missed it two or more times. Let's break down what's going wrong.
Hockey-stick growth without drivers. Every startup forecast shows a mysterious inflection point in month 8. Tie every growth assumption to a measurable driver. If revenue doubles, show the hiring plan, close rates, and pipeline volume that make it possible.
Ignoring churn. We've seen teams project $2M ARR by year-end without a single churn assumption in the model. Use the benchmarks above and stress-test them.
Revenue recognition confusion. That $120K annual contract is $10K/month of recognized revenue. If your template counts it all in the booking month, your forecast is overstated by 11 months of deferred revenue.
Forecasting from stale pipeline data. Your forecast inherits every data quality problem in your pipeline. Stale emails and departed contacts make deals go dark and inflate your weighted pipeline. This is why data freshness matters so much - tools like Prospeo refresh contact data every 7 days versus the 6-week industry average, which means the contacts in your pipeline are current, not ghosts. Garbage in, garbage out applies to forecasting more than almost anything else in sales ops.
Building in isolation. Forecasts built by one person in a locked spreadsheet miss inputs from marketing, customer success, and finance. Monthly cross-functional reviews aren't optional - 97% of leaders agree Sales and Finance need to work better together on forecasting.
No feedback loop. If you never compare forecast to actuals, you never improve. Track forecast error by rep, segment, and stage, then adjust probability weightings quarterly.
Fragmented spreadsheets. Multiple teams maintaining separate forecast files creates version conflicts and zero real-time visibility. Only 7% of organizations achieve forecast accuracy of 90% or better. Fragmented tooling is a big reason why.
What Good Accuracy Looks Like
Here's a stat that should make you uncomfortable: 95% of leaders express confidence in their forecasting process, yet 98% acknowledge struggling to produce accurate forecasts. That confidence-accuracy gap is the real problem.
Standard benchmark bands for B2B revenue forecasting:
- 80-85%: Acceptable. You're in the ballpark.
- 85-95%: Good. Most well-run teams land here.
- 95%+: World-class. Very few organizations sustain this.
Measure accuracy using MAPE or MAE, and track forecast bias separately - are you consistently over or under? Bias tells you whether your team is optimistic or sandbagging, which is more actionable than raw error.
Even after quotas were lowered by 13.3%, 77% of sellers still missed. The problem isn't ambition - it's methodology.
Most teams don't have a forecasting problem. They have a data hygiene problem wearing a forecasting costume. Fix the inputs and a basic weighted pipeline model will outperform a sophisticated algorithm running on dirty data every single time.
When to Outgrow the Spreadsheet
Excel is where every forecast starts. It's not where every forecast should stay.
The scaling threshold is around 15-20 reps or roughly $5M+ ARR. Beyond that, spreadsheet-based forecasting breaks down: version control nightmares, manual data consolidation that eats days per month, and no real-time visibility into pipeline changes. The FP&A community on Reddit describes monthly forecasting as "a week-long exercise" when inputs come from departmental Excel trackers.
Before you jump to a $30K platform, consider intermediate steps. Power Query can automate data consolidation from multiple sources into a single Excel model. Lightweight forecasting tools run $20-$50/user/month and handle CRM integration without enterprise complexity.
Skip the platform upgrade if your forecast process works and takes less than a day per cycle. If it's eating a week and still producing numbers nobody trusts, it's time to invest. Either way, a revenue forecast Excel template is only as reliable as the pipeline data feeding it - start there.
If you're evaluating tools beyond Excel, start with a shortlist of sales forecasting solutions and compare them against your current workflow.
Forecasts drift when pipeline coverage is thin. Prospeo's 30+ search filters - buyer intent, technographics, headcount growth, funding - let you fill every stage with qualified prospects at $0.01 per verified email. Teams using Prospeo book 26% more meetings than ZoomInfo users.
More pipeline coverage means tighter forecasts. Start filling the gaps.
FAQ
How often should I update my revenue forecast?
Monthly at minimum, weekly during quarter-end. The best B2B teams run a rolling forecast that updates as CRM data changes. Weekly pipeline reviews feeding a monthly forecast cadence balances accuracy with effort for most organizations under $10M ARR.
What's the difference between top-down and bottom-up forecasting?
Top-down starts with market size and works down to your expected share. Bottom-up starts with your pipeline, deal sizes, and close rates, then builds up. Bottom-up is more accurate for operational forecasting because it's grounded in real data. Top-down is useful for investor decks and TAM analysis.
Can Google Sheets replace Excel for revenue forecasting?
For basic templates, yes - Google Sheets supports common forecasting workflows and most templates are available in both formats. Excel is stronger for built-in seasonal forecasting (FORECAST.ETS) and automated data consolidation with Power Query, making it the better choice for complex, multi-source models.
How do I make my pipeline data more accurate before forecasting?
Verify contact data first - stale emails and departed contacts inflate your weighted pipeline. Then enforce hygiene: mandatory stage updates, deal amount validation, and close-date discipline across every rep. Clean data in, reliable forecast out.