SaaS Win Rate Benchmarks: Why Every Number You've Seen Is Wrong
Your VP asked why your win rate is 19%. You pulled up five different benchmarks - 47% from one source, 21% from another, 4% from a Reddit post where someone reported 22-28% at their previous company. The problem isn't your sales team. It's that every SaaS win rate benchmark you've read is measuring something different.
The Short Version
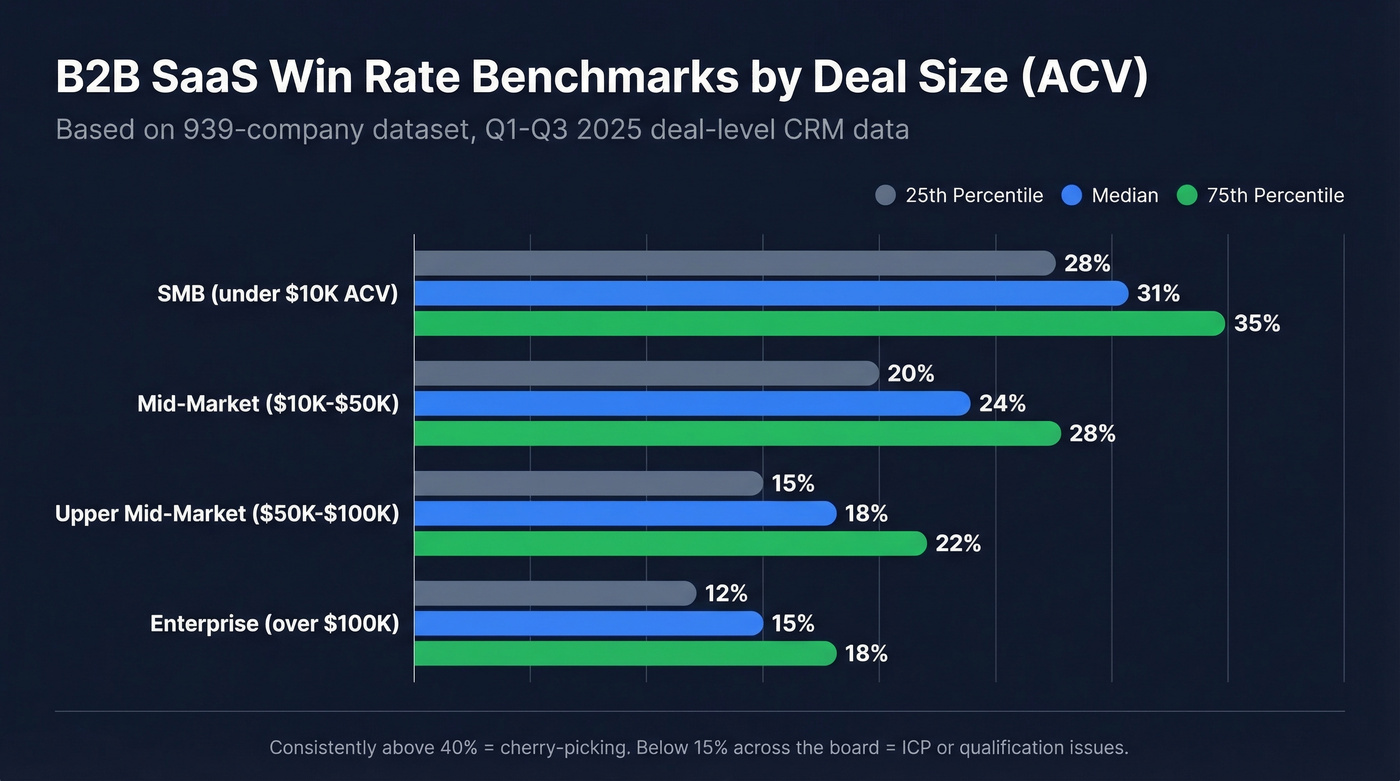
There's no single average SaaS win rate. The number depends on your denominator, ACV, and lead source. The best benchmark available - Optifai's 939-company dataset, based on Q1-Q3 2025 deal-level CRM data - shows SMB (<$10K ACV) at 28-35%, mid-market at 20-28%, upper mid-market ($50K-$100K) at 15-22%, and enterprise (>$100K) at 12-18%.
The #1 reason your win rate looks bad is how you define an opportunity - not your reps.
Why Every Benchmark Contradicts
The 47% stat that circulates everywhere comes from RAIN Group's survey of 472 sellers. The catch: their denominator is opportunities that reached the proposal stage. Most SaaS teams measure from opportunity creation, which is far earlier in the funnel.
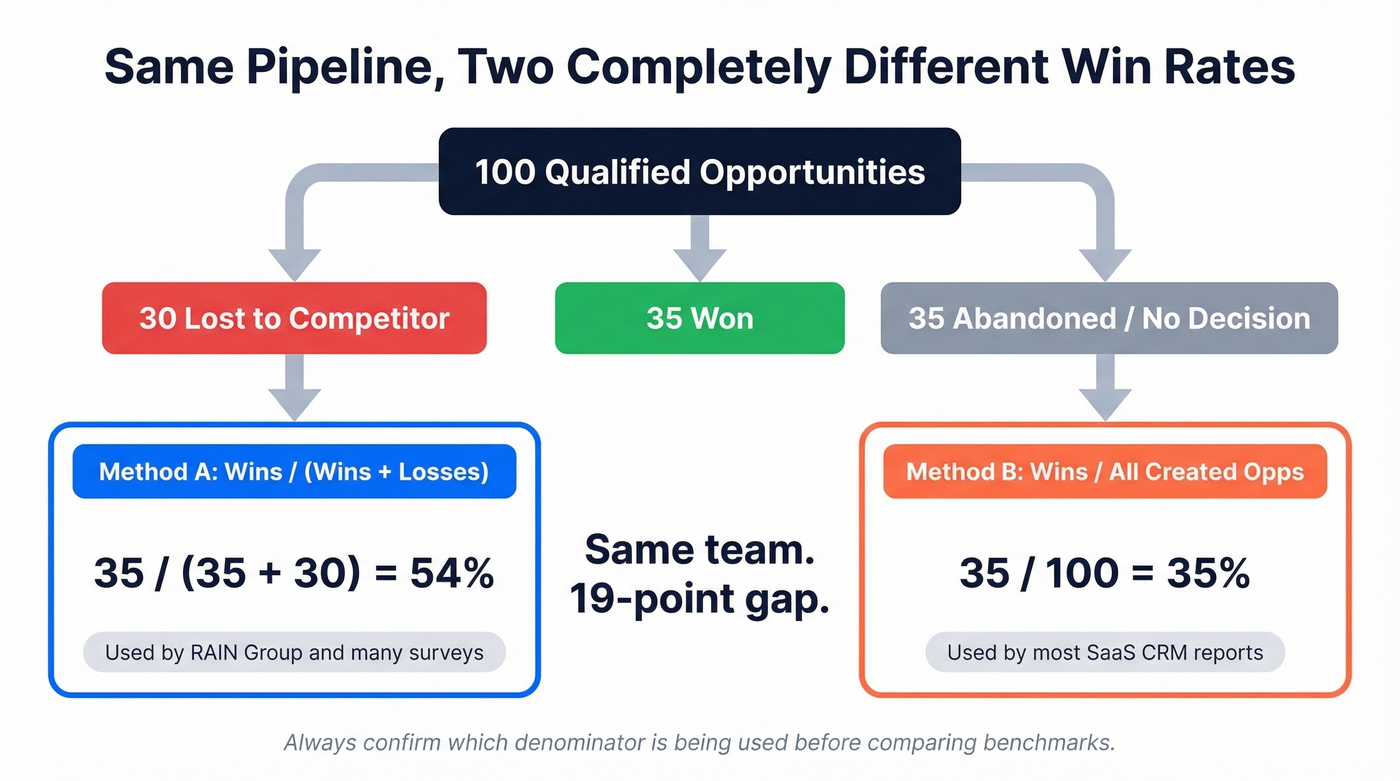
We've watched this denominator confusion derail board presentations. Membrain's framework makes it concrete: take 100 qualified opportunities where 35 are won, 30 lost to a competitor, and 35 abandoned. Wins divided by wins plus losses gives you 54%. Include abandoned deals - which you should - and you get 35%. Same pipeline, same team, two completely different numbers.
That's why quoting RAIN Group's 47% next to your 19% is comparing apples to engine blocks.
Your win rate denominator is only as real as your contact data. Every bounced email creates a phantom opportunity that drags your close rate down. Prospeo's 98% email accuracy and 7-day refresh cycle ensure every opportunity in your CRM has a valid contact behind it.
Stop benchmarking against pipeline that was never real.
Win Rate Benchmarks by Segment
B2B SaaS Win Rate by Deal Size (ACV)
This is the table that actually matters. Optifai's 2026 Pipeline Study pulled deal-level CRM data from 939 B2B SaaS companies:
| ACV Band | 25th Pctl | Median | 75th Pctl |
|---|---|---|---|
| SMB (<$10K) | 28% | 31% | 35% |
| Mid-Market ($10K-$50K) | 20% | 24% | 28% |
| Upper Mid ($50K-$100K) | 15% | 18% | 22% |
| Enterprise (>$100K) | 12% | 15% | 18% |
If you're consistently above 40%, your team is cherry-picking. Between 20-35% is healthy for most segments. Below 15% across the board signals ICP or qualification issues.
By Lead Source
Lead source matters as much as deal size when evaluating close rates:
| Source Type | Typical Win Rate |
|---|---|
| Inbound / hand-raiser | 30-40% |
| Known-contact (past champion, referral) | ~37% |
| Cold outbound | 15-20% |
| Average B2B (HubSpot 2024 report) | ~21% |
Champify's data shows known-contact deals close at 37% versus 19% for cold outreach. That 21% average is real, but it's about as useful as the average temperature on Earth - technically correct, practically meaningless.
Macro Trends
Enterprise win rates fell hard in late 2022, dropping from roughly 26% to 17% for deals above $100K ACV. Winning by Design's 2023 analysis is the reference point for that drop.
An analysis of 4.2 million opportunities confirmed the decline and shows stabilization into 2024. The freefall is over; the recovery is partial. Early 2025 data from Optifai suggests the B2B SaaS conversion rate has plateaued rather than rebounded. Teams that improved did so through process changes, not a friendlier market.
What Actually Moves Win Rate
[Gong Labs analyzed 1.8 million deals](https://www.gong.io/blog/data-shows-top-reps-dont-just-sell-they-orchestrate-with-ai) closed in 2024. Here's what separates top performers from everyone else.
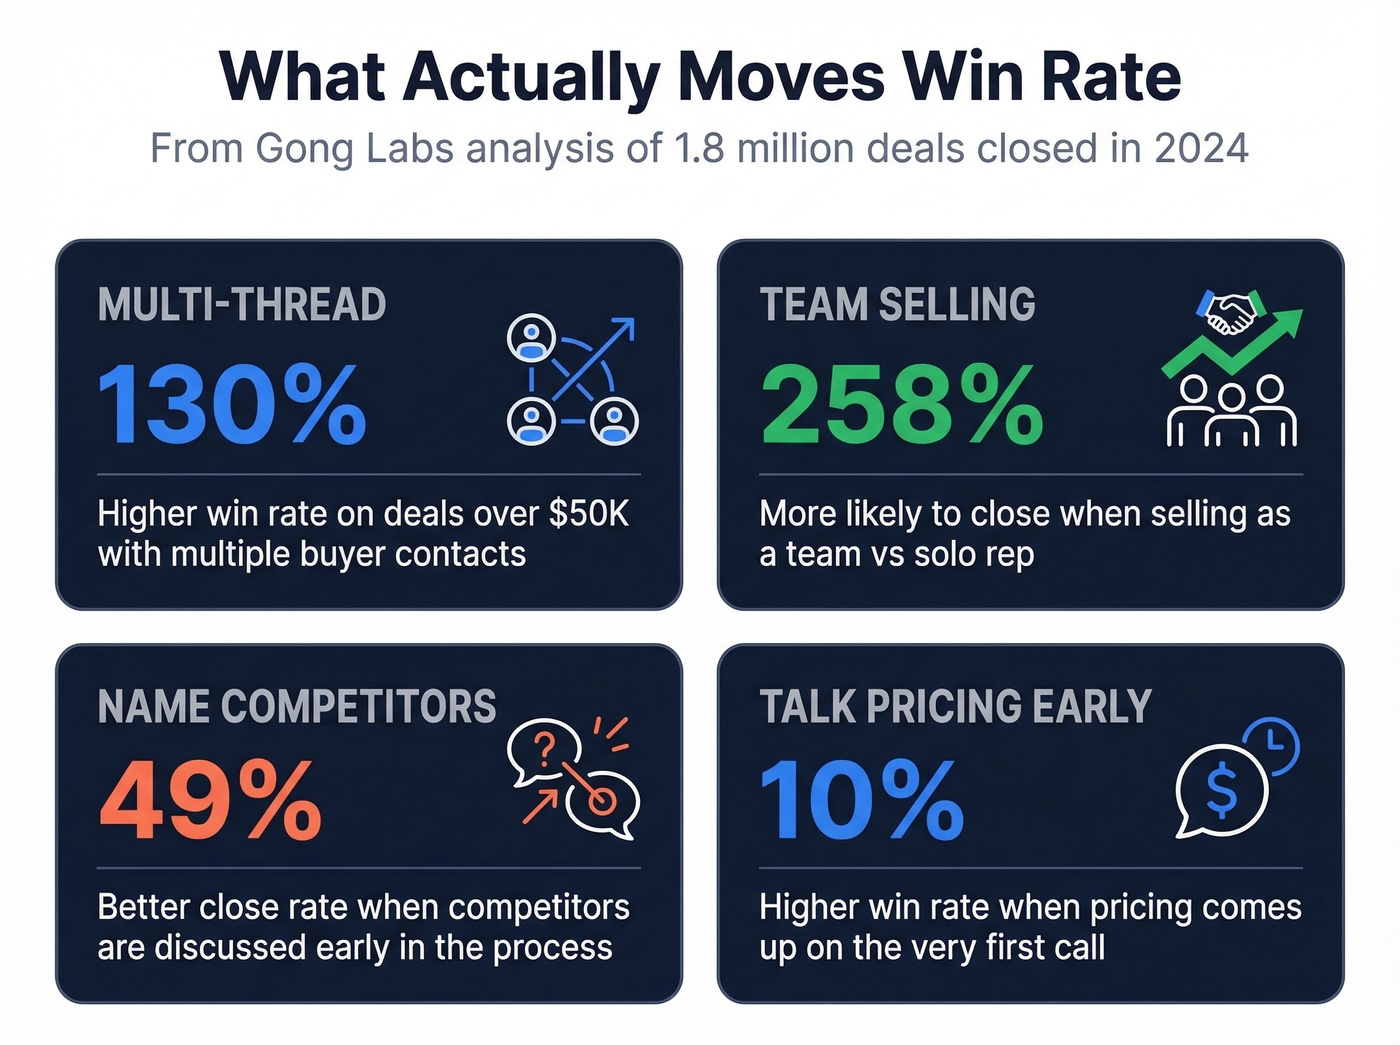
Multi-thread or lose. Deals over $50K with multiple buyer contacts see a 130% higher win rate. Won deals average twice as many contacts - on large strategic deals, that means ~17 people. Enterprise deals without the decision-maker involved are 233% less likely to close. If you're three calls deep and haven't talked to power, you're building pipeline fiction. This is exactly what MEDDIC is designed to prevent, but it only works if your CRM data reflects reality.
Sell as a team. Selling teams on won deals are 258% more likely to close than solo reps. Bring your SE, your exec sponsor, your CS lead. A single rep carrying a $75K deal alone is a red flag, not a sign of efficiency.
Talk money and competition early. Win rates are 10% higher when pricing comes up on the first call. Discussing competitors early correlates with a 49% better close rate. Avoiding these topics doesn't make them disappear - it just lets the buyer control the narrative.
Clean your data upstream. Here's the thing: in our experience, this is the most underrated win-rate lever nobody talks about. If 30% of your outbound emails bounce, those "opportunities" never had a real chance - but they still inflate your denominator. Prospeo's real-time email verification catches dead records before they become phantom pipeline in your CRM, with a 98% email accuracy rate and a 7-day data refresh cycle. That means the opportunities entering your funnel are real from day one, and your reported win rate actually reflects selling performance.
What to Model in Your Revenue Plan
| Segment | Model Win Rate |
|---|---|
| Enterprise (>$100K ACV) | 15-20% |
| Mid-Market ($10K-$50K) | 20-25% |
| SMB (<$10K) | 28-35% |
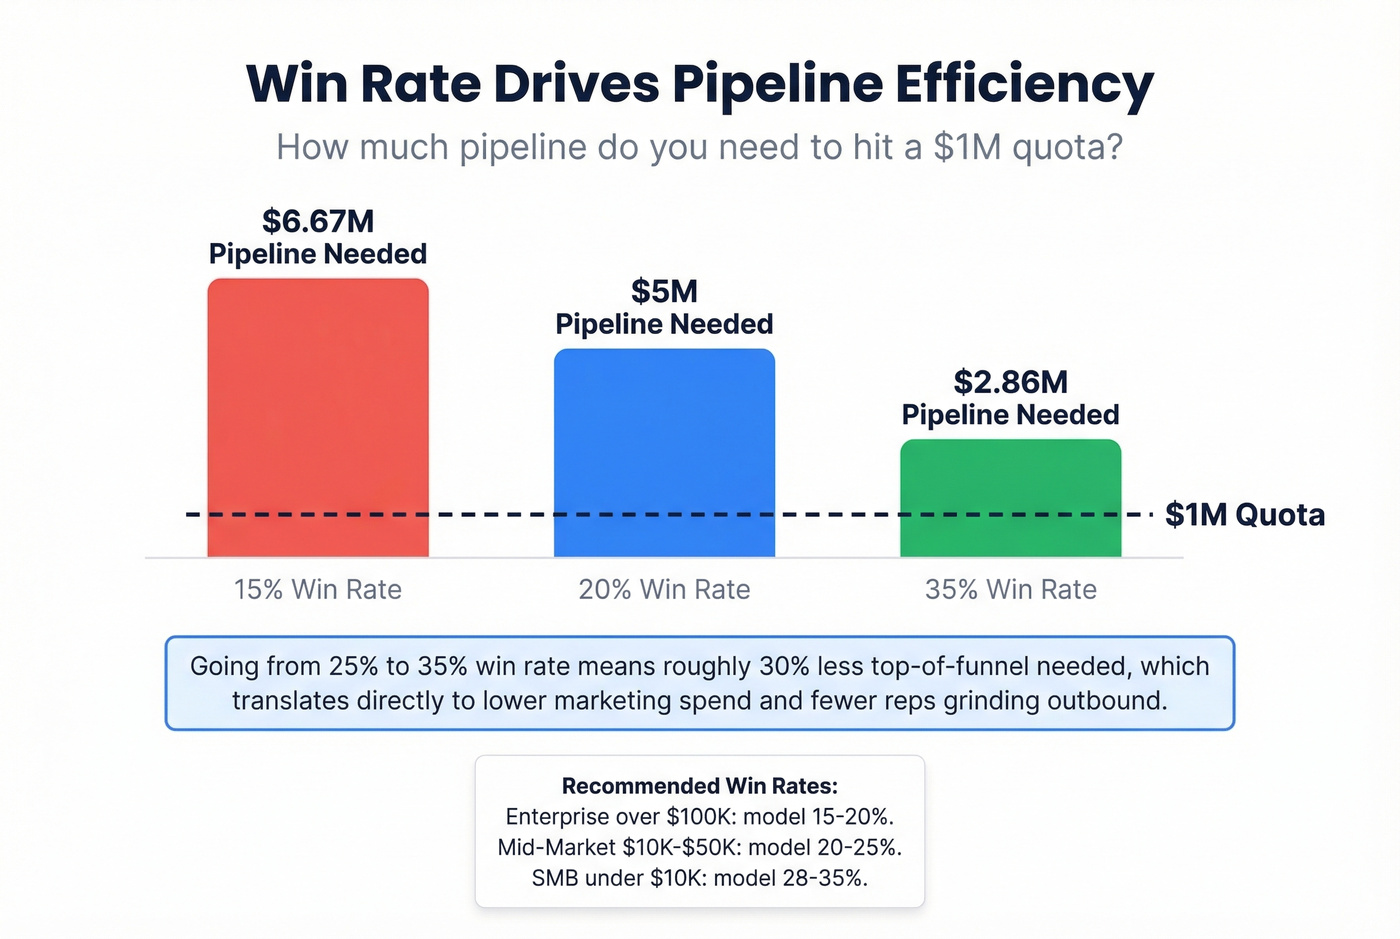
Here's the math that matters: at a 20% win rate, you need $5M in pipeline to hit a $1M quota. Improving from 25% to 35% means you need roughly 30% less top-of-funnel, which translates directly to lower marketing spend and fewer reps grinding outbound.
Use trailing data from at least two full sales cycles before defaulting to external benchmarks. Your own data, messy as it is, beats an industry average every time. The SaaS win rate benchmark tables above are a starting point for calibration - not a substitute for your CRM's trailing actuals.
Let's be honest: if you don't trust your own CRM data enough to model from it, that's the first problem to solve. Skip the benchmarks and fix your data hygiene.
Multi-threading wins enterprise deals - but only if you can actually reach 17 stakeholders. Prospeo gives you verified emails and direct dials for every contact in the buying committee, at $0.01 per email. No phantom pipeline, no inflated denominator.
Reach every buyer in the thread, not just the one who replied.
FAQ
What's the difference between win rate and close rate?
Win rate equals won deals divided by decided opportunities (won + lost). Close rate often includes open and abandoned deals in the denominator, producing a lower number. Always confirm which denominator someone is using before comparing figures across teams or reports.
What's a good average SaaS win rate?
Per Optifai's 939-company dataset: SMB 28-35%, mid-market 20-28%, enterprise 12-18%. Consistently above 40% usually means your team isn't pursuing enough competitive deals. Below 15% across all segments signals ICP or qualification problems.
How often should I measure win rate?
Review monthly for pipeline hygiene, but use trailing 6-12 months for strategic decisions like hiring or quota modeling. A single bad month isn't a trend. A bad trailing quarter deserves investigation into deal stage definitions, rep activity, or data quality.
How does bad contact data affect win rates?
Bounced emails and wrong numbers create phantom pipeline - opportunities that were never real but still count against your denominator. Cleaning records before they enter your CRM means your reported win rate reflects actual selling performance, not data noise.