The Sales Budget Template Your CFO Actually Wants to See
Your CFO just asked for next year's sales budget by Friday. You open the shared drive and find nothing. You ask RevOps - they send a revenue forecast. You ask Finance - they send a P&L template. Nobody has a single spreadsheet that covers headcount, commissions, tools, and territory planning in one place.
We built the template that should've existed already: one spreadsheet, seven tabs, with benchmarks and formulas so you're not starting from zero.
What's Inside the Template
[Download the template (Google Sheets) →] [Download the template (Excel) →]
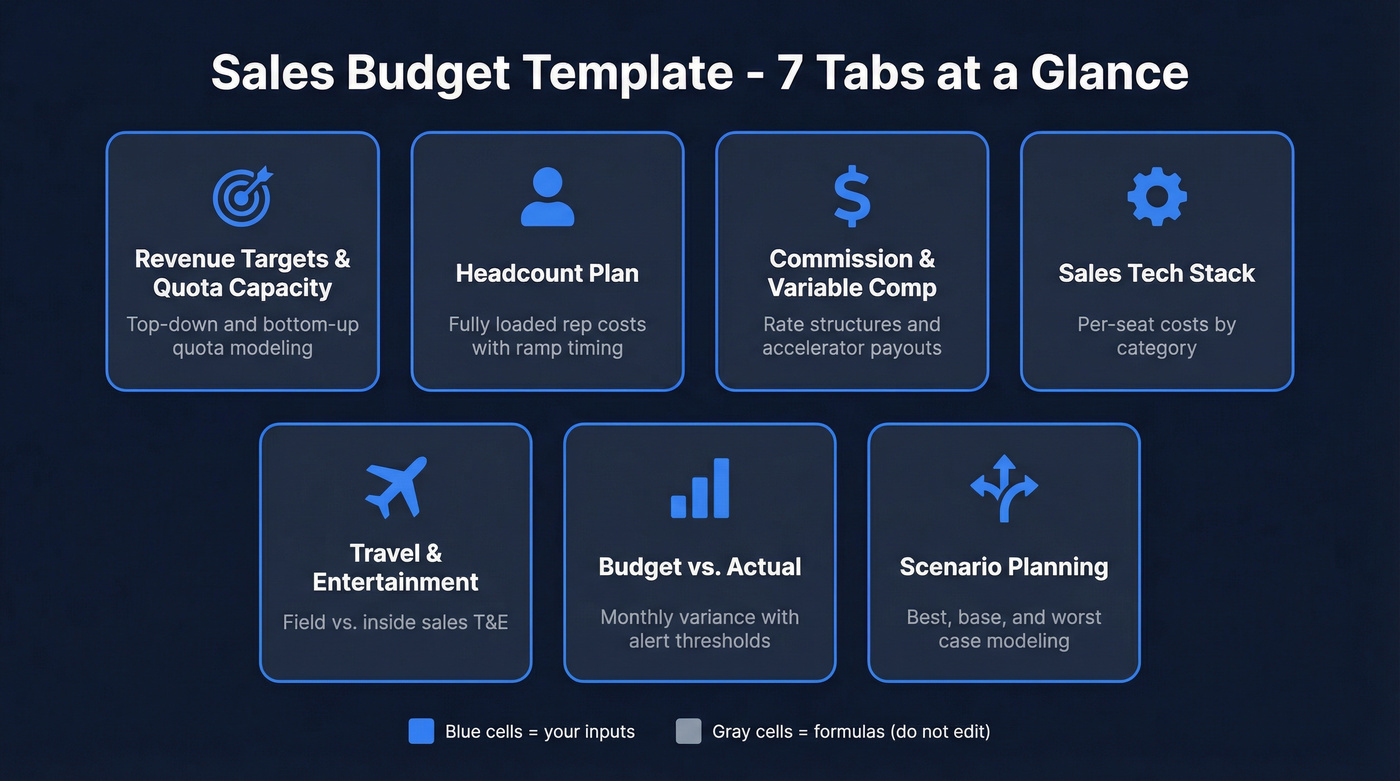
The seven tabs:
- Revenue Targets & Quota Capacity - top-down and bottom-up quota modeling with OTE ratios
- Headcount Plan - fully loaded rep costs including benefits, variable comp, and ramp timing
- Commission & Variable Comp - rate structures, accelerators, and tiered payout modeling
- Sales Tech Stack - per-seat costs by category with annual totals
- Travel & Entertainment - field rep vs. inside sales T&E with event budgets
- Budget vs. Actual - monthly variance tracking with alert thresholds
- Scenario Planning - best/base/worst case modeling across key variables
Blue cells are your inputs. Gray cells are formulas - don't touch them. The most usable spreadsheet templates clearly separate "type here" cells from calculated cells, so people always know where to enter numbers.
Sales Budget vs. Sales Forecast
These get confused constantly, and the confusion costs teams real planning time.
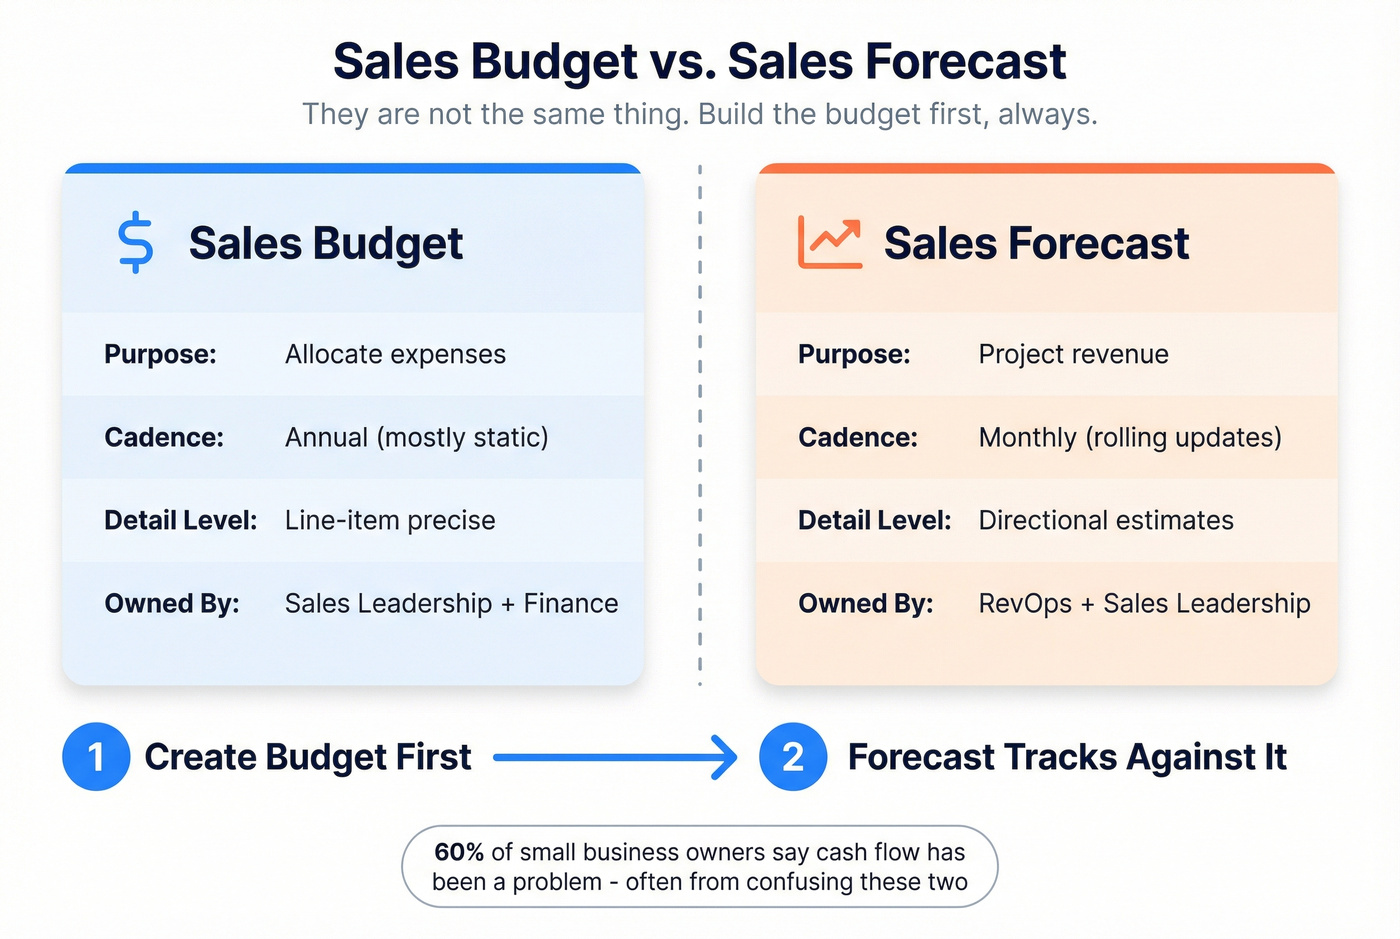
| Dimension | Sales Budget | Sales Forecast |
|---|---|---|
| Purpose | Allocate expenses | Project revenue |
| Cadence | Annual (static) | Monthly (rolling) |
| Detail | Line-item precise | Directional |
| Owner | Sales leadership + Finance | RevOps + Sales leadership |
A budget is your spending plan for the year - it answers "how much will it cost to run this sales org?" A forecast is your revenue projection, updated monthly as reality diverges from plan. You create the budget first. The forecast then tells you how performance tracks against it. Per QuickBooks' breakdown, 60% of small business owners report cash flow has been a problem, and most of that stems from confusing "what we plan to spend" with "what we hope to earn."
Build the budget first. Always.
That data enrichment line in your budget? It doesn't have to be $200+/rep/month. Prospeo delivers 98% email accuracy and 125M+ verified mobiles at ~$0.01/email - no annual contracts, no sales calls. Budget enterprise-grade data at SMB prices.
Cut your data line item by 90% without cutting accuracy.
Template Walkthrough
Revenue Targets & Quota Capacity
Everything in a sales budget flows from the revenue number. Start here or nothing else makes sense.
The template supports both top-down (board sets a target, you back into headcount) and bottom-up (you model what your current team can carry, then gap-fill). Most orgs use a blend - the board gives you a number, you pressure-test it against quota capacity. The standard quota-to-OTE ratio in SaaS runs 4:1 to 6:1, so if an AE's OTE is $200K and you're using a 5:1 ratio, that rep carries a $1M quota. Need $10M in new business? You need 10 fully ramped AEs - or more, since not everyone hits 100%.
Here's a stat that should bother you: 87% of sales leaders set quota targets without a structured method. This tab forces the structure. Plug in your revenue target, your OTE assumptions, and the ratio - the template shows you how many reps you actually need.
Headcount & Fully Loaded Rep Cost
This is where most sales budgets fall apart. Leaders budget base salary and forget that a $90K AE can cost north of $200K when you load everything in.
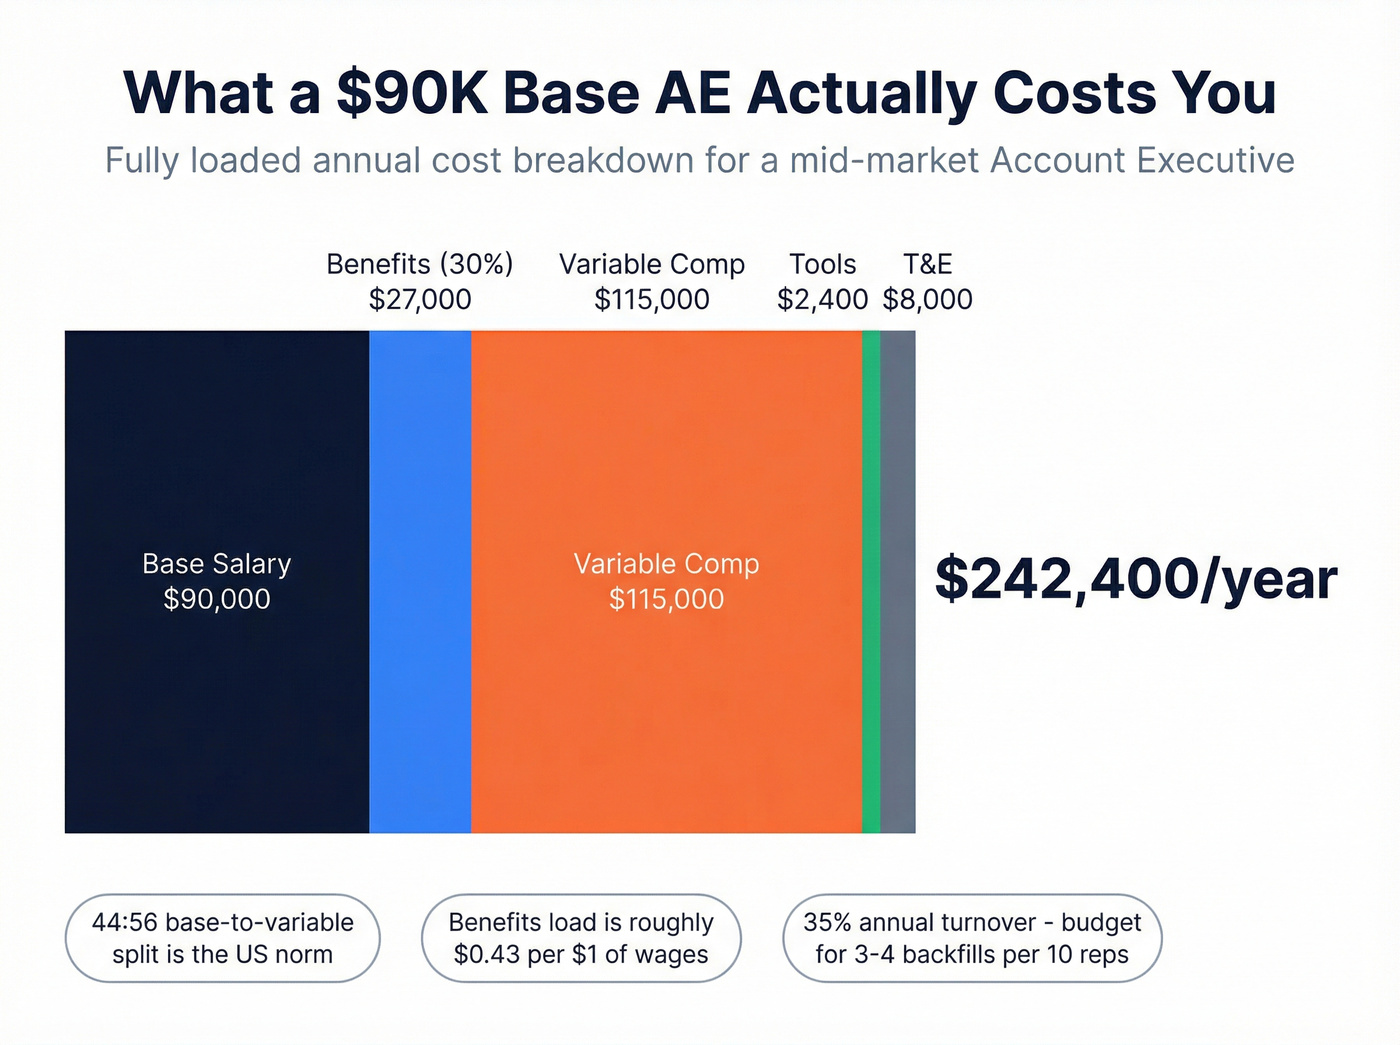
The most recent BLS employer cost data shows private industry employers pay roughly $0.43 in benefits for every $1 of wages - paid leave, insurance, retirement, and legally required contributions like Social Security and unemployment insurance all included.
Take a mid-market AE with a $90K base:
- Benefits load at 30% of wages: $27,000
- Loaded base: $117,000
- Variable comp at the standard 44:56 base-to-variable split: ~$115,000 at plan
- Tools at $200/mo: $2,400
- T&E: $8,000
- Fully loaded: ~$242K/year
That number shocks people. But it's real, and your CFO already knows it - they just want to see that you do too.
The template also handles ramp timing. An SDR typically ramps in 1-2 months; an AE takes 3-6 months to hit full productivity. If you're hiring an AE in Q2, you're paying full cost but getting partial output until Q3 or Q4. The headcount tab lets you set start dates and ramp percentages so your quarterly projections stay honest.
One more number for your back pocket: sales turnover runs roughly 35% - nearly three times the cross-industry average. Budget for backfills. If you have 10 AEs, assume you'll replace 3-4 this year and bake those ramp costs in.
Commission & Variable Comp
Commission modeling is where spreadsheets get messy fast. The template keeps it clean with input cells for rates and structures, and locked formula cells that calculate payouts automatically.
Flat rate works when your deal sizes are relatively uniform and you want simplicity. The standard SaaS commission rate is 10% of ACV, with a median of 11.5% at 100% attainment.
Tiered or accelerator structures reward overperformance. Accelerators kick in above quota - say 1.5x rate on anything over 100% attainment. Tiered structures set different rates at different bands: 8% up to 80%, 10% at 80-100%, 15% above 100%.
Skip commission-only plans unless you're running a transactional motion with very short cycles. The U.S. norm is a 44:56 base-to-variable split, meaning variable comp is slightly more than half of OTE. Going full commission sounds aggressive on paper but drives the wrong behaviors and accelerates turnover.
Sales Tech Stack Costs
Let's be honest: most sales leaders have no idea what their tech stack actually costs per rep per month. They approved tools one at a time over three years and never added them up.
The template includes a dedicated tab for this. Realistic ranges by category:
| Category | Tool Example | $/User/Month |
|---|---|---|
| CRM | Salesforce | $25-$330 |
| CRM (budget) | Pipedrive | $14-$79 |
| Engagement | Apollo | From $49 |
| Engagement | Mailshake | From $25 |
| Data/Enrichment | Prospeo | ~$20-$50/rep/mo |
| Rev Intelligence | Gong/Chorus | ~$100-$150 |
| Enablement | Dock | From $350/mo flat |
Add it up for a typical mid-market stack and you're looking at $150-$500 per user per month. For a 10-person team on Salesforce Enterprise with a revenue intelligence tool and a data provider, that's easily $30K-$60K/year just in tool costs - before implementation. A Salesforce buildout alone runs $20,000-$100,000+ depending on complexity, and that one-time cost belongs in your budget's first year.

The data and enrichment line is where we see the widest variance. Legacy providers can run $200+/rep/month on annual contracts. Credit-based tools like Prospeo bring that down to roughly $0.01 per verified email with 98% accuracy and no contract required - for a 10-rep team doing moderate outbound, that's $20-$50/rep/month instead of $200+.
One contrarian take worth stating plainly: if your average deal size is under $10K, you probably don't need a $200/rep/month data provider. Audit your login data before budgeting next year's tools. We've seen teams renew five-figure contracts for platforms where fewer than 60% of licensed users log in weekly. Reps spend only 28% of their time actually selling - don't make it worse by paying for tools they don't use.
Travel & Entertainment
T&E varies wildly by sales motion. Inside sales teams might spend $1K-$3K per rep annually on the occasional team offsite or conference. Field reps covering enterprise territories? Budget $5K-$20K per rep per year, depending on geography and deal size.
Break this into three sub-lines: regular travel for client visits and territory coverage, conferences and events with booth costs and registration, and entertainment for dinners and gifts within compliance limits. A single booth at a major industry event can run $15K-$50K before you count travel for the team staffing it, so conferences deserve their own line. If you're running a dedicated campaign budget for a product launch or market expansion, carve that out separately so it doesn't distort your baseline T&E.
We've watched teams cut T&E to zero in Q1 and then scramble to reinstate it by Q3 when pipeline dried up. Be realistic - cutting travel looks good on paper but kills deal velocity.
Budget vs. Actual Tracking
The variance tab is what separates a plan from a living document.
It tracks monthly planned spend against actual spend, with a variance column that auto-calculates the delta. Set two alert thresholds: at 75% consumed, flag yellow - you're ahead of pace. At 90% consumed, flag red - you'll overshoot without intervention. The review cadence that works: monthly check against actuals, quarterly reforecast when variance exceeds 10%, and a full annual re-plan. Your CFO will love this tab because it proves you're actually managing the budget, not just filing it.
Scenario Planning That Holds Up
A single-point budget is a guess. Three scenarios make it a strategy.
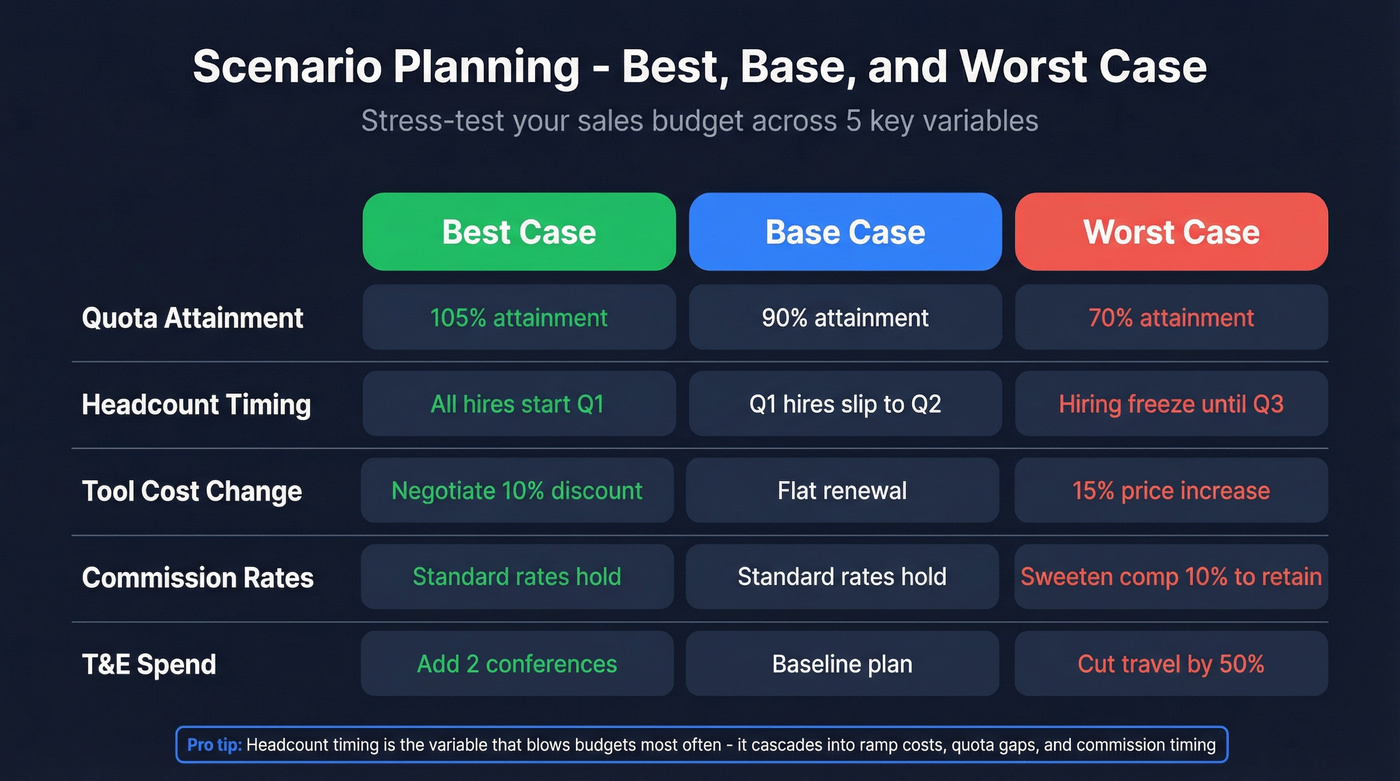
The template's scenario tab lets you model best case, base case, and worst case across 3-5 key variables:
- Quota attainment % - what if the team hits 70% instead of 90%?
- Headcount timing - what if your Q1 hires slip to Q2?
- Tool costs - what if Salesforce pricing raises prices 15% at renewal?
- Commission rates - what if you need to sweeten comp to retain top performers?
- T&E - what if you add two conferences or cut travel entirely?
Stress-test each variable by ±10% and ±20% from your base case. That's sensitivity analysis - changing one variable at a time to see which levers move the budget most. Full scenario planning changes multiple variables together within a narrative, like a recession scenario where attainment drops 20%, you freeze hiring, and cut T&E by half. In our experience, headcount timing is the variable that blows budgets most often because it cascades into ramp costs, quota coverage gaps, and commission timing all at once.
How to Build Your Sales Budget Step by Step
You don't need budgeting software. You need a well-structured spreadsheet and about 90 minutes. This is the same process used by teams that actually get CFO sign-off on the first pass:
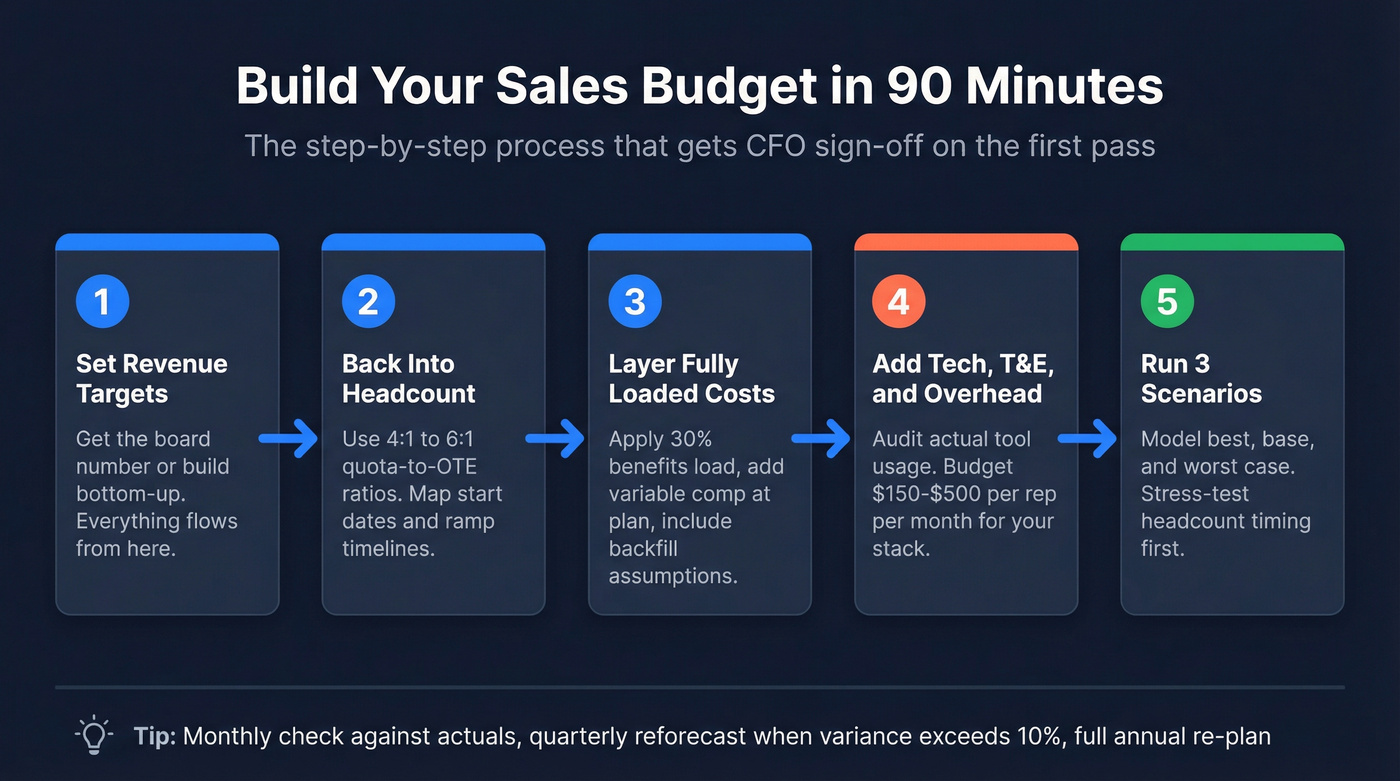
- Start with revenue targets. Get the board-approved number or build your own bottom-up model. Everything else depends on this.
- Back into headcount. Use quota-to-OTE ratios to determine how many reps you need, then map start dates and ramp timelines.
- Layer fully loaded costs. Apply the 30% benefits load, add variable comp at plan, and include backfill assumptions for turnover.
- Add your tech stack. List every tool, every seat, every annual contract. Include implementation costs for new tools. Audit usage before auto-renewing anything.
- Budget T&E. Separate field rep travel from conferences and events. Be realistic.
- Build three scenarios. Best, base, worst. Stress-test the 3-5 variables that matter most.
- Get CFO sign-off. Present the base case with scenarios attached. CFOs don't want one number - they want to see that you've thought about what happens when the number is wrong.
Once the annual budget is locked, break it into monthly columns so you can track variance at a granular level.
You just calculated fully loaded rep costs at $242K/year. Every bounced email and wrong number burns that investment. Prospeo's 7-day data refresh and 98% verified emails mean your reps actually connect - teams book 26% more meetings vs. ZoomInfo.
Stop budgeting for tools that waste your reps' time.
FAQ
What should a sales budget include?
A complete sales budget includes fully loaded headcount costs (base + benefits + variable comp), tech stack licensing, travel and entertainment, training, and a variance-tracking mechanism. Revenue targets set the frame; line-item expenses fill the cells. Most teams undercount by forgetting benefits load and tool sprawl.
How often should you update a sales budget?
Set it annually, review monthly against actuals, and reforecast quarterly when variance exceeds 10%. A budget that sits in a drawer until December is just a wish list.
What's the difference between a sales budget and a sales forecast?
A budget allocates expenses for the year - it's static once approved. A forecast projects revenue and gets updated monthly as deals progress. Build the budget first; the forecast tells you how reality is diverging from plan.
What's a typical fully loaded cost per sales rep?
For a mid-market AE with a $90K base: add ~30% benefits load ($27K), variable comp at plan (~$115K), tools at $2,400/year, and T&E of $5K-$15K. Total lands between $180K and $250K+ depending on comp structure and territory type.
What should I budget for sales data and enrichment tools?
Legacy providers run $200+/rep/month on annual contracts. Credit-based tools bring the data line to $20-$50/rep/month with comparable or better accuracy. For a 10-rep team, that's $18K-$24K/year in savings on enrichment alone.