How to Calculate Sales Enablement ROI (With a Formula That Actually Works)
Budget season hits, and the question lands like a brick: "What's the ROI on the $150K we spent on enablement last year?" If you can't answer in dollars, you're not "being strategic" - you're giving finance a reason to cut you.
And here's the annoying part: enablement does create real value, but most teams measure it in a way that doesn't survive a CFO's follow-up questions. One stat that should make every enablement leader sweat: 30.3% of practitioners say their metrics only minimally reflect enablement's actual value. That's not a tooling problem. That's a measurement problem.
Let's break this down into a model you can defend in a budget meeting, not just in a dashboard review.
The Five-Category ROI Formula
A defensible sales enablement ROI model has five buckets. Each one captures a different kind of value, and together they keep you from playing games with the math.
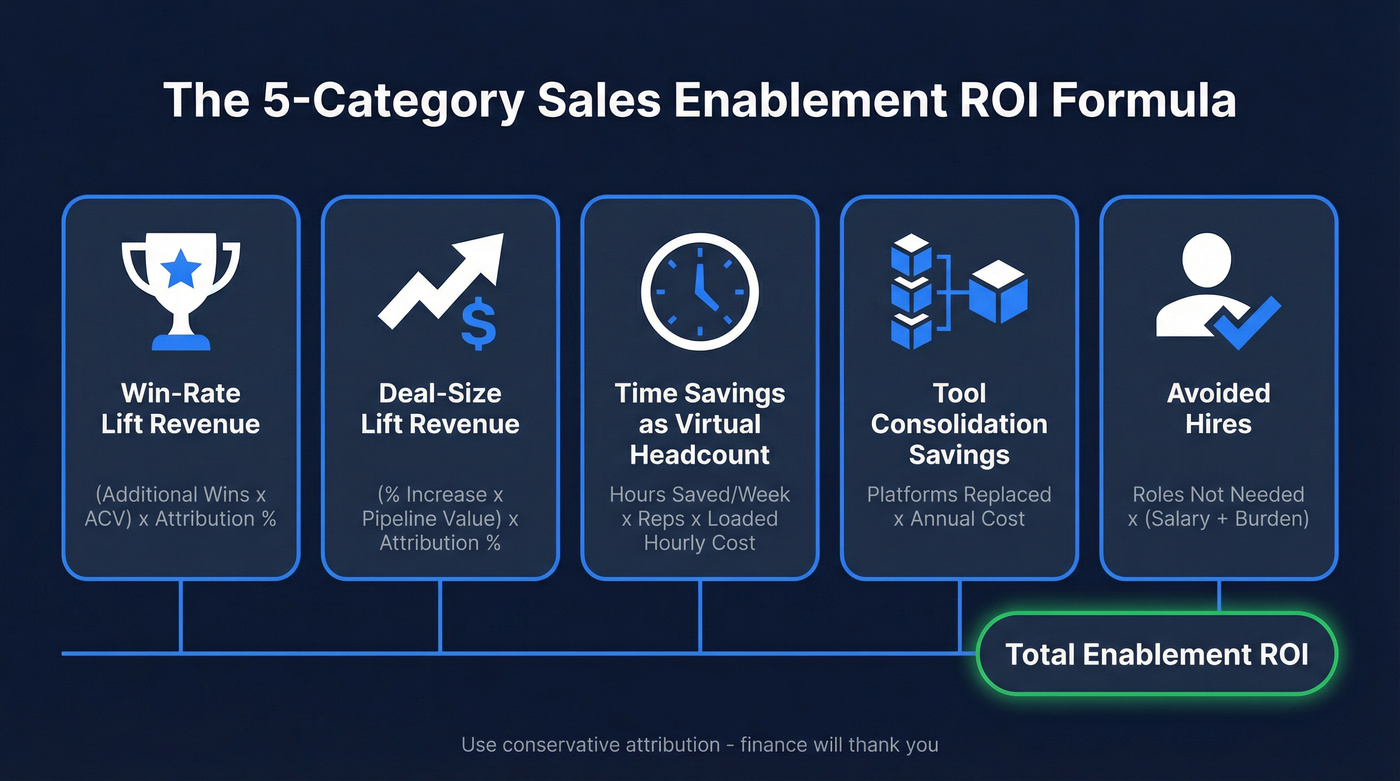
- Win-rate lift revenue: (additional wins x ACV) x attribution %
- Deal-size lift revenue: (% increase x pipeline value) x attribution %
- Time savings as virtual headcount: hours saved/week x reps x fully loaded hourly cost
- Tool consolidation savings: platforms replaced x annual cost
- Avoided hires: roles not needed x (salary + burden)
Worked example: win-rate lift (the one finance understands fastest)
Say you have 50 reps, 200 opportunities per rep per year, $50K average deal size, and a 20% baseline win rate. Enablement improves win rate by 2 percentage points (20% to 22%).
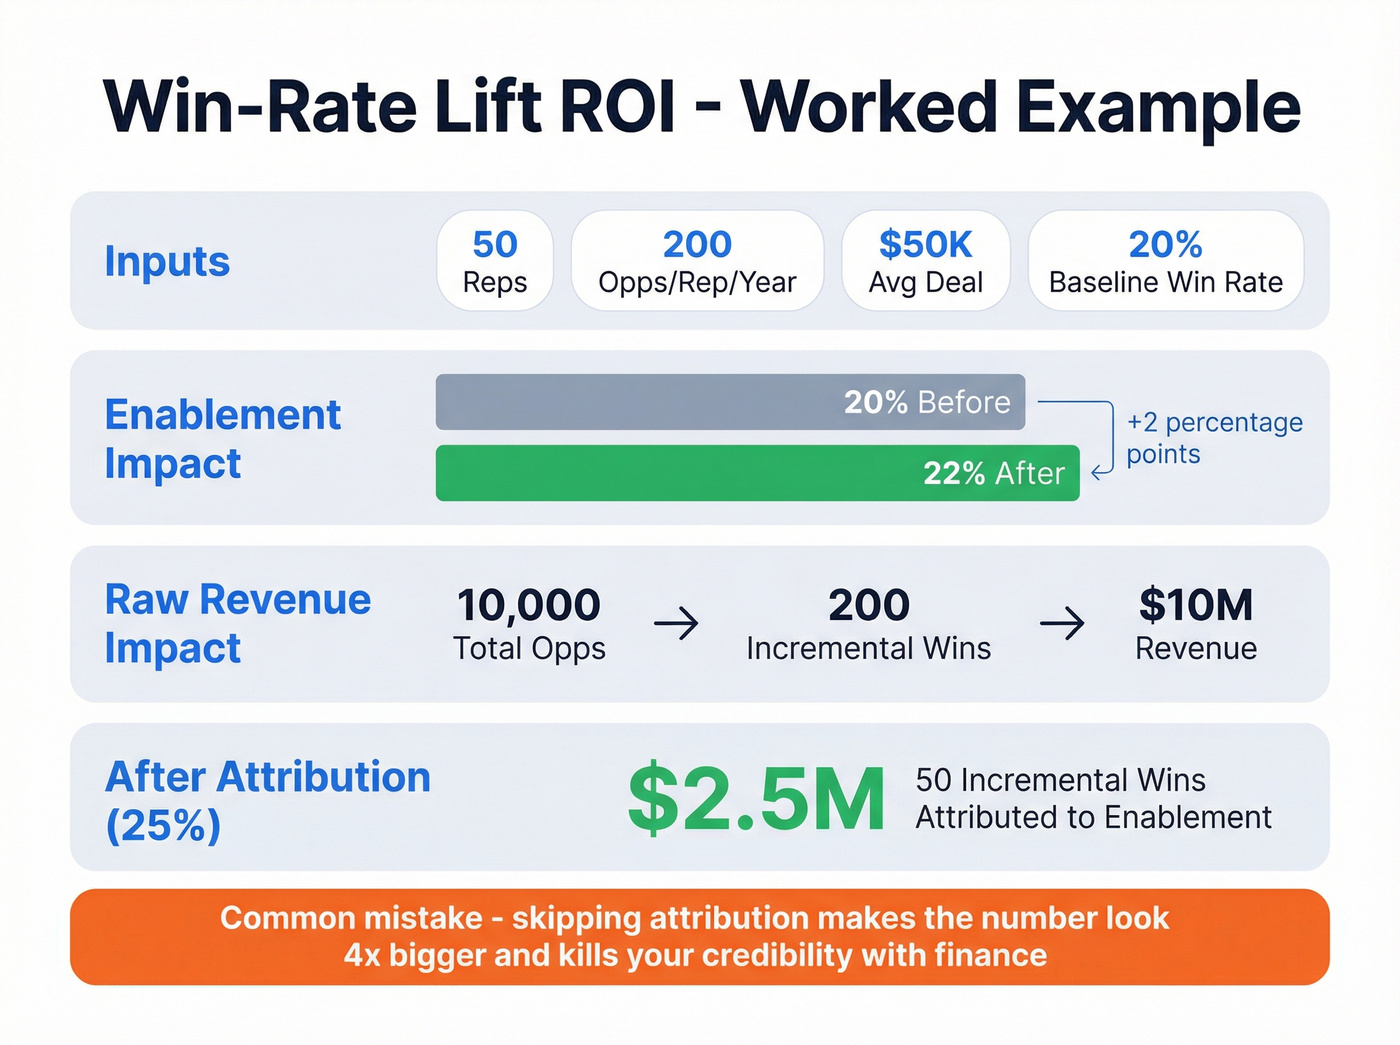
- Total opps: 50 x 200 = 10,000
- Incremental wins: 10,000 x 2% = 200
- Incremental revenue (before attribution): 200 x $50K = $10M
Now apply attribution. Be conservative. If you assign 25% of that lift to enablement, that's 50 incremental wins (200 x 25%) and $2.5M in enablement-attributed revenue.
If you're thinking, "Wait, the draft math said $200K," you're right to pause. That earlier example mixed steps and undercounted the revenue by an order of magnitude. This is exactly why CFOs don't trust enablement ROI decks: one sloppy line and the whole model looks like wishful thinking.
Worked example: time savings (where ROI quietly gets huge)
Time savings is where enablement ROI often gets real, fast - but only if you price it correctly.
Convert hours into dollars using a fully loaded rep cost (salary, commission, benefits, taxes, tools). In most B2B orgs, $75-$150/hour is a fair range.
If enablement saves 5 hours per rep per week across 50 reps:
- Hours saved/week: 5 x 50 = 250
- Hours saved/year: 250 x 52 = 13,000
- Dollar value: 13,000 x $75-$150 = $975K-$1.95M/year
You can also express that as virtual headcount. At ~2,080 hours per year, 13,000 hours is 6.25 FTEs of selling capacity you didn't have before.
We've run this formula with dozens of sales enablement teams, and the same two mistakes show up almost every time. First, people extend projections out to 4-5 years to make the ROI look "strategic." Finance won't buy it. Forrester's TEI framework uses a three-year horizon for a reason: beyond that, you're guessing. Second, teams double-count value: if win-rate lift and deal-size lift both pull from the same pipeline, you need to isolate what's truly incremental or you'll inflate the number and lose credibility.
Metrics That Actually Matter
Dashboard overload kills enablement programs faster than budget cuts. Pick 4-5 metrics and ignore the rest.
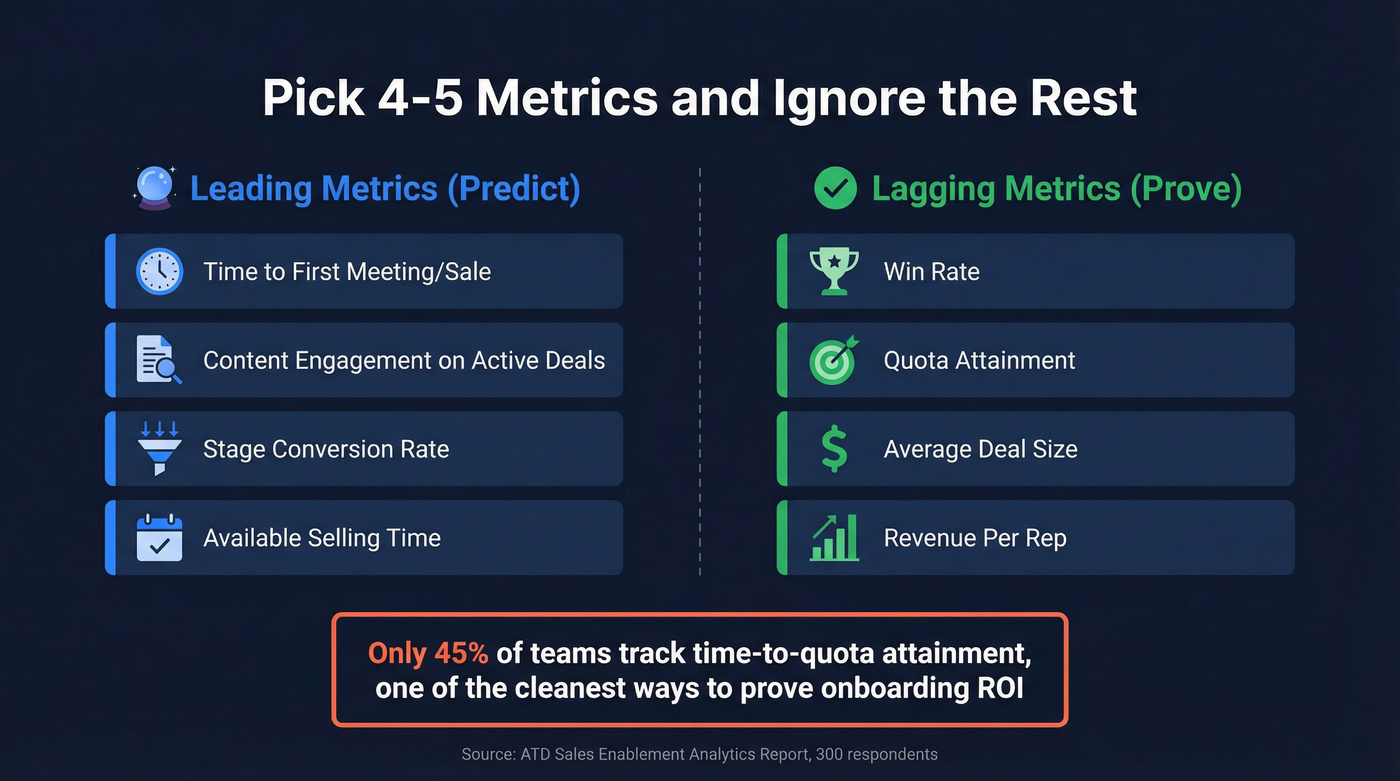
| Leading (predict) | Lagging (prove) |
|---|---|
| Time to first meeting/sale | Win rate |
| Content engagement on active deals | Quota attainment |
| Stage conversion rate | Average deal size |
| Available selling time | Revenue per rep |
ATD's Sales Enablement Analytics Report (based on 300 respondents) found that 60%+ of enablement teams track quota attainment, but only 45% track time to quota attainment. That's wild, because time-to-quota is one of the cleanest ways to prove onboarding ROI without getting dragged into attribution debates.
Leading indicators tell you if the intervention's working right now. Lagging indicators tell you if it worked eventually. You need both, but leading metrics are what let you fix the program before the quarter's gone.
If you want a simple rule our team uses: if a metric can't be tied to an active opportunity or a ramp milestone, it's probably noise.
How to Prove Enablement Caused It
Scenario we've seen too many times: your SDR team finishes a three-week onboarding program. Two months later, half still haven't booked a meeting. Was the program bad, or did the lead list stink?
Look, a dashboard that shows "trained reps have higher win rates" doesn't prove anything if your best reps are also the ones who finish training. That's selection bias, and finance folks spot it instantly.
What you need is a causal chain you can explain in one breath: intervention --> behavior change --> pipeline impact --> revenue outcome.
Reddit threads in communities like r/sales and r/salestechniques bring up the same complaint over and over: "Everything touches the deal, so nothing gets credit." That's true only if you refuse to test.
A four-step proof checklist (that doesn't require a data science team)
- Set a baseline before the intervention: win rate, stage conversion, stage velocity, ramp metrics.
- Split cohorts: coached group vs. control group. Keep territories and lead sources as similar as you can.
- Run it 3-6 weeks so you get enough pipeline movement to see signal (not just completions).
- Compare conversion and velocity, not training attendance.
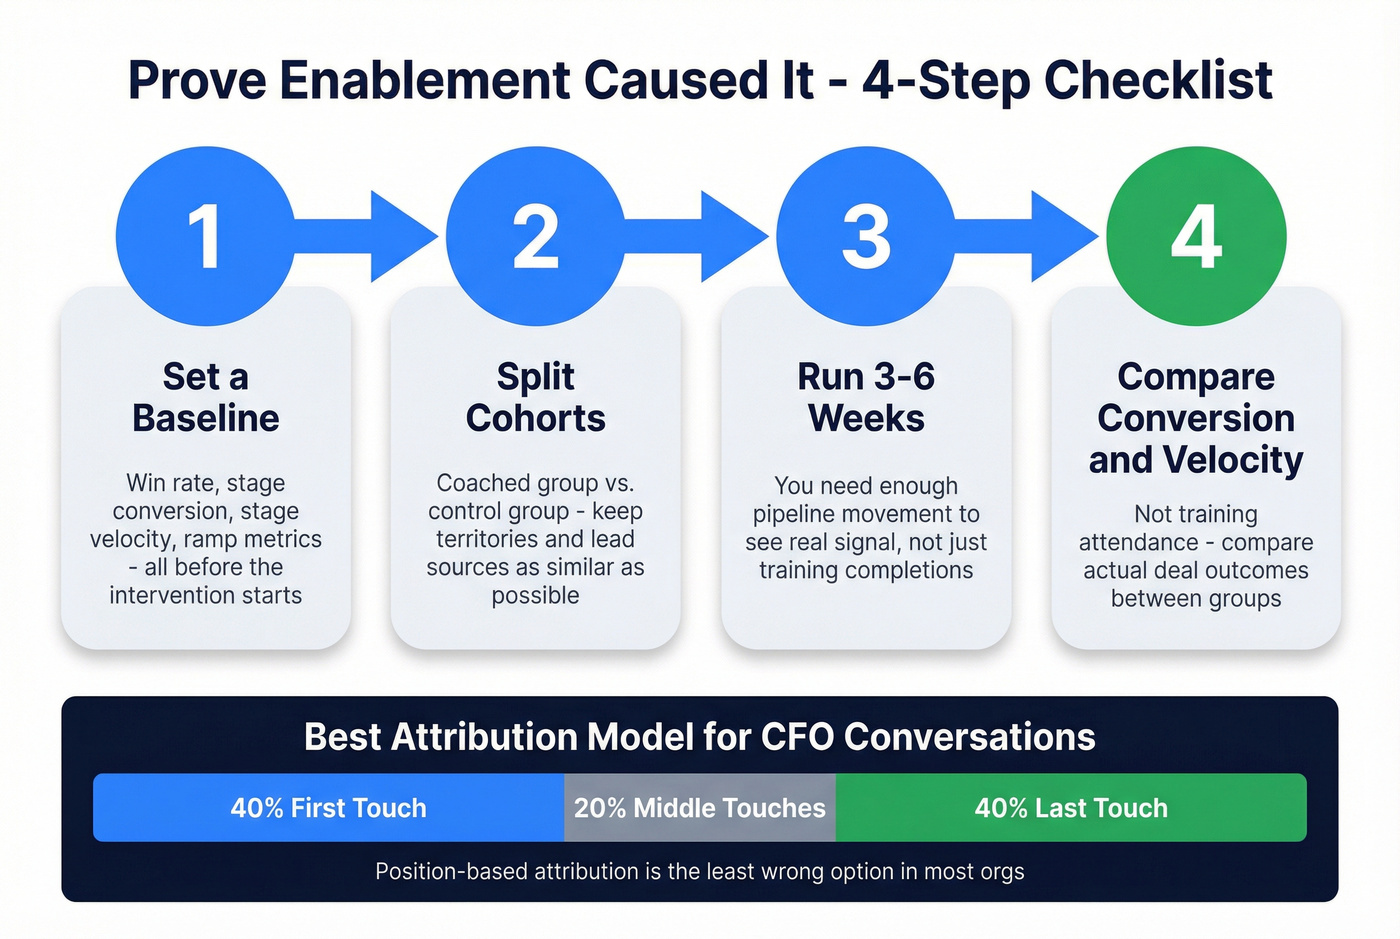
In our experience, the attribution model that survives CFO scrutiny most often is position-based attribution: 40% credit to first touch, 40% to last touch, and 20% spread across the middle. First-touch-only overvalues awareness content. Last-touch-only overvalues closing decks. Position-based is the least wrong option in most orgs.
For a deeper read on how TEI-style ROI models are typically structured, Forrester's Total Economic Impact overview is a useful reference: https://www.forrester.com/tei/
You just saw how bad lead data can torpedo an SDR onboarding program. If reps can't reach real buyers, no enablement investment pays off. Prospeo delivers 98% email accuracy and 30% mobile pickup rates - so your time-savings and win-rate lift actually compound instead of leaking out through bounced emails.
Stop losing enablement ROI to bad contact data.
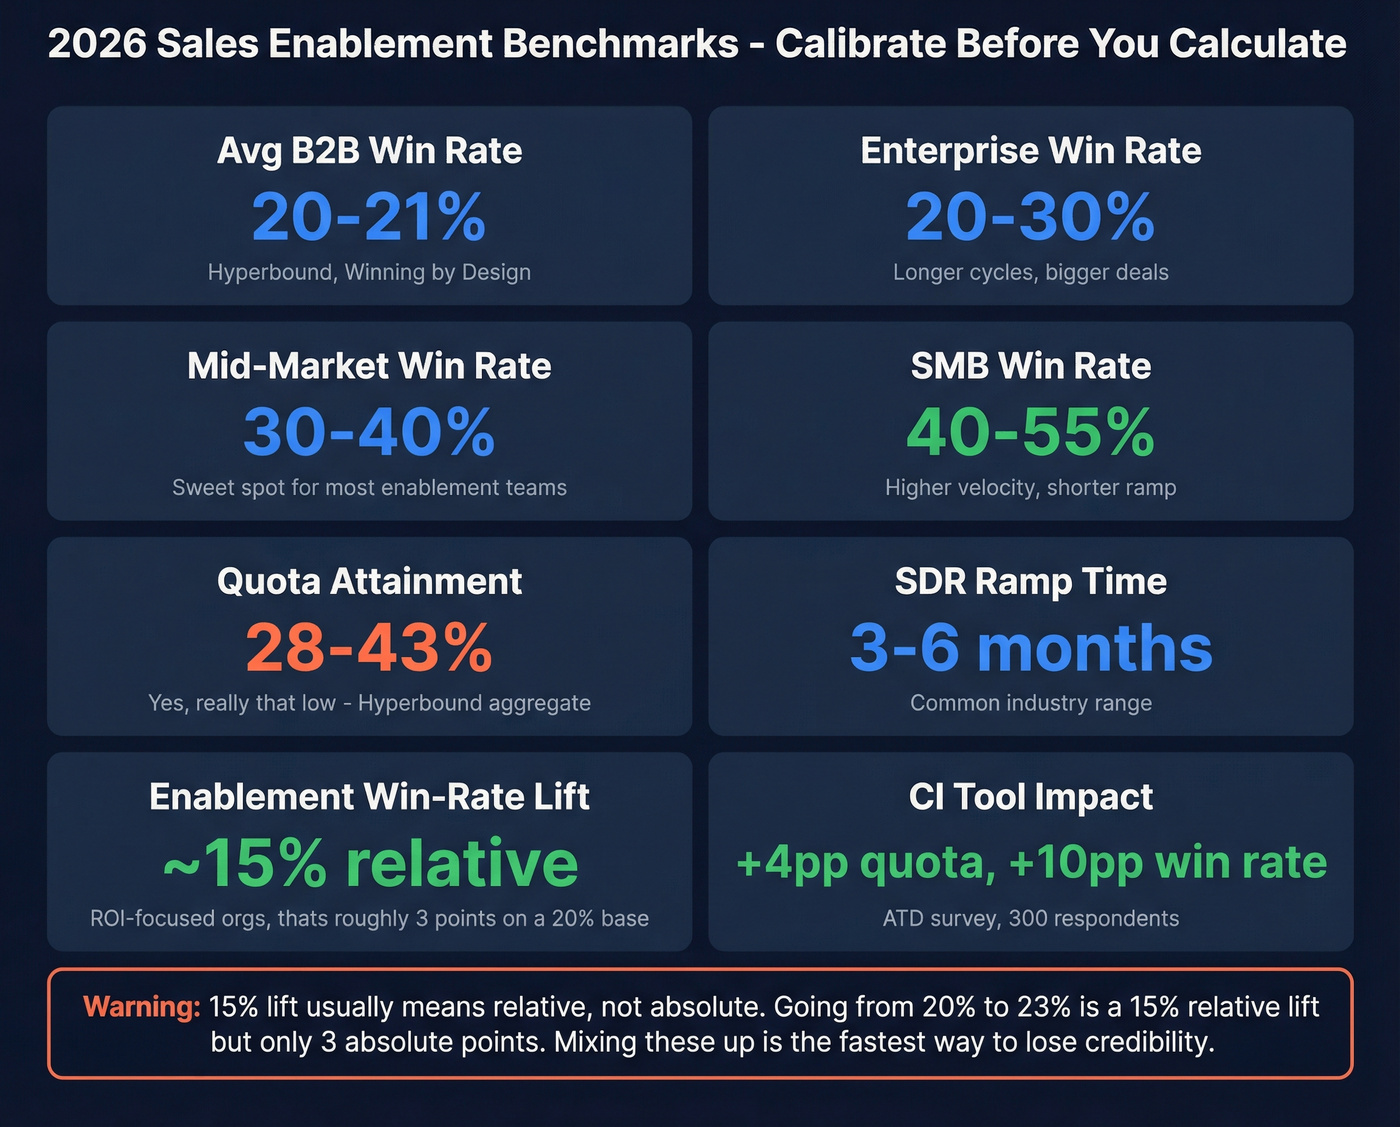
Benchmarks to Calibrate Your Model
Before you plug numbers into the formula, you need realistic baselines. Otherwise you're "proving" ROI with assumptions that don't match your segment.
| Metric | Benchmark range | Context |
|---|---|---|
| Avg B2B win rate | 20-21% | Hyperbound, Winning by Design |
| Win rate by segment | Enterprise 20-30%, Mid-market 30-40%, SMB 40-55% | Common 2026 ranges across sales benchmarks |
| Quota attainment | 28-43% | Hyperbound aggregate |
| SDR ramp time | 3-6 months | Common industry range |
| AE ramp time | 6-9+ months | Common industry range |
| Enablement win-rate lift | ~15% | ROI-focused orgs |
| Enablement quota lift | ~12% | ROI-focused orgs |
| CI tool impact | +4pp quota, +10pp win rate | ATD survey (300 respondents) |
Two notes before you copy/paste these into your spreadsheet.
First, treat benchmarks as guardrails, not targets. If your baseline win rate is 12% in enterprise, don't model a jump to 25% because a "top performer" report said it's possible. Model a 1-3 point lift, prove it, then expand.
Second, be careful with percentage math. A "15% win-rate lift" often means relative lift, not absolute points. Going from 20% to 23% is a 3-point increase, but it's a 15% relative lift. People mix those up constantly, and it's another reason ROI decks get torn apart.
If you want a credible framework for ramp and quota metrics, CSO Insights / SBI-style benchmark discussions are a common reference point in revenue orgs: https://www.sbi-growth.com/insights/ (useful starting point even if you don't buy anything).
A commissioned Forrester TEI study reported 516% ROI over three years based on two customer interviews. That's not a universal promise, but it does show what happens when enablement is run like an ROI engine instead of a training calendar. For a practical, metric-heavy view of enablement measurement, ATD's enablement resources are also worth skimming: https://www.td.org/
Hot take: if your average deal is under $15K and your team is under 20 reps, skip the $100K enablement platform. You'll get most of the return from a tight playbook, a shared content library, and clean prospect data.
What NOT to Measure
Real talk: if your enablement dashboard tracks content uploads and certification completions but nothing touches live pipeline, you're measuring activity theater.
Completions tell you reps showed up. They don't tell you reps can execute in a real deal with a real buyer who asks hard questions.
Keep the operational metrics internally if you need them, but don't lead with them in ROI conversations. And if a metric can't be traced to an opportunity, a ramp milestone, or a measurable behavior change (like stage conversion), it doesn't belong in your "value" story.
The Data Quality Multiplier (Where ROI Models Go to Die)
Your ROI formula assumes reps spend reclaimed time on real prospects. If your bounce rate's above 5%, that assumption breaks.

Every hour "saved" by enablement that gets burned on bounced emails and dead-end contacts deflates your time-savings line item. Worse, it poisons your measurement: reps stop trusting the system, managers start sandbagging forecasts, and enablement gets blamed for "not moving the number" even though the real problem is upstream.
Here's a concrete example. GreyScout had a 38% bounce rate before fixing their data layer. After switching to Prospeo's verified data, bounces dropped under 4% and pipeline jumped 140%. That's not "nice to have." That's the difference between an enablement program that compounds and one that stalls out because reps can't reach anyone.
Prospeo's numbers are built for this exact problem: 98% verified email accuracy, a 7-day refresh cycle, and pricing that lands around $0.01 per verified lead. If you're trying to defend enablement ROI, clean data isn't a side quest - it's part of the ROI engine. If you're pressure-testing your bounce assumptions, start with bounce rate benchmarks and fixes.
Tool consolidation is one of the five ROI buckets above. Teams using Prospeo replace multiple data vendors at $0.01 per verified email - 90% cheaper than ZoomInfo. That's a line item your CFO will approve on sight, and it frees budget for the enablement programs that actually move win rates.
Consolidate your data stack and hand finance a real savings number.
FAQ
What's a good ROI target for enablement programs?
Most orgs target 3-5x return within 12-18 months. The Forrester TEI study reported 516% over three years based on two customer interviews. High-performing teams often clear 3x in year one by focusing on win-rate lift and time savings before they chase deal-size lift or tool consolidation.
How long before I can measure results?
Leading indicators like content engagement on active deals, stage conversion, and stage velocity show signal in 3-6 weeks. Lagging indicators like win rate, quota attainment, and revenue per rep take at least one full sales cycle - often 3-9 months depending on your segment.
What's the biggest mistake in measuring sales enablement ROI?
Tracking vanity metrics that never connect to pipeline. Certification completions and content uploads feel productive but don't prove value to finance.
The second biggest mistake is ignoring data quality. If reps burn reclaimed time on bounced emails, your time-savings calculation turns into fiction fast.
How does data quality affect enablement returns?
Bad contact data erodes every productivity gain your enablement program creates. Teams running 30%+ bounce rates effectively lose a third of their "reclaimed selling hours" to dead-end outreach. Moving from 60% accuracy to 98% accuracy can dramatically increase the realized value of the same enablement investment, because reps spend their time talking to buyers instead of cleaning lists.