Sales Forecast Templates That Actually Work (Free Downloads + Methodology)
A RevOps lead we know spent every month-end doing the same thing: pulling numbers from five department trackers, copying them into a master spreadsheet, fixing broken SUMIFS, and praying the totals made sense. The whole ritual took a week. Every single month.
The numbers confirm this is universal. A 2024 Xactly survey of 400 sales and finance leaders found that 4 in 5 missed a quarterly forecast in the past year, and over half missed it two or more times. People forecast constantly. They just forecast badly - because the methods, data, and processes behind those spreadsheets are broken. Let's fix all three.
What You Need (Quick Version)
If you just want a template, jump to the downloads section. But if your forecasts keep missing, the spreadsheet isn't your bottleneck. The method and the data behind it are. This article gives you six free templates by use case AND the forecasting methodology to make them accurate.
What Is a Sales Forecast?
A sales forecast template is a structured spreadsheet that projects future revenue over a defined time period. The core formula is simple: units x price x time period. Everything else - weighted probabilities, churn rates, scenario columns - is refinement on top of that foundation.
Accurate forecasts drive hiring timelines, budget allocation, cash flow planning, and investor confidence. When your forecast is off by 30%, you're either overhiring into a miss or under-investing into a growth quarter. Neither is recoverable quickly.
Forecasting Methods Compared
The right forecasting method depends entirely on your data maturity. Here's how they stack up:
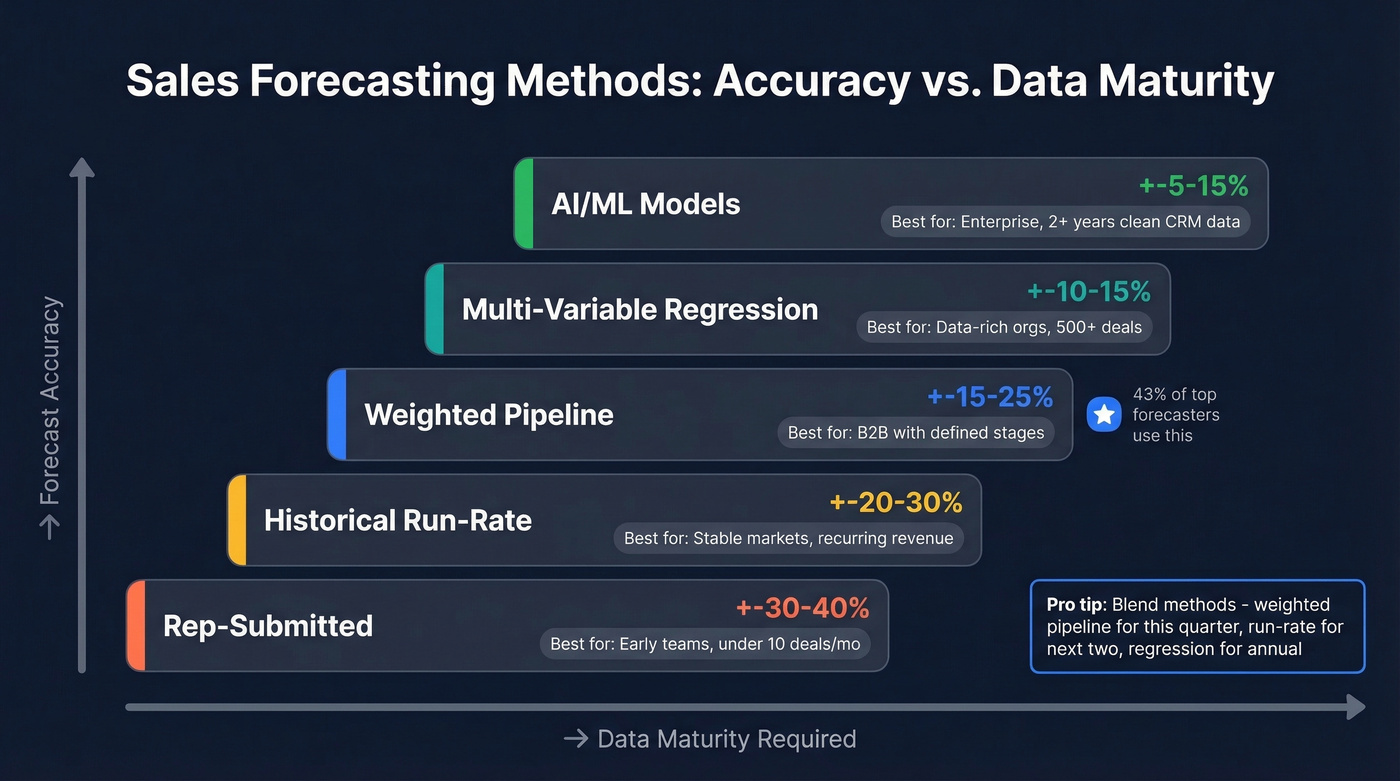
| Method | Best For | Typical Accuracy | Data Required |
|---|---|---|---|
| Rep-submitted | Early teams, <10 deals/mo | +-30-40% | Rep judgment |
| Historical run-rate | Stable markets, recurring rev | +-20-30% | 12+ months history |
| Weighted pipeline | B2B with defined stages | +-15-25% | CRM stage probabilities |
| Multi-variable regression | Data-rich orgs, 500+ deals | +-10-15% | CRM + marketing + activity |
| AI/ML | Enterprise, mature data | +-5-15% | 2+ years clean CRM data |
Rep-submitted forecasting is where most teams start, and it's the least reliable. Reps are optimists by nature - they'll call a deal "likely" when the prospect hasn't responded in two weeks. Historical run-rate works if your market is stable, but it breaks the moment you launch a new product or enter a new segment.
Weighted pipeline is what most B2B teams should use. Assign a close probability to each deal stage, multiply by deal value, and sum it up. 43% of sales leaders who forecast within 10% accuracy use some version of this approach.
The most accurate organizations blend methods: weighted pipeline for the current quarter, historical run-rate for the next two, and regression or AI for annual planning. No single method covers every time horizon well.
Free Sales Forecast Templates by Use Case
Simple Monthly Template
Use this if you're a solo founder or small team with a single product line doing under $50K/month. Key fields: product name, units sold, price per unit, total revenue, and month. Don't overcomplicate early-stage forecasting - you need directional accuracy, not a financial model. Smartsheet offers a clean version you can download and customize in five minutes. This monthly sales forecast template is also a great starting point for teams that want to layer in complexity later.
12-Month Annual Forecast
Your board deck template. Monthly columns, quarterly subtotals, a YoY comparison row, and a growth rate calculation. The YoY comparison is what separates useful forecasts from vanity numbers - it forces you to spot trends rather than just track absolutes. SCORE's 12-month template is a solid starting point for businesses that need something presentation-ready.
Pipeline-Weighted Forecast (B2B)
This is the template most B2B sales teams actually need. Key fields: deal name, stage, probability percentage, expected close date, and weighted value (deal size x probability).
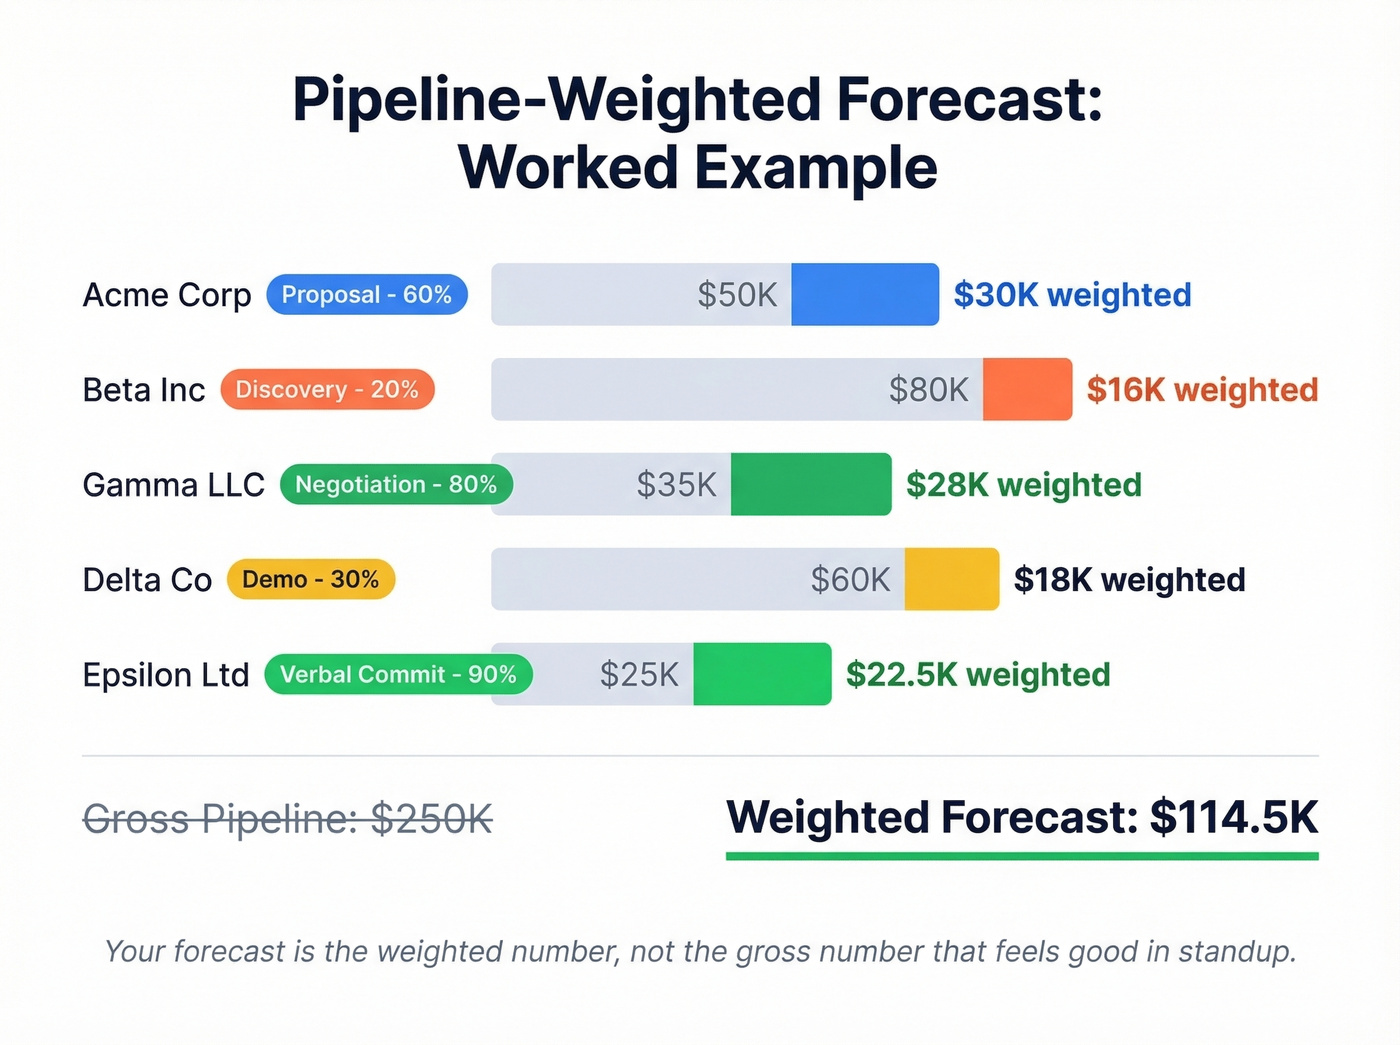
Here's a quick worked example. Say you have five active deals:
- Acme Corp - Proposal stage (60%), $50K deal = $30K weighted
- Beta Inc - Discovery (20%), $80K deal = $16K weighted
- Gamma LLC - Negotiation (80%), $35K deal = $28K weighted
- Delta Co - Demo scheduled (30%), $60K deal = $18K weighted
- Epsilon Ltd - Verbal commit (90%), $25K deal = $22.5K weighted
Total weighted pipeline: $114.5K. That's your forecast - not the $250K gross pipeline number that makes everyone feel good in the Monday standup. Use this sample sales forecast as a benchmark when building your own pipeline model.
Folks on r/ConstructionManagers often need stage-based revenue broken out by month, quarter, and year, plus resource assignments tied to each opportunity. If that's you, add columns for assigned team members and expected project start dates alongside the revenue projections.
SaaS MRR/Churn Forecast
Subscription businesses need a fundamentally different template. Your inputs: new customers per month, ARPU, net churn rate, starting MRR, expansion MRR, and goal MRR. MRR is the atomic unit of SaaS forecasting - ARR is just MRR x 12.
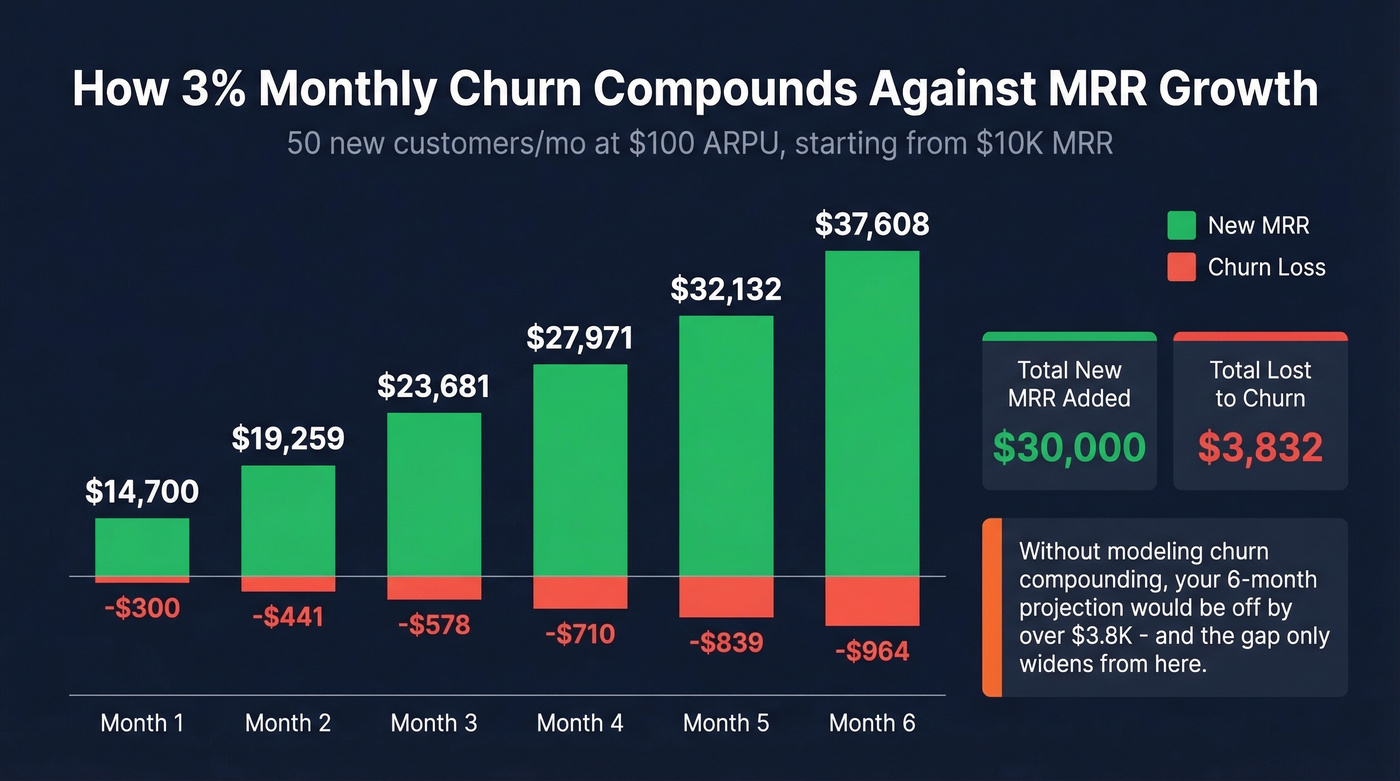
Worked example: 50 new customers per month at $100 ARPU with 3% net monthly churn, starting from $10K MRR.
- Month one adds $5K in new MRR.
- Churn applied to starting MRR costs you $300.
- End of month one: $14,700 MRR.
Small churn compounds fast. By month six, you're at roughly $37.6K MRR, meaning you're losing about $1.1K/month to churn at that point. If your template doesn't model this compounding effect, your annual projection will be wildly optimistic.
Startup Forecast (No Historical Data)
Pre-revenue or sub-six-months of sales data? You can't use historical methods. Use top-down (TAM to SAM to SOM) for 3-5 year projections and bottom-up (funnel conversion rates x average deal size x monthly capacity) for the next 12-24 months.
The bottom-up number is the one investors actually believe. If you tell a VC you'll capture 2% of a $10B TAM, they'll nod politely. Show them that 3 reps making 50 calls/day at a 2% close rate generates $83K/month, and they'll lean in.
Scenario Planning Template
When markets are uncertain - or when you're fundraising - you need three columns: best case, likely case, and worst case for every revenue line. Finance Weekly recommends scenario planning specifically because it prevents the "everything goes right" forecast that boards hate and CFOs distrust.
Build your likely case first, then stress-test it. Best case assumes shorter sales cycles and higher close rates. Worst case assumes a key deal slips, churn ticks up, or a new competitor enters. The gap between best and worst is your risk exposure - and it's the number your board actually wants to discuss.
A note on rolling forecasts: if your current process involves a tangle of SUMIFS and pivot tables that break every time someone inserts a row, your template design is the problem. Build rolling forecasts with a single input tab and a separate calculation tab. Actuals replace projections as each period closes, and nothing breaks downstream.
A weighted pipeline forecast is useless if the deals in it are built on bad contact data. Prospeo gives you 300M+ verified profiles with 98% email accuracy and 125M+ direct dials - so every opportunity in your forecast is built on a real conversation, not a bounced email.
Stop forecasting on phantom pipeline. Start with verified buyers.
Excel's Built-In Forecasting Tools
Most people don't realize Excel has native forecasting functions that go well beyond basic formulas.
FORECAST.LINEAR is the straightforward option. The syntax is =FORECAST.LINEAR(x, known_y's, known_x's), where x is the future date you're projecting. It fits a linear regression and returns a projection. Common errors: #N/A means your x and y ranges are different lengths, #DIV/0! means your x values have zero variance, and #VALUE! means you fed it non-numeric data.
Forecast Sheet (Excel 2016+) is more powerful. It uses Exponential Triple Smoothing (ETS), which auto-detects seasonality. Select your historical data, go to Data > Forecast Sheet, and Excel generates a projection with a 95% confidence interval. It handles around 30% missing data points and lets you set seasonality manually if the auto-detection misses it.
For the data nerds: FORECAST.ETS.STAT exposes error metrics like MASE and sMAPE so you can measure how reliable your projection is. If your MASE is above 1, your forecast is worse than a naive "last month = next month" guess - time to revisit your inputs.
Mistakes That Kill Forecast Accuracy
Most forecast misses aren't math errors. They're process and data errors. Here's the thing: we've seen the same nine mistakes wreck forecasts across dozens of teams, and the fixes are almost always straightforward.
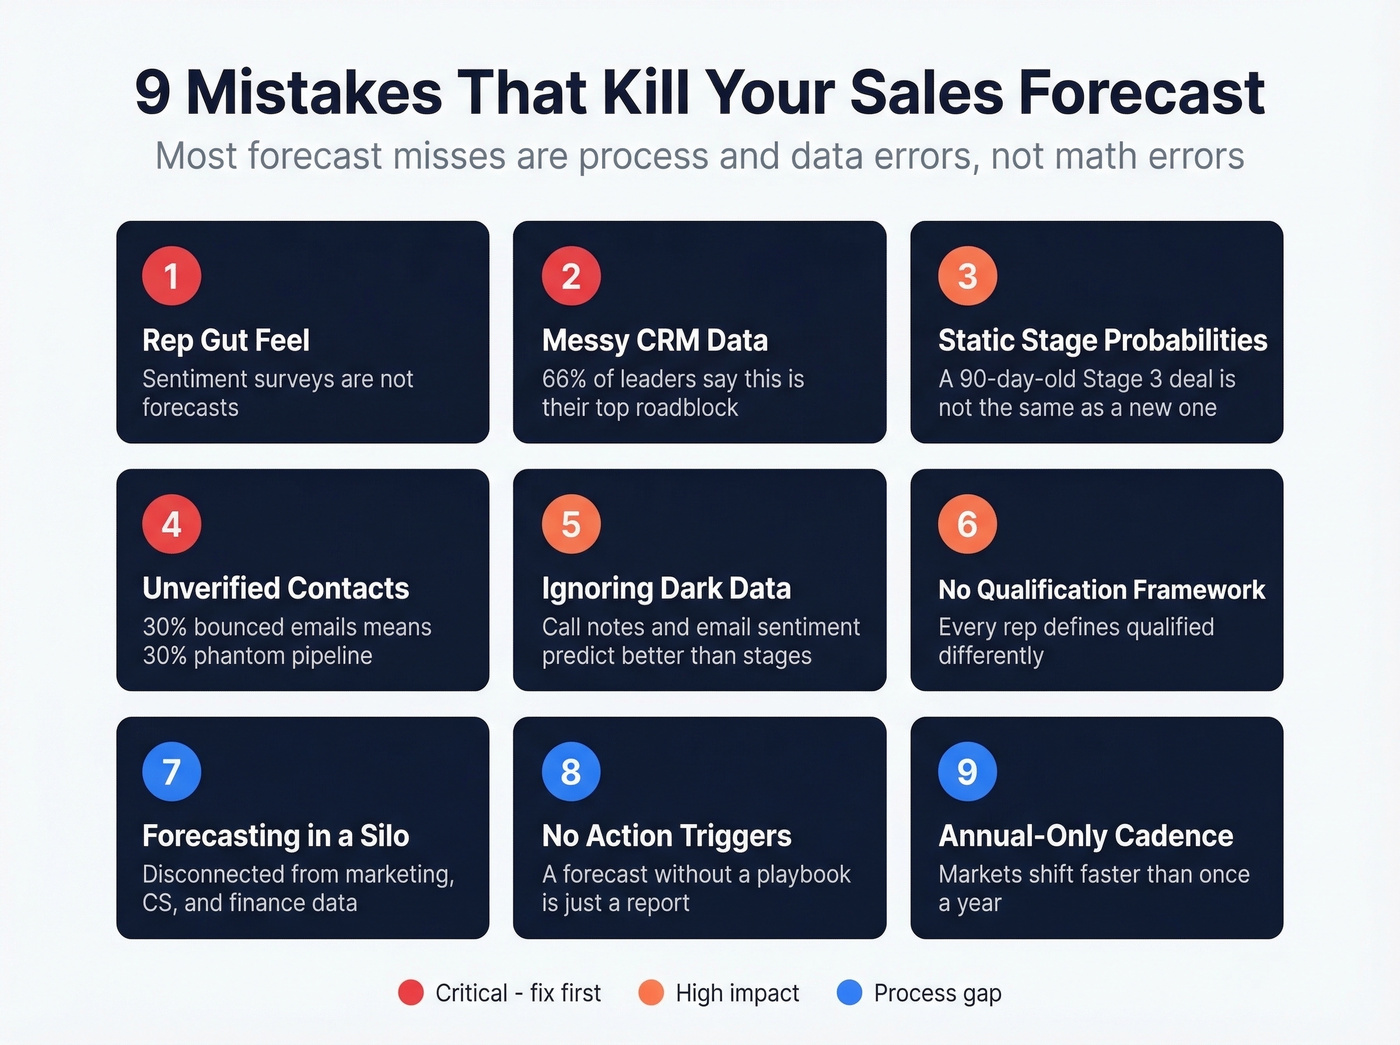
1. Relying on rep gut feel. Reps overweight recent conversations and underweight deal velocity. If your forecast is just a roll-up of rep opinions, you're running a sentiment survey, not a forecast.
2. Messy CRM data. 66% of leaders in the Xactly survey cite inability to access clean historical data as their top forecasting roadblock. No template survives garbage inputs.
3. Static stage probabilities. A deal that's been in Stage 3 for 90 days is fundamentally different from one that arrived yesterday. Your probabilities should account for deal age, not just stage.
4. Building on unverified contact data. If 30% of your "qualified" pipeline has bounced emails or disconnected phones, your weighted forecast is inflated by that same margin. Those aren't real deals - they're phantom pipeline. Prospeo verifies emails at 98% accuracy with a 7-day refresh cycle, so every contact in your pipeline is actually reachable. That alone can close the gap between your forecast and reality.

5. Ignoring dark data. Call notes, email sentiment, meeting frequency - these unstructured signals often predict outcomes better than stage labels.
6. No qualification methodology. Without a consistent framework like MEDDIC or SPICED, every rep defines "qualified" differently. Your pipeline becomes a collection of incompatible definitions masquerading as a single number.
7. Forecasting in a silo. When the sales forecast lives entirely within the sales org - disconnected from marketing pipeline data, customer success churn signals, and finance's cash flow models - you get a number that's internally consistent but externally useless.
8. Never connecting forecast to action. A forecast that doesn't trigger specific decisions is just a report. If your worst-case scenario doesn't come with a pre-agreed playbook - cut spend here, accelerate these deals, pull forward this campaign - you'll spend the quarter reacting instead of executing.
9. Never learning from losses. Skip this if you're already running win/loss analysis. But if you're not feeding those patterns back into your probability model, you're repeating the same errors every quarter.
Here's our hot take: most teams don't need a better template. They need fewer deals in their pipeline. A tight pipeline of 30 well-qualified opportunities will produce a more accurate forecast than 150 deals where half the contacts bounce. Ruthless pipeline hygiene beats sophisticated math every time.
Turning Projections Into a Forecast Report
A forecast sitting in a spreadsheet isn't useful until it's communicated. The best teams turn their raw projections into a recurring sales forecast report that leadership can act on.
Include three sections: a summary of projected vs. actual for the prior period, the current weighted pipeline with deal-level detail, and a risk register highlighting deals that've stalled or slipped stage. Pair this with a weekly forecast submission cadence so reps update their deals before the Monday pipeline review - not during it.
When to Move Beyond Spreadsheets
You've outgrown spreadsheets when multiple people email "forecast_v3_FINAL_final.xlsx" back and forth, when a formula error in one cell cascades through 12 tabs before anyone notices, or when you spend more time maintaining the spreadsheet than analyzing the forecast.
Google Sheets solves the version control problem for most teams - real-time collaboration, one source of truth, no more emailed attachments. You lose Excel's Forecast Sheet tool, but FORECAST.LINEAR is available in both. For teams under 20 people, Google Sheets is usually the right move.
When you need more, CRM-native forecasting is the next step. HubSpot offers a free CRM for up to 2 users, with paid plans from ~$15/user/month. Pipedrive starts at ~$14/user/month with built-in forecasting dashboards. Zoho CRM is free for up to 3 users, with paid tiers from ~$14/user/month.
For the data layer underneath your CRM, Prospeo handles email and phone verification at scale - 143M+ verified emails, 125M+ verified mobiles, with a free tier of 75 emails/month to start. Pair it with any CRM so your forecasts are built on contacts that actually pick up the phone.
FAQ
How often should I update my forecast?
Weekly for pipeline-weighted forecasts during active quarters. Monthly for annual and strategic projections. Rolling forecasts should extend 12-18 months ahead and update monthly, with actuals replacing projections as each period closes.
What's a good forecast accuracy target?
Best-in-class teams hit +-10% of actual revenue. The median is closer to +-20-25%. If you're consistently off by more than 25%, the problem is usually your method or data quality, not the spreadsheet itself.
Can I use Google Sheets instead of Excel?
Yes - and for team forecasting, we'd recommend it. Google Sheets eliminates version control nightmares. You lose Excel's Forecast Sheet ETS tool, but FORECAST.LINEAR works in both platforms.
How does bad contact data affect my forecast?
If 30% of your pipeline has bounced emails or disconnected phones, your weighted forecast is inflated by that same margin. Verifying contact data before it enters your CRM is the fastest way to improve accuracy.
Where can I find a sample sales forecast to benchmark against?
The pipeline-weighted example in this article is a realistic sample for a mid-market B2B team. For industry-specific benchmarks, check SCORE's template library or your CRM's built-in reporting - most platforms let you export anonymized forecast data you can use as a comparison baseline.
Your bottom-up forecast depends on one number: how many qualified conversations your reps actually book. Teams using Prospeo book 26% more meetings than ZoomInfo users - at $0.01 per email. More real pipeline means forecasts you can actually hit.
Fill your pipeline template with contacts that pick up the phone.