Sales Manager KPIs: What to Track, What to Skip, and What "Good" Looks Like
Most sales manager KPI programs are broken. A rep on r/sales described exactly how: they were hitting 60 calls and 60 emails every day, with a manager who ignored the value of the meetings being set. That rep was at 80% of meeting quota, bringing in multiple $100K+ ARR leads on a product averaging $7K ARR - and still getting dinged for activity counts. Activity minimums without outcome context create game players, not sellers. That's the core dysfunction.
The numbers confirm it. Only 43.5% of sales professionals hit quota in recent quarters, and the trend hasn't reversed. Ebsta and Pavilion found 69% of reps fell short. Salesforce's State of Sales report shows reps spend roughly 30% of their time actually selling - the other 70% goes to admin, internal meetings, and CRM hygiene. When more than half your team misses quota and they're only selling a third of the day, that's not a rep problem. It's a measurement problem.
You're either tracking the wrong metrics during that precious 30%, or you're tracking the right things and not acting on them.
The 5 KPIs That Save Your Monday Morning
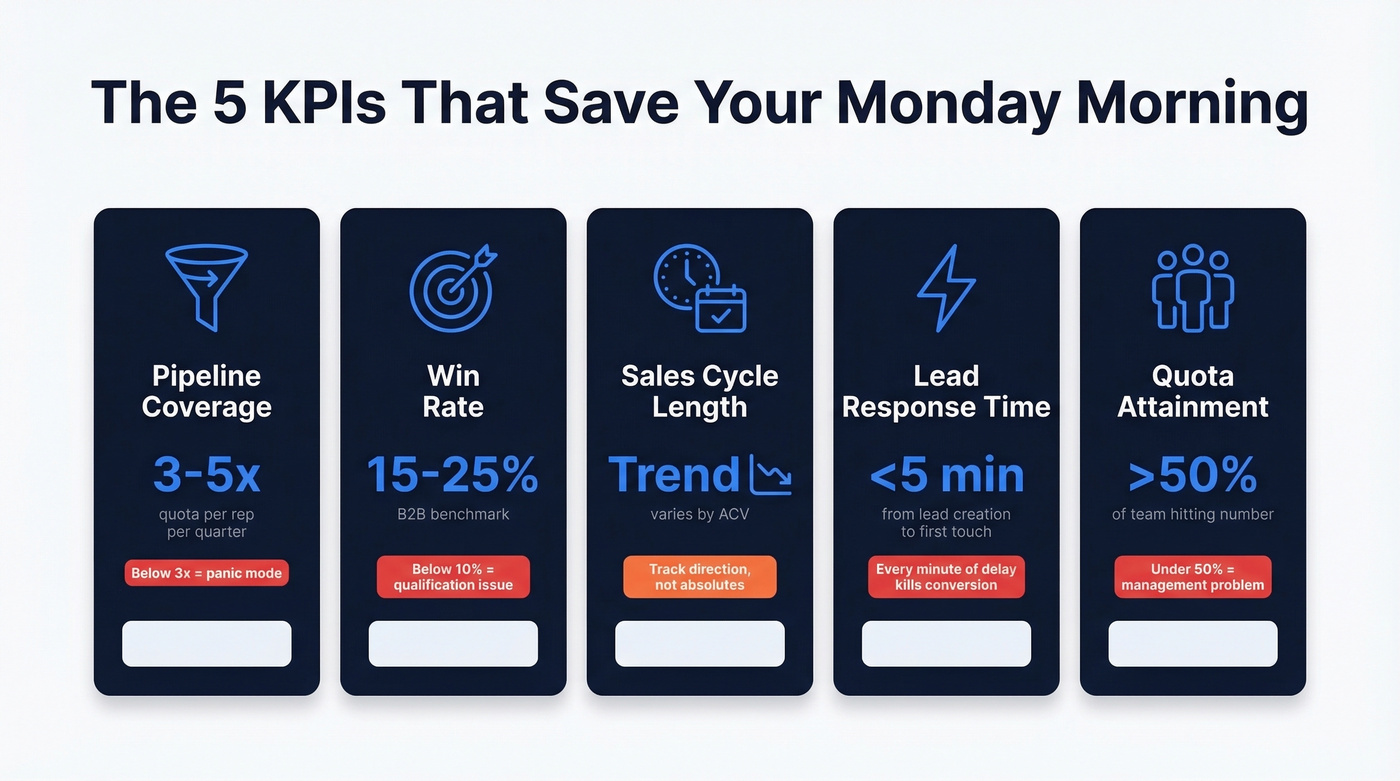
If you track nothing else, track these five. They give you pipeline health, deal quality, velocity, responsiveness, and team performance in one view.
| KPI | Target Range | Why It's First |
|---|---|---|
| Pipeline Coverage | 3-5x quota | Below 3x = panic mode |
| Win Rate | 15-25% B2B | Below 10% = qualification issue |
| Sales Cycle Length | Varies by ACV | Track trend, not absolute |
| Lead Response Time | Under 5 min | Speed-to-lead drives conversion |
| Quota Attainment | >50% of team | Under 50% = management problem |
These five tell you whether your team will hit the number before the quarter ends. Everything else is supporting detail.
KPIs vs. Metrics vs. KRIs
These three terms get used interchangeably, and that's where KPI programs go sideways.
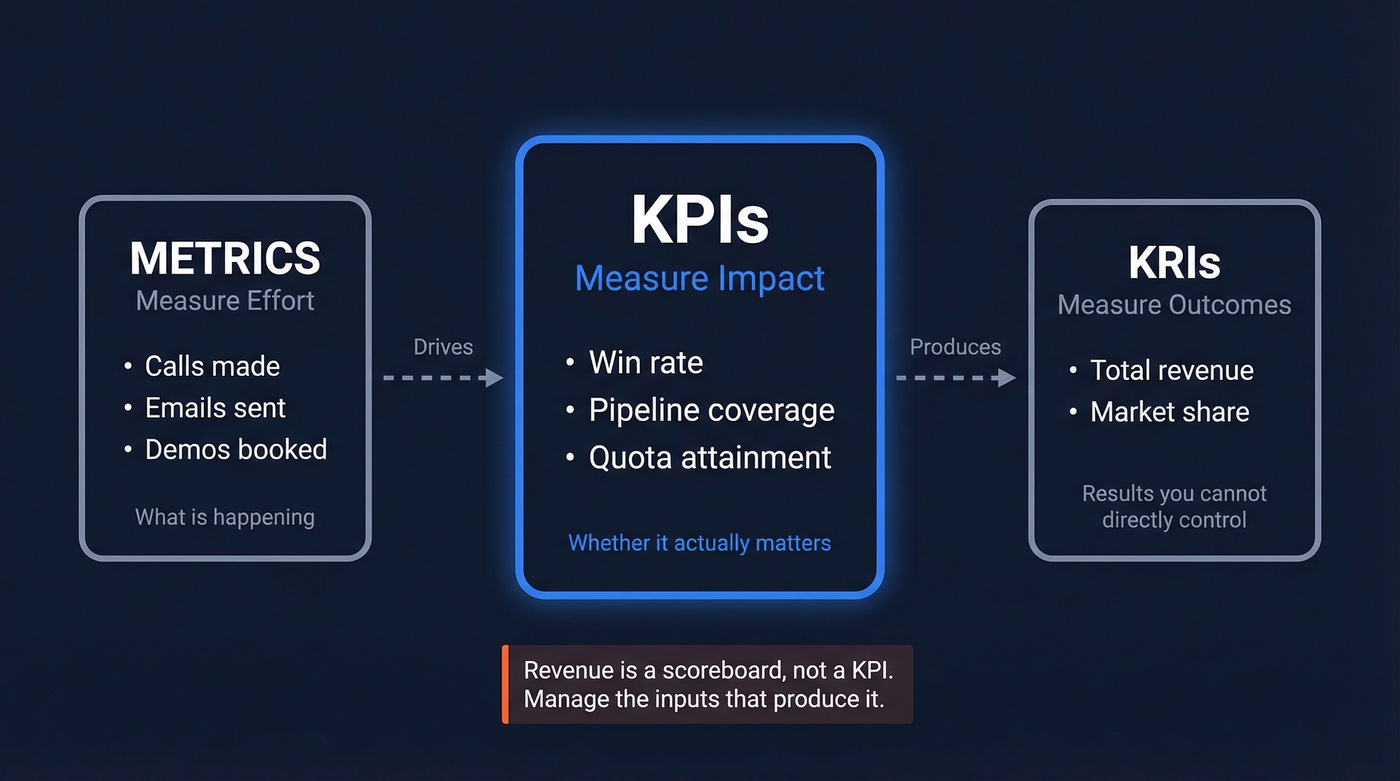
Metrics measure effort. Calls made, emails sent, demos booked - they tell you what's happening. KPIs measure impact: win rate, pipeline coverage, quota attainment. They tell you whether what's happening actually matters. KRIs (Key Results Indicators) measure outcomes you can't directly control, like total revenue.
Here's the contrarian take that'll save you a lot of dashboard clutter: revenue is a scoreboard, not a KPI. You can't manage revenue directly. You manage the pipeline coverage, win rate, and cycle length that produce revenue. KPI Karta makes this argument well - too many companies track everything that's easy to measure, drowning in vanity metrics instead of focusing on the activities and outcomes that actually influence revenue. Once you internalize this, your dashboard gets a lot cleaner.
How to Choose the Right KPIs
HubSpot lists dozens of sales KPIs. That's not a framework - it's a data dump. If you're tracking a sprawling list, you're tracking zero because nothing gets the attention it deserves, and your weekly review turns into a data parade nobody acts on.
The right number is 5-8, split into two categories. Manager-owned KPIs are the ones you're accountable for: pipeline coverage, quota attainment, forecast accuracy, rep ramp time. Rep-monitored KPIs are the ones your reps see daily: lead response time, win rate, activity-to-outcome ratios. You own the system; they own their numbers.
Balance leading and lagging indicators. Pipeline coverage and lead response time are leading - they predict the future. Win rate and quota attainment are lagging - they confirm what already happened. A dashboard with only lagging indicators is a rearview mirror.
McKinsey research shows systematic KPI tracking in data-driven B2B sales engines yields 15-25% EBITDA improvement. HBR found data-driven sales teams achieved 5-6% higher productivity. The payoff is real, but only if you pick the right 5-8 and actually act on them.
The 14 Sales Manager KPIs That Actually Matter
Each KPI below covers what it is, how to calculate it, what "good" looks like, and how often to check it.
Pipeline Coverage Ratio
Total pipeline value divided by quota target. Healthy range is 3-5x per rep per quarter. Below 3x and you're hoping, not selling. This is the single most important Monday morning number - if coverage is thin, nothing else matters until you fix it.
Sales Cycle Length
Average days from opportunity creation to close. Ebsta's benchmark report showed cycles grew 16% in H1 2023 and 38% versus 2021. The absolute number varies wildly by ACV - a $12K deal shouldn't take as long as a $180K enterprise deal. Track the trend, not the benchmark.
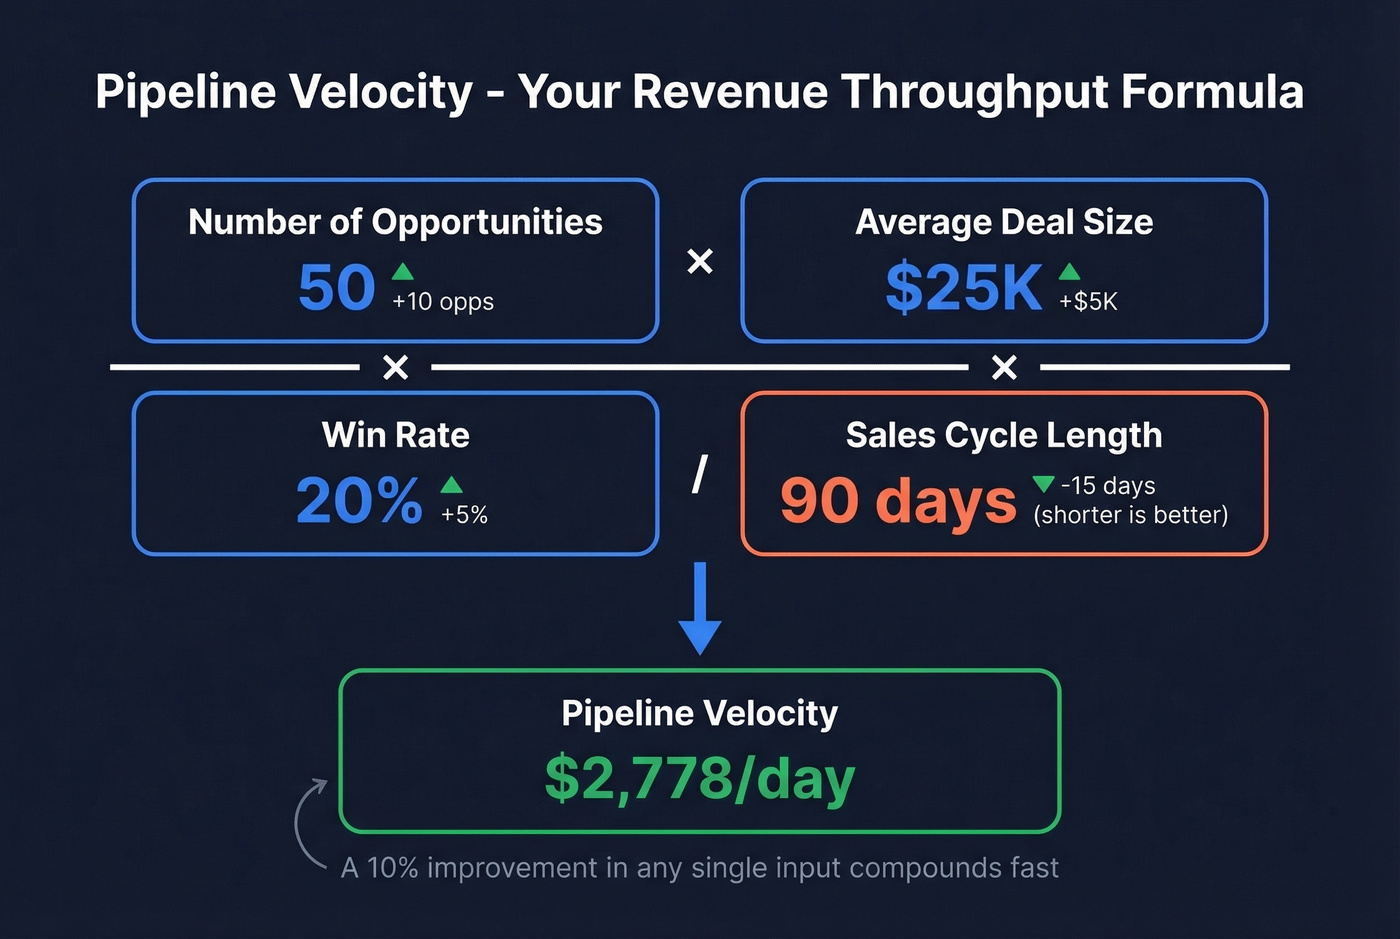
Pipeline Velocity
(Number of opportunities x average deal size x win rate) / sales cycle length. This is your revenue throughput formula. Review it monthly. A small improvement in any single input compounds fast - a 10% win rate bump with everything else flat means 10% more revenue.
Lead Response Time
Minutes from inbound lead creation to first rep touch. Best practice is under 5 minutes. Every minute of delay hurts your contact rate. Check this daily.
One angle worth watching: teams using AI-enhanced outbound sequences are hitting 20-25% connection rates versus 8-15% with traditional cadences. If your lead response time is already under 5 minutes and you're still seeing low connect rates, the problem is channel mix, not speed.
Win Rate
Deals won divided by total opportunities. Healthy B2B range is 15-25%. Win rates declined 18% versus 2022 and 27% versus 2021 across the market. Under 10% signals a qualification problem - you're letting bad deals into the pipeline. Review weekly.
Quota Attainment
Percentage of team hitting or exceeding quota. When under 50% of your team hits quota, that's a management problem, not a talent problem. Your quotas are wrong, your territories are unbalanced, or your enablement is broken. Review monthly and quarterly.
Average Deal Size
Total revenue divided by deals closed. Average deal values have decreased roughly 21% in recent cycles. Shrinking deal sizes with stable win rates means you're discounting or losing upmarket deals. Review monthly.
Upsell / Cross-Sell Rate
Expansion revenue divided by total revenue from existing customers. Tie this directly to your NRR target - if your upsell rate is flat, your CS and sales handoff is broken. Review quarterly.
Customer Acquisition Cost
Total sales and marketing spend divided by new customers acquired. Healthy CAC payback is 15-18 months; elite teams get under 12. LTV:CAC should land between 3:1 and 5:1, with top performers targeting above 4:1. Above 5:1 and you're probably underinvesting in growth. Review quarterly.
Customer Lifetime Value
Average revenue per account x gross margin x average customer lifespan. For SaaS, segment this by plan tier - your enterprise CLV and your SMB CLV are different animals. A blended number hides problems. Review quarterly.
Churn Rate
Customers lost divided by total customers over a period. Annual churn under 7% is acceptable; target under 5%. Separate customer churn from revenue churn (MRR churn) - losing 10 small accounts hits differently than losing one whale. Save rates rarely exceed 30%, so prevention beats recovery every time.
Net Revenue Retention
Starting MRR plus expansion minus contraction minus churn, divided by starting MRR. Top performers run 120%+. Below 100% means your existing base is shrinking - you're filling a leaky bucket. This is the single best health metric for subscription businesses. Review quarterly.
Forecast Accuracy
How close your forecast is to what you actually close:
Forecast Accuracy % = 100% - (|Actual - Forecast| / Forecast x 100)
Consistently off by more than 15%? Your pipeline stages are poorly defined or your reps are sandbagging. Good forecasting requires clean stage definitions and honest deal assessments - not optimism. Review weekly during the last month of quarter.
Rep Ramp Time
Days from hire to first quota-carrying month at full productivity. Rep turnover climbed from 22% to 36% in recent years, and 17% of reps generate 81% of revenue. That "hero rep" concentration means your enablement and ramp process isn't scaling performance across the team. If ramp takes 6+ months, you're burning cash on unproductive seats. Pair this with quarterly eNPS surveys - declining rep satisfaction predicts the turnover that makes ramp time matter.
| KPI | Formula | Benchmark | Cadence |
|---|---|---|---|
| Pipeline Coverage | Pipeline / Quota | 3-5x | Weekly |
| Sales Cycle Length | Avg days to close | Track trend | Monthly |
| Pipeline Velocity | (Opps x ADS x WR) / Cycle | Varies | Monthly |
| Lead Response Time | Minutes to first touch | <5 min | Daily |
| Win Rate | Won / Total opps | 15-25% | Weekly |
| Quota Attainment | % of team at quota | >50% | Monthly |
| Avg Deal Size | Revenue / Deals | Track trend | Monthly |
| Upsell/Cross-Sell | Expansion / Existing rev | Tie to NRR | Quarterly |
| CAC | Total S&M / New custs | 15-18mo payback | Quarterly |
| CLV | ARPA x Margin x Lifespan | Segment by tier | Quarterly |
| Churn Rate | Lost custs / Total | <5-7% annual | Quarterly |
| NRR | (Start + Exp - Contr - Churn) / Start | 120%+ | Quarterly |
| Forecast Accuracy | 100% - (|A-F| / F) | +/-10-15% | Weekly (end of Q) |
| Rep Ramp Time | Days to full productivity | Track trend | Quarterly |
Pipeline coverage below 3x? The problem isn't effort - it's reach. Prospeo gives your reps 300M+ verified profiles with 30+ filters so they fill pipeline with qualified deals, not dead contacts. 98% email accuracy means reps sell instead of chasing bounces.
Stop tracking KPIs on a pipeline built with bad data.
KPI Review Cadence
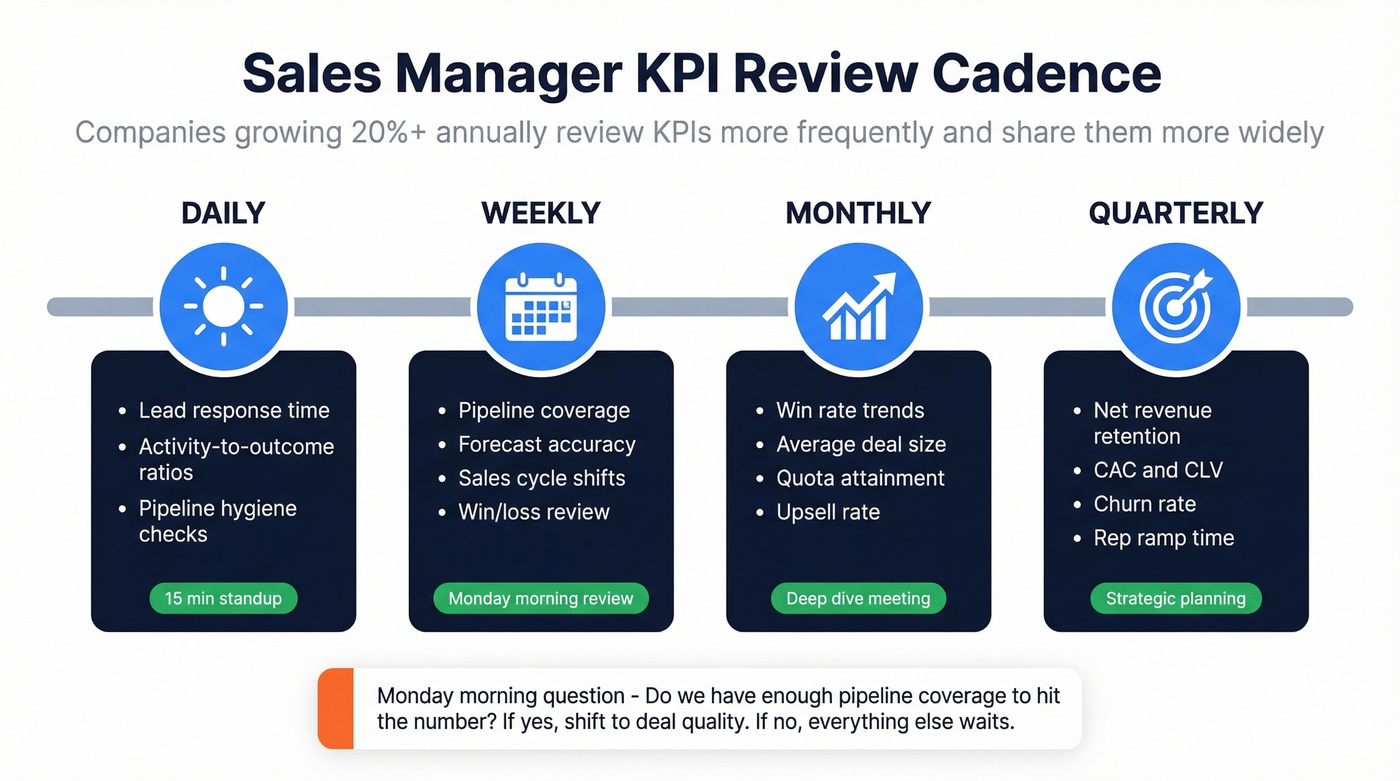
A ZS study of 250 mid-market B2B firms found that companies growing 20%+ annually review KPIs more frequently, track more metrics, and share them more widely. That's not busywork - it's a competitive advantage worth calling out, because most managers treat KPI reviews as a chore rather than a growth lever.
| Daily | Weekly | Monthly | Quarterly |
|---|---|---|---|
| Lead response time | Pipeline coverage | Win rate trends | NRR |
| Activity-to-outcome | Forecast accuracy | Avg deal size | CAC / CLV |
| Pipeline hygiene | Sales cycle shifts | Quota attainment | Churn rate |
| - | Win/loss review | Upsell rate | Rep ramp time |
Your Monday morning pipeline review should take 15 minutes and answer one question: do we have enough coverage to hit the number? If yes, shift to deal quality. If no, everything else waits.
5 KPI Mistakes That Tank Teams
1. Activity obsession without outcome context. Remember that Reddit SDR doing 60 calls and 60 emails daily while bringing in $100K+ ARR leads? Their manager was measuring the wrong thing. Activity minimums are guardrails, not goals. Track them, but never let them overshadow conversion and revenue KPIs.
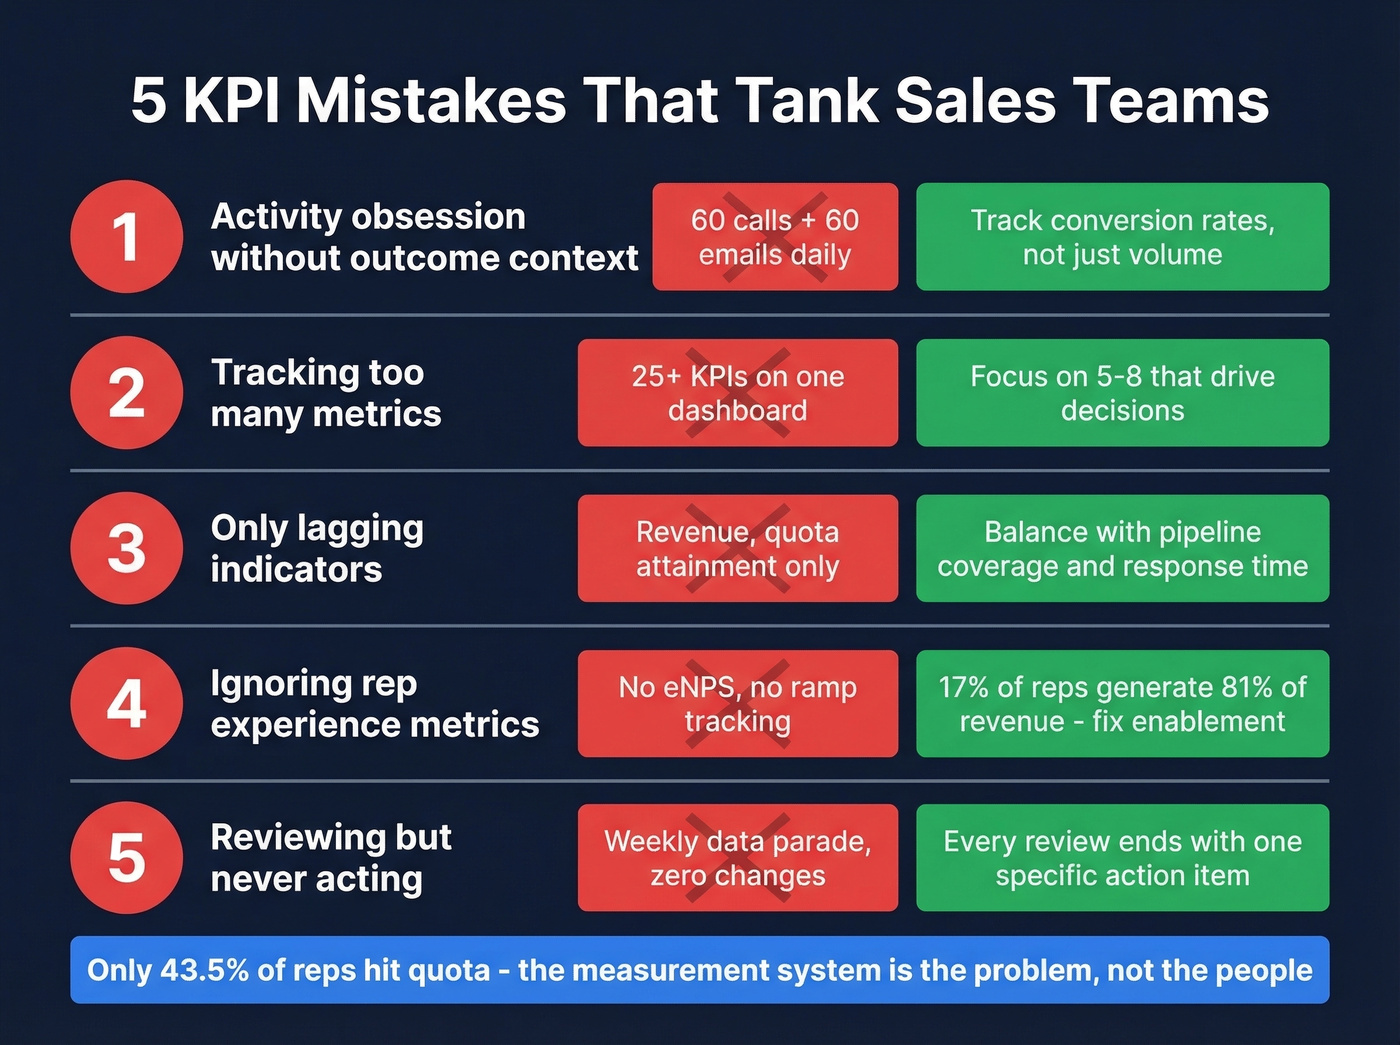
2. Tracking too many KPIs. Bernard Marr nailed it - most companies are "data rich, but insight poor." When your dashboard has 25 metrics, nobody knows which five actually matter. Cut ruthlessly. Klipfolio's research confirms that KPI overload is one of the main reasons dashboards get ignored.
3. No benchmarks. Telling a rep their win rate is 18% means nothing without context. Is that good? Bad? Trending up? Every KPI needs a target and a trend line. Formulas without targets is malpractice.
4. No action on data. Jerry Muller wrote an entire book (The Tyranny of Metrics) about measurement replacing judgment. If your weekly review is a data parade with no follow-up actions, you're performing management theater. Every KPI review should end with "so what are we doing about it?"
5. Ignoring data quality. This one's quiet and corrosive. Bad data doesn't just waste rep time - it makes every KPI on your dashboard unreliable. And unlike the other four mistakes, you won't notice it until the damage is already done.
The Data Quality Problem Nobody Talks About
Every KPI on your dashboard is only as reliable as the data feeding it. If 20% of your pipeline emails bounce, your conversion rate is fiction. If phone numbers are wrong, your lead response time metric looks fine while actual connect rates tank. Pipeline value, forecast accuracy, win rate - all of it becomes noise when the underlying contact data is stale.
Let's be honest: most B2B databases refresh around every 6 weeks. That's a lot of job changes, bounced emails, and dead phone numbers accumulating between updates. We've seen teams discover that 15-25% of their "active pipeline" was built on dead email addresses. That's not a data problem - it's a forecasting crisis hiding in plain sight.

Prospeo runs a 7-day refresh cycle across 300M+ professional profiles, with 98% email accuracy and a 92% API match rate. It integrates natively with Salesforce and HubSpot, so your CRM stays clean without manual effort. The free tier gives you 75 verified emails per month plus 100 Chrome extension credits - enough to audit your current pipeline data and see how much of it is actually valid.
Here's a hot take: if your average deal size clears $10K and you're running outbound, bad data is probably costing you more than a bad hire. A bad hire wastes one seat. Bad data wastes every seat.
Lead response time under 5 minutes only matters if you're reaching the right person. Prospeo's 125M+ verified mobile numbers hit a 30% pickup rate - 3x the industry average. Your reps connect faster, your win rate climbs, and your quota attainment stops being a management problem.
Turn your lead response KPI into actual conversations.
Tools for Tracking Sales KPIs
You need three layers: a CRM for pipeline data, a dashboard for visualization, and a data quality layer to keep everything honest. Teams that invest in all three consistently outperform those relying on CRM alone.
| Category | Tool | Starting Price |
|---|---|---|
| CRM | Salesforce | ~$25-$500/user/mo |
| CRM | HubSpot | Free; paid Sales Hub ~$20-$150/user/mo |
| CRM | Pipedrive | ~$15-$100/user/mo |
| BI / Dashboards | Tableau | ~$15-$75/user/mo |
| BI / Dashboards | Power BI | Free-$10/user/mo |
| BI / Dashboards | Plecto | Starts ~$200/mo |
| Data Quality | Prospeo | ~$0.01/email, free tier |
Skip the data quality layer if your pipeline is tiny and you're doing five deals a quarter. For everyone else, it's non-negotiable - stale records corrupt every metric downstream.
FAQ
What's the difference between a KPI and a metric?
Metrics measure activity (calls, emails, demos); KPIs measure outcomes tied to business goals like win rate or pipeline coverage. Cirrus Insight draws the line clearly: track metrics for coaching, track KPIs for performance management. The distinction keeps your dashboard focused on what drives revenue.
How many KPIs should a sales manager track?
Five to eight. More than that and nothing gets the attention it deserves. Pick the KPIs that directly connect to your team's revenue target and push everything else into a secondary report you check monthly at most.
What's a good B2B win rate?
Healthy B2B win rates fall between 15% and 25%. Under 10% signals a qualification problem - too many bad-fit deals entering the pipeline. Above 30% likely means you aren't prospecting aggressively enough and are only pursuing sure things.
How often should I review sales KPIs?
Daily for lead response time and pipeline hygiene. Weekly for pipeline coverage and forecast accuracy. Monthly for win rate, deal size, and quota attainment. Quarterly for NRR, churn, and CAC. The ZS study found 20%+ growers share KPIs more widely and more often - frequency isn't busywork, it's a growth signal.
How does data quality affect sales KPIs?
Bad contact data inflates pipeline values and deflates conversion rates, making every downstream KPI unreliable. In our experience, teams running outbound with stale data don't just miss quota - they miss it while believing their pipeline is healthy, which is worse. A 7-day data refresh cycle and verified emails keep your metrics reflecting reality instead of ghosts.