Sales Rep Performance Metrics: What to Track, What "Good" Looks Like, and What Everyone Gets Wrong
A RevOps lead we know pulled up her team's dashboard last quarter - 47 metrics across three tabs, color-coded like a Christmas tree. Nobody looked at it. Reps hit their call targets, pipeline coverage showed 4x, and the board deck looked great. Then Q3 closed at 62% of plan. The dashboard didn't lie, exactly. It just measured the wrong things, the wrong way, with dirty data underneath.
70% of B2B reps missed quota in recent years. Meanwhile, 17% of reps generate 81% of revenue. If your metrics framework can't explain that gap - or help you close it - you don't have a performance system. You have a glossary with charts.
Quick version: Start with five metrics: quota attainment, win rate, pipeline coverage, sales cycle length, and activity-to-meeting conversion rate. Track 5-8 per role, not 30 per org. Pair every speed or volume metric with a quality counterweight - we call these "tension metrics." And the part nobody mentions: your metrics are only as good as your data. If your email bounce rate is above 5%, fix your contact data before you build dashboards.
What Are Sales Performance Metrics?
Sales performance metrics are quantifiable measures of how effectively a rep turns activity into revenue. The distinction between "metrics" and "KPIs" matters more than most people think: all KPIs are metrics, but not all metrics are KPIs. Your KPIs are the 5-8 numbers tied directly to goals and comp plans. Everything else is a diagnostic metric you check when a KPI goes sideways.
The more useful distinction is leading vs. lagging. Lagging indicators - revenue closed, quota attainment, win rate - tell you what happened. Leading indicators - calls made, meetings booked, pipeline created - tell you what's about to happen. You need both, but most teams drown in lagging metrics and wonder why they can't course-correct mid-quarter.
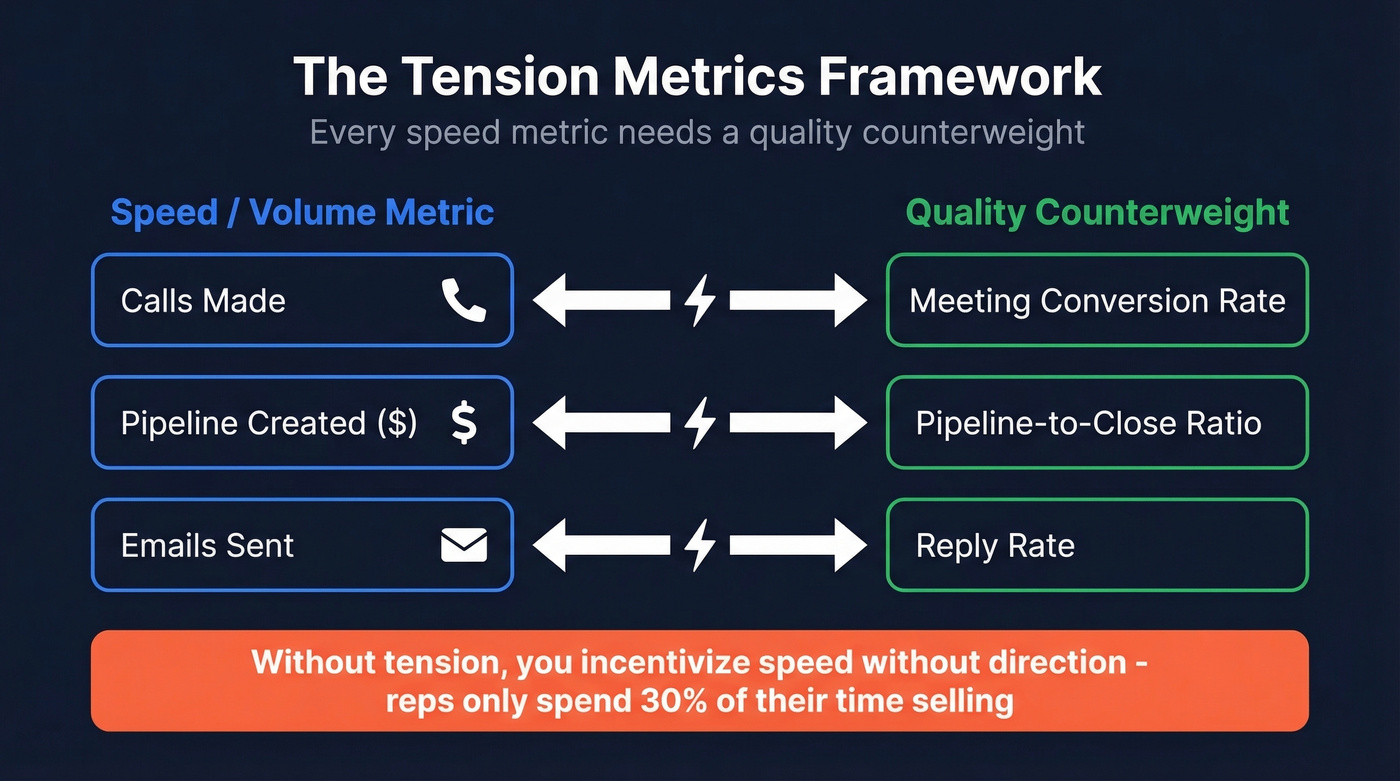
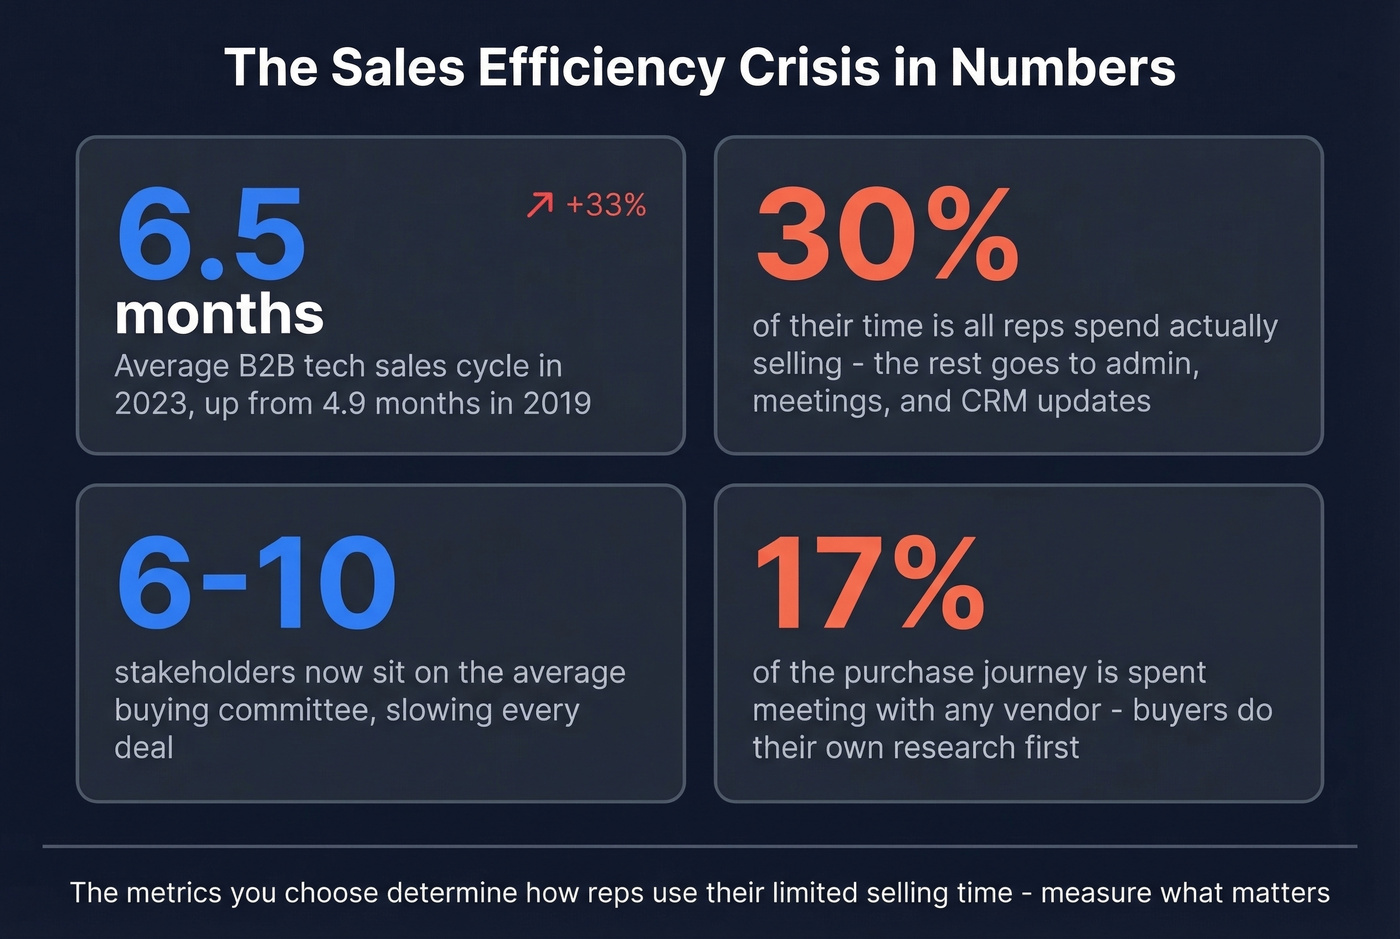
Here's the concept that ties it together: tension metrics. For every speed or volume metric you track, pair it with a quality counterweight. Track calls made? Also track meeting conversion rate. Track pipeline created? Also track pipeline-to-close ratio. Without tension, you're incentivizing speed without direction. Reps spend only about 30% of their time actually selling, so the metrics you choose determine how that 30% gets used.
Core Metrics Every Sales Team Should Track
Five categories. For each: the formula, a worked example, a benchmark range, and how often to check it.
Pipeline Metrics
Pipeline value is the total dollar amount of open opportunities at any point. Simple, but only useful when segmented by stage and age. A $2M pipeline where 60% of deals have been stuck in "discovery" for 90 days isn't a $2M pipeline - it's fiction.
Pipeline coverage is the metric that actually predicts quarter outcomes. The formula: total pipeline value / quota target. If your team has a $500k quota and $1.75M in pipeline, that's 3.5x coverage. The target range is 3.1x-4x for most teams, with enterprise orgs pushing to 5x+ because their win rates are lower and cycles are longer. Three-times coverage used to be the standard. It's not enough anymore.
Pipeline velocity measures how fast deals move through your funnel: (number of opportunities x average deal value x win rate) / sales cycle length in days. This is the single best composite metric because it captures volume, value, quality, and speed in one number. Track it monthly.
Activity Metrics
Calls, emails, meetings booked, demos scheduled - these are the inputs that feed everything downstream. The trap is treating them as outcomes.
An SDR team that logged 500 calls and booked 3 meetings isn't "crushing activity." They have a 0.6% conversion rate, which means something is broken - targeting, messaging, or data quality. Activity without conversion context is a vanity metric. Always pair activity counts with a conversion rate.
One critical caveat for 2026: Apple Mail Privacy Protection inflates open rates by pre-loading tracking pixels. Open rates are dead. Track reply rate instead - it's the only email success metric that actually correlates with pipeline.
Conversion and Win Rate
Win rate is closed-won deals / total opportunities in the same cohort. If your team created 100 opportunities last quarter and closed 21, that's a 21% win rate. The average B2B win rate sits at roughly 20-21%, but that average hides enormous variation by deal size:
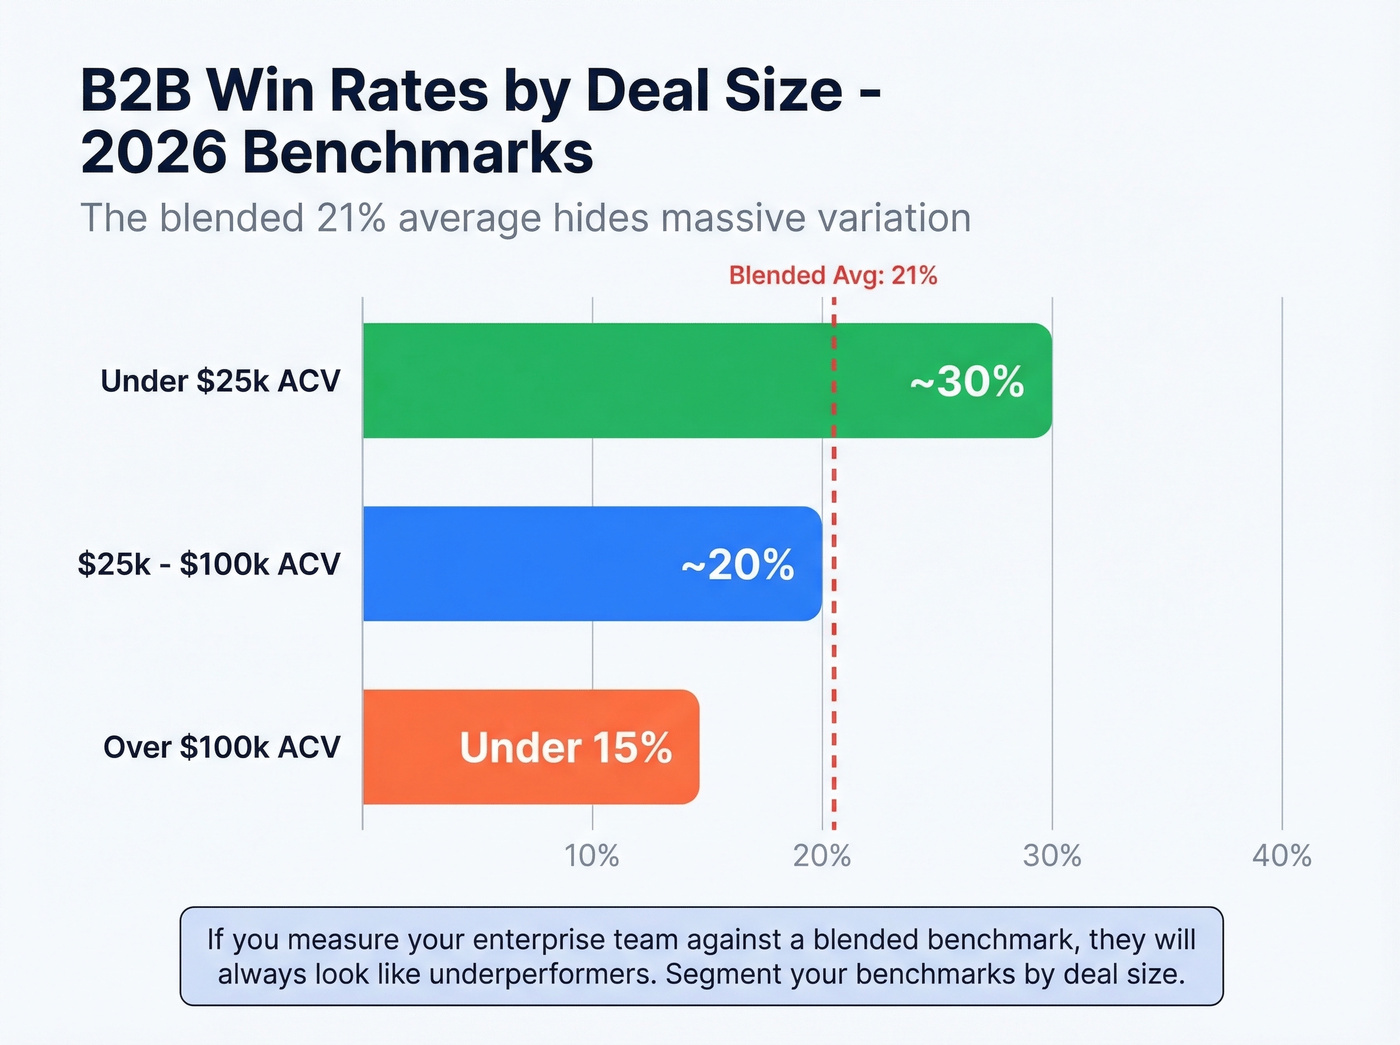
- Under $25k: ~30%
- $25k-$100k: ~20%
- Over $100k: often under 15%
If you're measuring your enterprise team against a blended 21% benchmark, you're setting them up to look like underperformers. Segment your benchmarks by deal size - and track win rate by individual rep to surface coaching opportunities.
Lead-to-opportunity conversion and opportunity-to-close rate break the funnel into diagnostic pieces. When win rate drops, these sub-metrics tell you where the leak is: top of funnel (bad leads) or bottom (poor closing execution).
Efficiency Metrics
Sales cycle length is the average number of days from opportunity creation to close. The average B2B tech sales cycle hit 6.5 months in 2023, up from 4.9 months in 2019 - a 33% increase. Buying committees now average 6-10 stakeholders, and buyers spend just 17% of their purchase journey meeting with vendors. That explains the stretch.
By deal size:
- Under $25k ACV: ~90 days
- $25k-$100k: 3-6 months
- Over $100k: 6-9+ months
Revenue per rep is total revenue / number of quota-carrying reps. It's the efficiency metric boards care about most. But practitioners on r/salestechniques are pushing for revenue per rep hour, which accounts for the reality that reps spend wildly different amounts of time on selling vs. admin. Harder to measure, but it actually reveals productivity differences.
Customer Metrics
For account managers and post-sale teams, the metrics shift entirely. Net revenue retention (NRR) is the gold standard - it captures churn, contraction, and expansion in one number. Anything above 110% means your existing customers are growing faster than they're leaving.
Expansion revenue as a percentage of total revenue tells you whether your growth is sustainable or dependent on new logos. Retention rate is the baseline: if it's below 85%, fix that before optimizing anything else.
Core Metrics Reference Table
| Metric | Formula | Benchmark | Cadence |
|---|---|---|---|
| Pipeline coverage | Pipeline / quota | 3.1x-4x (5x+ enterprise) | Weekly |
| Pipeline velocity | (Opps x ACV x win%) / cycle days | $50k-$200k/day by segment | Monthly |
| Win rate | Won / total opps | 20-21% avg B2B | Monthly |
| Sales cycle length | Avg days, create to close | 90-270 days by ACV | Quarterly |
| Quota attainment | Actual revenue / quota | ~35-45% of reps hit target | Monthly |
| Activity-to-meeting | Meetings / activities | 2-5% outbound | Weekly |
| Reply rate | Replies / emails sent | 3.4% avg, 5.5% top quartile | Weekly |
| Revenue per rep | Revenue / reps | $500k-$1.2M by segment | Quarterly |
| NRR | (Start + expansion - churn) / start | 110%+ best-in-class | Quarterly |
2026 Benchmarks by Segment
Benchmarks without segment context are useless. An SMB velocity team and an enterprise field sales team operate in different universes - comparing reps across these segments without adjusting for deal complexity and cycle length leads to bad coaching decisions.
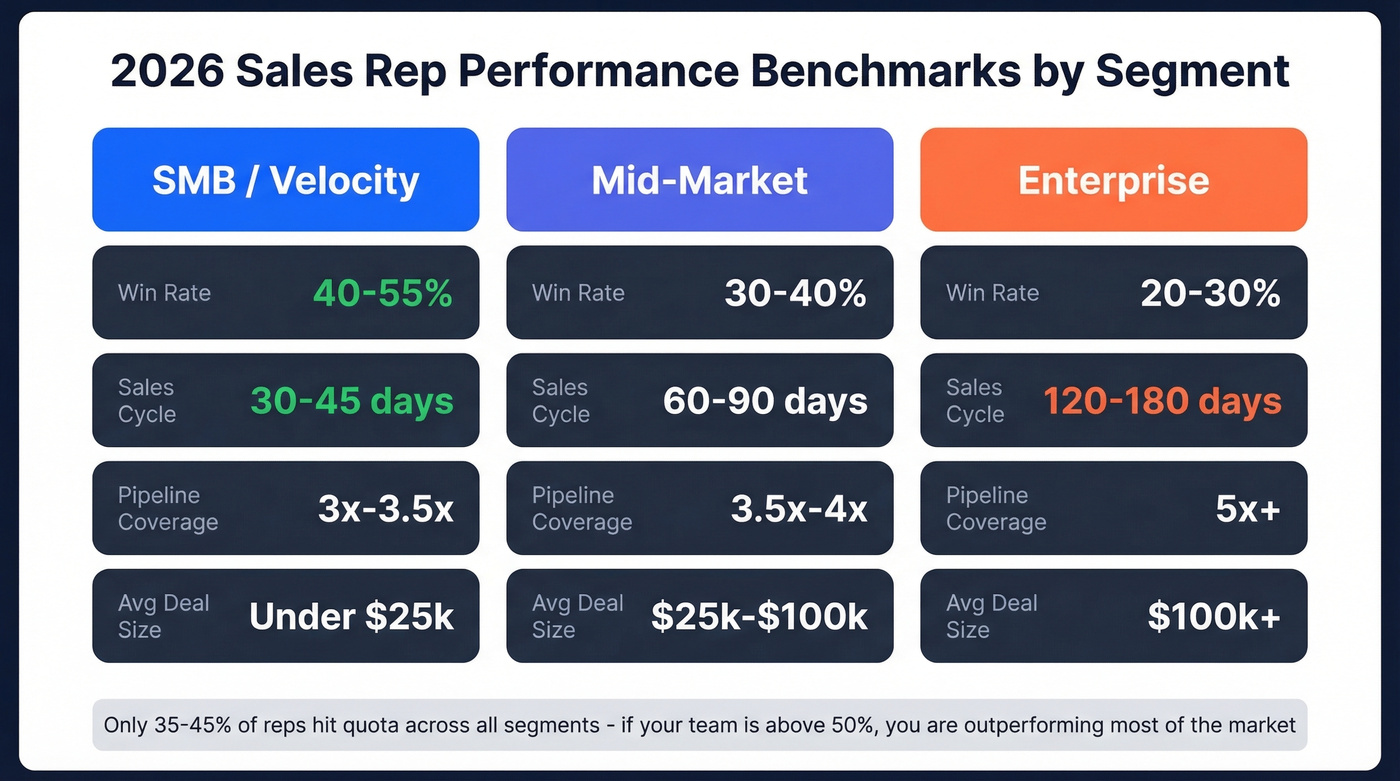
| Metric | SMB / Velocity | Mid-Market | Enterprise |
|---|---|---|---|
| Win rate | 40-55% | 30-40% | 20-30% |
| Sales cycle | 30-45 days | 60-90 days | 120-180 days |
| Pipeline coverage | 3x-3.5x | 3.5x-4x | 5x+ |
| Avg deal size | Under $25k | $25k-$100k | $100k+ |
Ranges compiled from Aviso's segment benchmarks and Kondo's B2B sales data insights.
Quota attainment is the metric where the industry narrative gets messy. Salesforce research pegged it at just 16% of reps hitting quota in 2023. RepVue's Cloud Sales Index showed 43.5% in Q1 2024. Ebsta x Pavilion reported 69% of reps falling short. The discrepancy comes from methodology - what counts as "hitting quota" and which populations get surveyed. The honest read: somewhere between a third and the mid-40s of reps are hitting target in a normal year. If your team is above 50%, you're outperforming most of the market.
For outbound SDRs specifically:
- Reply rate: 3.43% average, 5.5% top quartile, above 10.7% is elite
- Meetings booked: 8-15 per rep per month
- Pipeline generated: $300k-$500k per SDR per quarter
If your SDRs are below these ranges, the problem is usually targeting (wrong ICP), messaging (generic templates), or data quality (emails bouncing, phones disconnected).
Role-Based Scorecards: SDR vs. AE vs. AM
One scorecard doesn't fit three roles. The weighting shifts dramatically depending on whether someone's job is to create pipeline, close it, or grow it. Inbound leads convert at 70-80%, while outbound converts at 5-10% - so segment your benchmarks by sales motion, not just role.
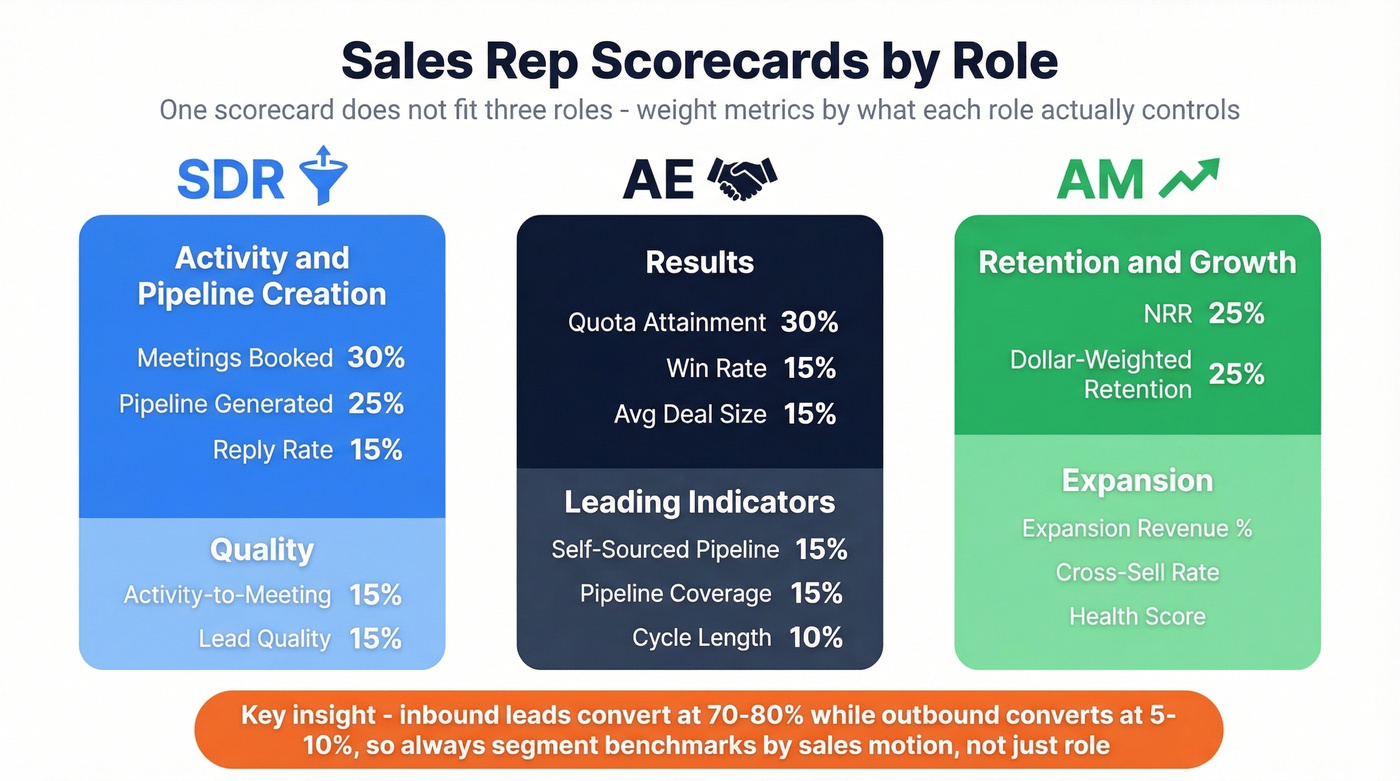
SDR Scorecard
SDRs live in the top of funnel. Weight their scorecard 70% toward activity and pipeline creation, 30% toward quality.
| Metric | Weight | Target Range |
|---|---|---|
| Meetings booked | 30% | 8-15/month |
| Pipeline generated | 25% | $300k-$500k/quarter |
| Reply rate | 15% | 5%+ |
| Activity-to-meeting rate | 15% | 2-5% |
| Lead quality (SAL rate) | 15% | 60%+ accepted |
AE Scorecard
AEs own the outcome. Weight 60% toward results, 40% toward leading indicators that predict next quarter.
The biggest mistake we see with AE scorecards is ignoring self-sourced pipeline. An AE who closes $1M but sources none of it is a closer, not a full-cycle rep - and that distinction matters when inbound dries up.
Quota attainment carries the most weight at 30%, followed by win rate and self-sourced pipeline at 15% each. Pipeline coverage at 15% ensures they're not living quarter-to-quarter. Average deal size at 15% should trend up QoQ - if it's shrinking, the rep is discounting or avoiding enterprise conversations. Sales cycle length at 10% rounds it out: at or below segment average, with any upward trend triggering a deal-review conversation.
AM Scorecard
Account managers protect and grow the base. Here's the red flag most AM scorecards miss: a 95% renewal rate looks great until you realize the accounts that churned were your three largest. Always track dollar-weighted retention alongside logo retention.
- NRR above 110% - the single number that tells you if the book is healthy
- Expansion revenue at 15-20% of book - proves the AM is selling, not just servicing
- Renewal rate above 90% - weighted by revenue, not just logos
- Customer health score green for 80%+ of accounts - early warning system
- QBR completion at 100% - non-negotiable, because every missed QBR is a churn risk you didn't see coming
You read it above: activity without conversion context is a vanity metric. When reps log 500 calls and book 3 meetings, the problem isn't effort - it's bad contact data. Prospeo delivers 98% email accuracy and 125M+ verified mobile numbers with a 30% pickup rate, so every dial and send actually reaches a real buyer.
Stop measuring activity on top of broken data.
How Reps Game Your Metrics
Every metric you track creates an incentive. Some of those incentives are perverse. Here are the four gaming patterns we see most often.
Pipeline stuffing. Reps create opportunities for every conversation to inflate coverage numbers. The pipeline looks healthy at 5x. Then 60% of those "opportunities" never advance past stage one. Fix: track pipeline-to-close ratio alongside coverage. If coverage is 5x but close ratio is 8%, the pipeline is fiction.
Stage inflation. Reps push deals to later stages prematurely to hit stage-conversion targets or make the forecast look strong. Fix: define stage exit criteria with verifiable evidence - mutual action plan signed, budget confirmed in writing - and audit a random sample monthly.
Activity spam. Log 80 calls a day by dialing and hanging up after one ring. Send 200 templated emails with zero personalization. The dashboard shows "high activity." Fix: pair activity volume with reply rate and meeting conversion. If someone's making 80 calls and booking 1 meeting, the activity metric is lying to you.
Sandbagging. Top reps hold deals to next quarter to bank an easy start. Fix: track deal velocity by stage and flag opportunities that stall suspiciously close to quarter boundaries.
The consensus on r/sales is that the problem isn't gaming itself - it's inconsistent enforcement. When your top performer sandbags and nobody says anything, but your struggling rep gets coached on call volume, you've destroyed trust in the system. Tension metrics only work if they apply to everyone.
Setting Goals That Drive Results
Companies that use structured scorecards see 28% higher win rates than those relying on ad-hoc reporting. That alone justifies the effort.
Let's clarify a distinction that trips up most teams: a scorecard isn't a dashboard. A scorecard tracks performance against goals over time. A dashboard is a real-time snapshot. You need both, but they serve different purposes - the scorecard drives coaching conversations, the dashboard drives daily decisions.
Build your scorecard in three layers:
- Activity layer (leading, weekly): calls, emails, meetings booked, reply rate
- Pipeline layer (mid-funnel, weekly/monthly): pipeline created, coverage, stage conversion, velocity
- Outcome layer (lagging, monthly/quarterly): quota attainment, win rate, revenue per rep, cycle length
Review activity weekly, pipeline bi-weekly, and outcomes monthly. Quarterly, zoom out and assess trends. Are win rates improving? Is cycle length creeping up? Is pipeline coverage masking quality problems? This is where you spot patterns that weekly snapshots miss.
Here's our hot take: if your average deal is under $15k, you probably don't need half the metrics in this article. Track win rate, pipeline coverage, and activity-to-meeting conversion. That's it. The elaborate scorecard frameworks are for teams with enough deal volume and cycle complexity to justify the overhead. Skip the 47-metric dashboard and focus on three numbers you'll actually act on.
None of this works if your underlying data is garbage. We've seen teams where reps email 500 contacts a week and 40% bounce - that inflates activity metrics while deflating conversion metrics, and every downstream number is distorted. Use 5% as a hard internal bounce-rate threshold: if you're above it, fix your contact data before you trust any dashboard. Snyk's 50-person sales team saw bounce rates drop from 35-40% to under 5% after switching to Prospeo, which meant their activity and conversion metrics finally reflected reality instead of data rot.

Coaching with Individual Performance Data
Performance metrics tell you what happened. Coaching metrics tell you why - and whether your investment in development is paying off.
The conversation-level metrics that matter most: talk-to-listen ratio (your best reps listen more than they talk), question rate (discovery questions per call), next-step compliance (did the rep secure a concrete next step), and time-in-stage (how long deals sit at each pipeline stage before advancing or dying).
For measuring coaching program effectiveness, two formulas matter. Coaching cadence compliance is completed coaching sessions / scheduled sessions x 100. If managers are scheduled for weekly 1:1s but only complete 60% of them, the coaching program exists on paper only. Rep coaching coverage is reps receiving coaching / total active reps x 100. Segment by tenure - new hires inflate this number because they get more onboarding attention. What you want to know is whether your mid-tenure reps at 6-18 months are getting coached consistently.
A sobering stat: teams review only 0.6% of overall call volume. Coaching decisions are based on a tiny, likely non-representative sample. Conversation intelligence tools help, but expect 3-6 weeks of data before you have a reliable coaching signal for any individual rep.
One caveat on quality scores: if multiple managers are scoring calls, calibrate regularly. Without inter-rater reliability, your "coaching quality" metric is just noise.
Tools for Tracking Rep Performance
You don't need a $100k tech stack to track rep performance. You need three layers.
CRM is the foundation. Salesforce runs ~$25-$165+/user/month depending on edition. HubSpot ranges from free to ~$150+/user/month depending on seat and tier. Pipedrive sits at ~$15-$100/user/month. The CRM itself isn't the differentiator - the data inside it is.
Revenue intelligence tools like Clari, Gong Forecast, and Aviso layer forecasting and pipeline analytics on top of your CRM. These typically run $30-80/user/month and are worth it once you have 10+ reps. For teams under that threshold, a well-maintained CRM with custom reports gets you 80% of the way there.
Conversation intelligence platforms like Gong and Clari Copilot capture coaching metrics - talk ratio, question rate, topic coverage. Expect $100-150/user/month.
Data quality and enrichment is the layer most teams skip, and it determines whether every other tool's output is trustworthy. If your CRM is full of stale contacts and invalid emails, your activity metrics, conversion rates, and pipeline numbers are all built on sand. Prospeo verifies emails at 98% accuracy with a 7-day refresh cycle, and the free tier gives you 75 verified emails per month to test the difference clean data makes.
Pipeline velocity depends on four variables - and data quality silently wrecks all of them. Stale contacts inflate cycle length, bad emails kill conversion rates, and wrong-number dials waste the 30% of time reps actually spend selling. Prospeo refreshes every record on a 7-day cycle, not the 6-week industry average, so your pipeline metrics reflect reality.
Refresh your data weekly. Measure what's actually happening.
FAQ
What's the difference between sales metrics and KPIs?
KPIs are the 5-8 metrics tied directly to goals and comp plans - quota attainment, win rate, pipeline coverage. Everything else is a diagnostic metric you check when a KPI goes off track. If you're tracking 25 "KPIs," you don't have KPIs. You have a spreadsheet nobody reads.
How many metrics should a rep track?
Five to eight per role. More creates noise and gaming; fewer leaves blind spots. Start with quota attainment, win rate, pipeline coverage, sales cycle length, and one activity-to-quality conversion metric. Add role-specific measures from there.
What's a good win rate in B2B?
The average is 20-21%. By deal size: roughly 30% under $25k, about 20% for $25k-$100k, and under 15% for deals over $100k. Enterprise teams should benchmark against their segment, not the blended average.
How do you prevent reps from gaming activity metrics?
Pair every volume metric with a quality counterweight - calls made alongside meeting conversion rate, pipeline created alongside pipeline-to-close ratio. Enforce consistently across all reps. When top performers get a pass on gaming but struggling reps get coached on call volume, you've destroyed trust in the entire system.
How does data quality affect sales metrics?
Bad contact data inflates activity counts - reps email invalid addresses that register as "outreach" with zero chance of response - and deflates every conversion metric downstream. Teams running outbound with bounce rates above 5% are essentially flying blind: their dashboards show effort, but the numbers underneath are meaningless. Fixing the data source is the first step to trusting any metric on this page.