How to Build a Sales Scorecard That Actually Drives Revenue
It's Monday morning. You're prepping for 1:1s, staring at a Salesforce dashboard with 47 widgets, and you still can't answer the simplest question: is this rep on track or not?
That wall of numbers isn't giving you clarity - it's giving you noise. A sales scorecard fixes this. It compresses the chaos into a single composite score per rep, so coaching conversations actually go somewhere. We've watched teams go from "gut feel" 1:1s to data-driven coaching sessions in a single quarter, and the reps who resisted the hardest ended up loving it most.
What You Need (Quick Version)
A scorecard tracks 5-8 weighted KPIs per role, combining leading activities and lagging results into a single composite score. Start by working backward from your revenue target. Weight each metric by its correlation to closed revenue. Use red/yellow/green bucketing so coaching conversations write themselves. And before you trust any activity metric, verify the contact data feeding it - garbage in, garbage out.
Scorecard vs. Dashboard
A sales scorecard is a structured tool to evaluate individual rep performance against goals, peers, and their own past results. It's not a dashboard. That distinction matters more than most people realize.
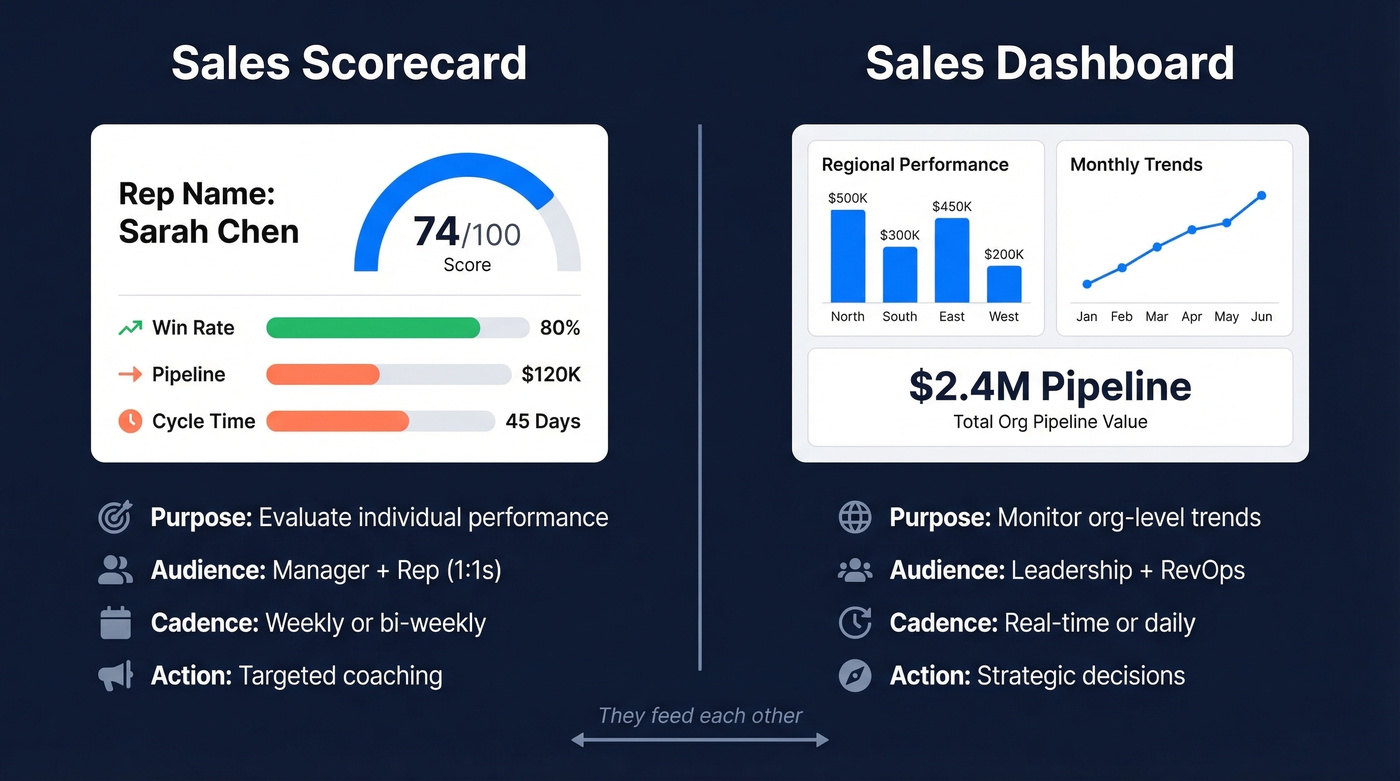
Dashboards give you a graphical overview of what's happening across the org right now. Scorecards tell you whether a specific person is winning, losing, or drifting - and why. They're rep-centric, contextual, and designed for coaching.
| Scorecard | Dashboard | |
|---|---|---|
| Purpose | Evaluate individual performance | Monitor org-level trends |
| Audience | Manager + rep (1:1) | Leadership + RevOps |
| Cadence | Weekly or bi-weekly | Real-time / daily |
| Example | Rep composite score: 74/100 | Total pipeline: $2.4M |
You need both, and they should feed each other. The dashboard tells you where to look; the scorecard tells you what to do about it.
Why Scorecards Drive Revenue
Only 27% of reps hit quota. That number hasn't meaningfully improved in years, despite billions spent on sales tech. The problem isn't tools - it's that managers don't have a structured way to coach.
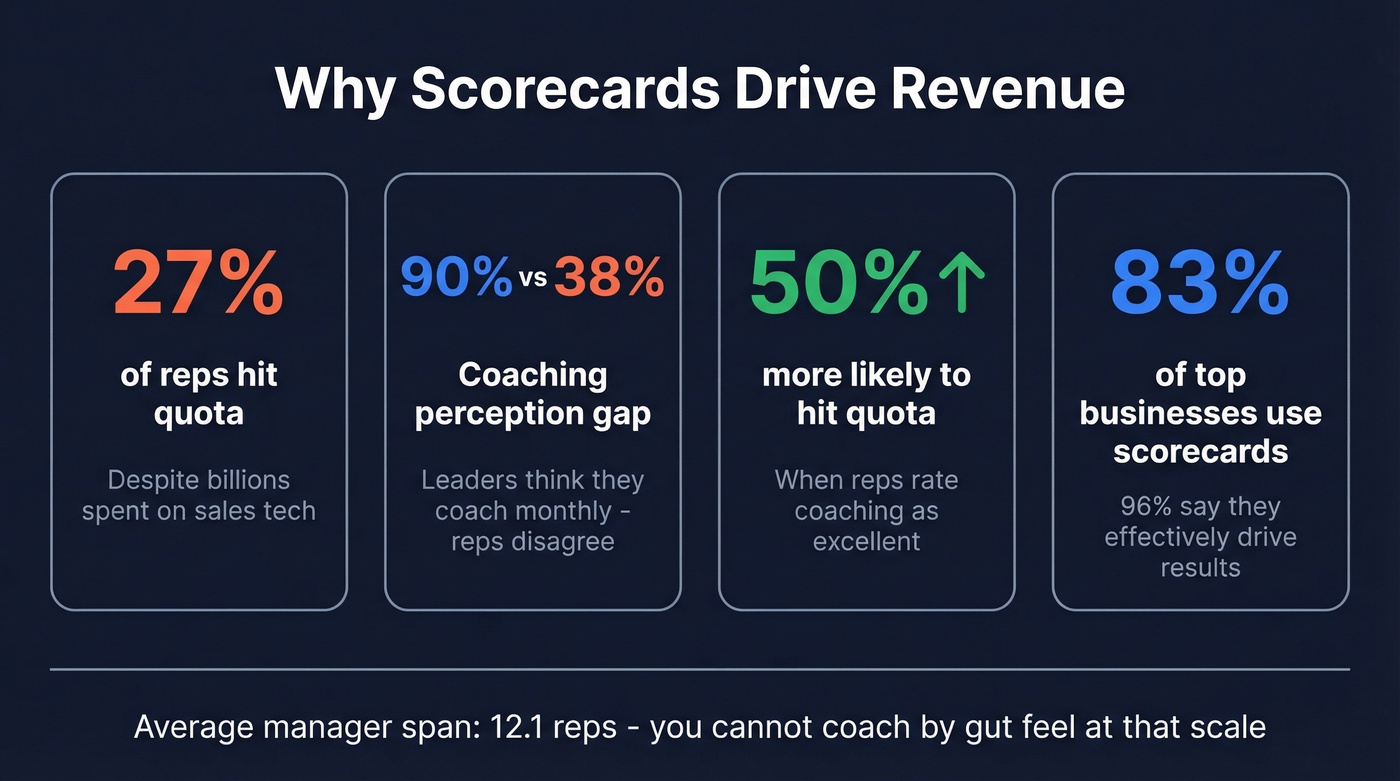
Here's the coaching perception gap: 90% of sales leaders believe they coach their reps monthly, but only 38% of reps agree. A full 14% say they receive no coaching at all.
Reps who rate their coaching as excellent are 50% more likely to hit or exceed targets. And the data backs the mechanism: 83% of high-performing businesses already use scorecards, and 96% of those say they're effective at driving results. Structured coaching drives quota attainment, and a well-built scorecard is the mechanism that makes coaching structured.
Manager span is climbing too. The average frontline sales manager now oversees 12.1 reps, up from 10.9 in 2024. You can't run effective 1:1s across a dozen reps by eyeballing dashboards. You need a system that surfaces who needs help and where.
The "scorecards feel like micromanagement" objection comes up constantly. It's valid - if you build the scorecard wrong. A well-designed one is a development tool, not a surveillance tool. When reps can see their own composite score and understand which levers move it, they self-correct before you even schedule the conversation. That's the whole point.
KPIs by Role
Not every rep should be measured on the same metrics. An SDR logging 80 calls a day and an AE managing a $500K pipeline are playing different games. Here's how to split it.
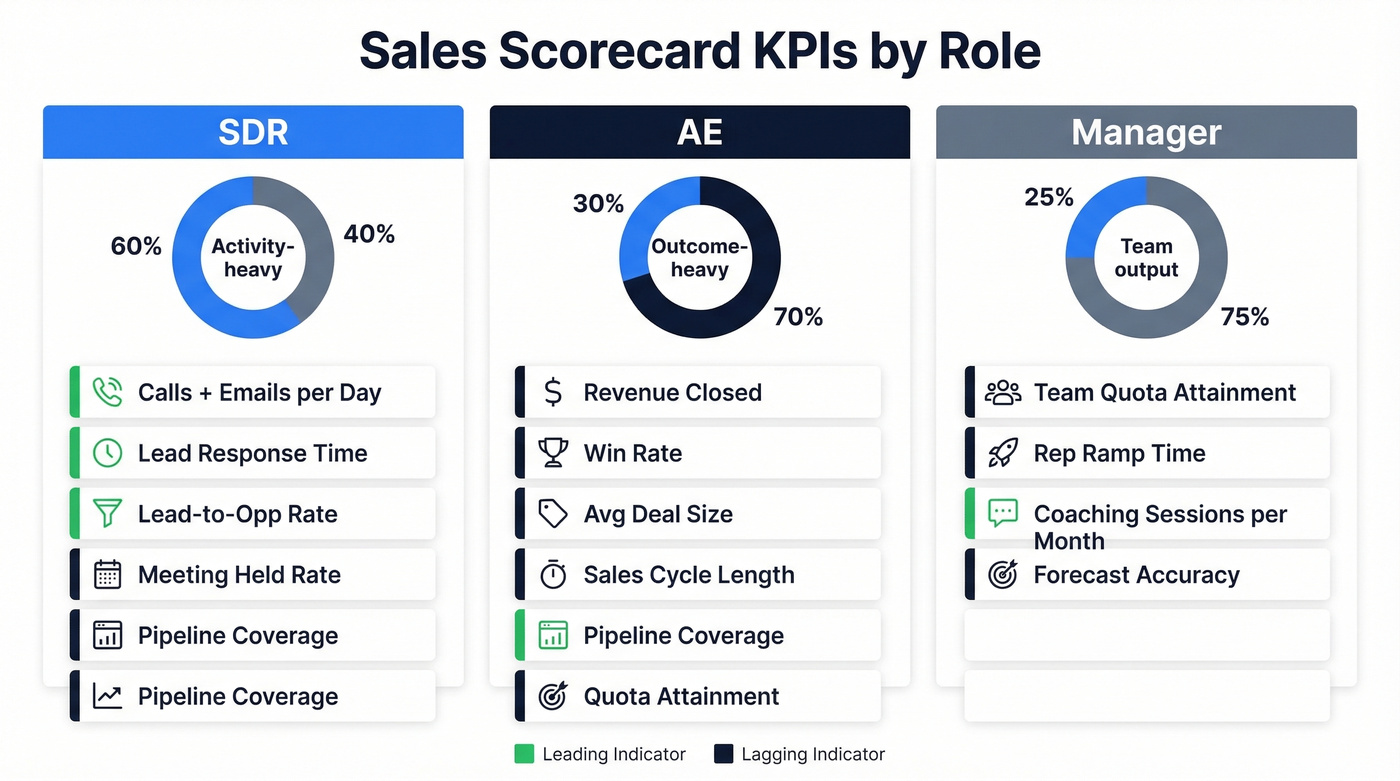
SDR KPIs
SDRs are activity machines, so their scorecard should lean toward leading indicators - activity and speed - while still keeping a few lagging indicators for conversion and pipeline. A daily scorecard for SDRs should surface these numbers every morning so reps can self-correct in real time.
| KPI | Formula | Benchmark | Type |
|---|---|---|---|
| Calls + emails/day | Raw count | Varies by team/segment | Leading |
| Lead-to-opp rate | (SQOs / Leads) x 100 | ~5% | Lagging |
| Meeting held rate | Held / Booked x 100 | Aim for ~80%+ | Lagging |
| Lead response time | First contact - lead created | Minutes, not hours | Leading |
| Pipeline coverage | Pipeline value / quota | 3-5x | Leading |
The meeting held rate is the one most teams miss. An SDR booking 20 meetings a week sounds great until you realize only 12 actually happen. That's a 60% held rate - well below an 80%+ target - and it means the pipeline number is inflated.
AE KPIs
AEs should be measured more heavily on outcomes like win rate, revenue, and cycle time, with a smaller set of leading indicators to diagnose why results are trending up or down.
| KPI | Formula | Benchmark | Type |
|---|---|---|---|
| Win rate | Won / Total opps x 100 | Varies by segment | Lagging |
| Avg deal size | Revenue / deals closed | Varies by segment | Lagging |
| Sales cycle length | Close date - opp created | Varies; track trend | Lagging |
| Quota attainment | Revenue / quota x 100 | 100% target | Lagging |
| Pipeline coverage | Pipeline / quota | 3-4x | Leading |
| Revenue closed | Sum of closed-won | Quota-dependent | Lagging |
A common question is how to weight different product lines within a single rep scorecard. Treat each product line as a separate KPI with its own weight, rather than lumping everything into a single revenue number. This gives you visibility into whether a rep is leaning on one easy-to-sell product while ignoring higher-margin offerings.
Manager KPIs
Managers get measured on team output and coaching behavior. This is where most orgs drop the ball - they track team revenue but not the activities that produce it.
| KPI | Formula | Benchmark | Type |
|---|---|---|---|
| Team quota attainment | Team revenue / team quota | 100% target | Lagging |
| Rep ramp time | Days to first quota month | Varies by segment/complexity | Lagging |
| Coaching sessions/month | Count of documented 1:1s | At least 2 per rep | Leading |
| Forecast accuracy | Forecast / actual x 100 | Aim for tight variance (~10-15%) | Lagging |
How to Build One Step by Step
Start With the Revenue Target
Work backward. If your team needs to close $2M this quarter and your average deal is $40K, you need 50 closed deals. If your win rate is 20%, you need 250 qualified opportunities. If your meeting-to-opp rate is 30%, you need roughly 833 meetings. Now you have activity targets grounded in math, not vibes. This reverse-engineering approach is the foundation of every good scorecard.
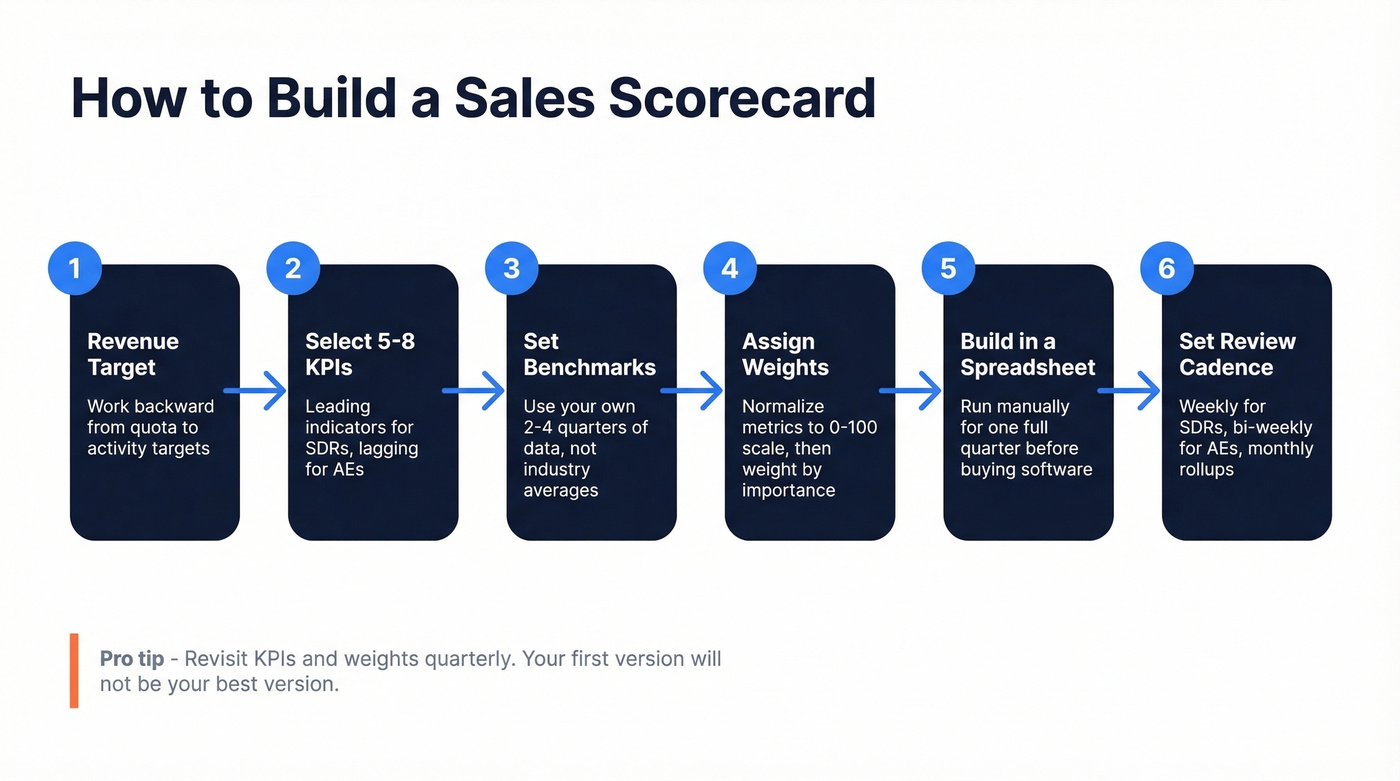
Select 5-8 KPIs Per Role
More than eight and nobody pays attention. Fewer than five and you miss blind spots. SDR scorecards should lean toward leading indicators, AE scorecards toward lagging results. Every KPI should earn its spot by demonstrating a clear correlation to revenue.
Set Benchmarks From History
Pull the last 2-4 quarters of performance data. Don't use industry averages as your primary benchmark - they're too generic. Your team's own historical performance is the baseline. Industry numbers like the ones in the tables above are useful as sanity checks, not targets.
Assign Weights
This is where most guides get vague. Let's get specific.
First, normalize each metric so they're comparable on the same scale:
Performance % = ((Value - Min) / (Max - Min)) x 100
For "lower is better" metrics like sales cycle length, flip it:
Performance % = ((Max - Value) / (Max - Min)) x 100
Worked example: an AE closed $530K this quarter. Your scale runs $0-$600K. Their normalized score is ((530 - 0) / (600 - 0)) x 100 = 88%. Now assign weights to each KPI based on its importance. Revenue closed gets 30% weight, win rate 20%, pipeline coverage 15%, and so on. Multiply each normalized score by its weight, sum them up, and you've got a composite score.
For qualitative metrics like deal qualification quality, map to a numeric scale: bad = 0, average = 3, good = 6, excellent = 10. Then normalize the same way.
Build in a Spreadsheet First
Start in Google Sheets. Seriously. Don't buy software until you've run the scorecard manually for one full quarter. You'll change the KPIs, adjust the weights, and discover that two of your metrics are redundant. A spreadsheet lets you iterate without fighting a tool's constraints.
Set a Review Cadence
Weekly for SDRs - their activity cycles are short enough that weekly feedback changes behavior. Bi-weekly for AEs, since deal cycles are longer and weekly reviews create noise. Monthly for team-level rollups that feed into leadership reporting. Revisit the KPIs and weights themselves quarterly.
A scorecard built on bad contact data is just a fancy way to measure failure. Prospeo's 98% email accuracy and 7-day data refresh mean every activity metric on your scorecard - calls made, emails sent, meetings booked - reflects real engagement with verified contacts, not bounces to dead inboxes.
Stop scoring reps on garbage data. Start with contacts that connect.
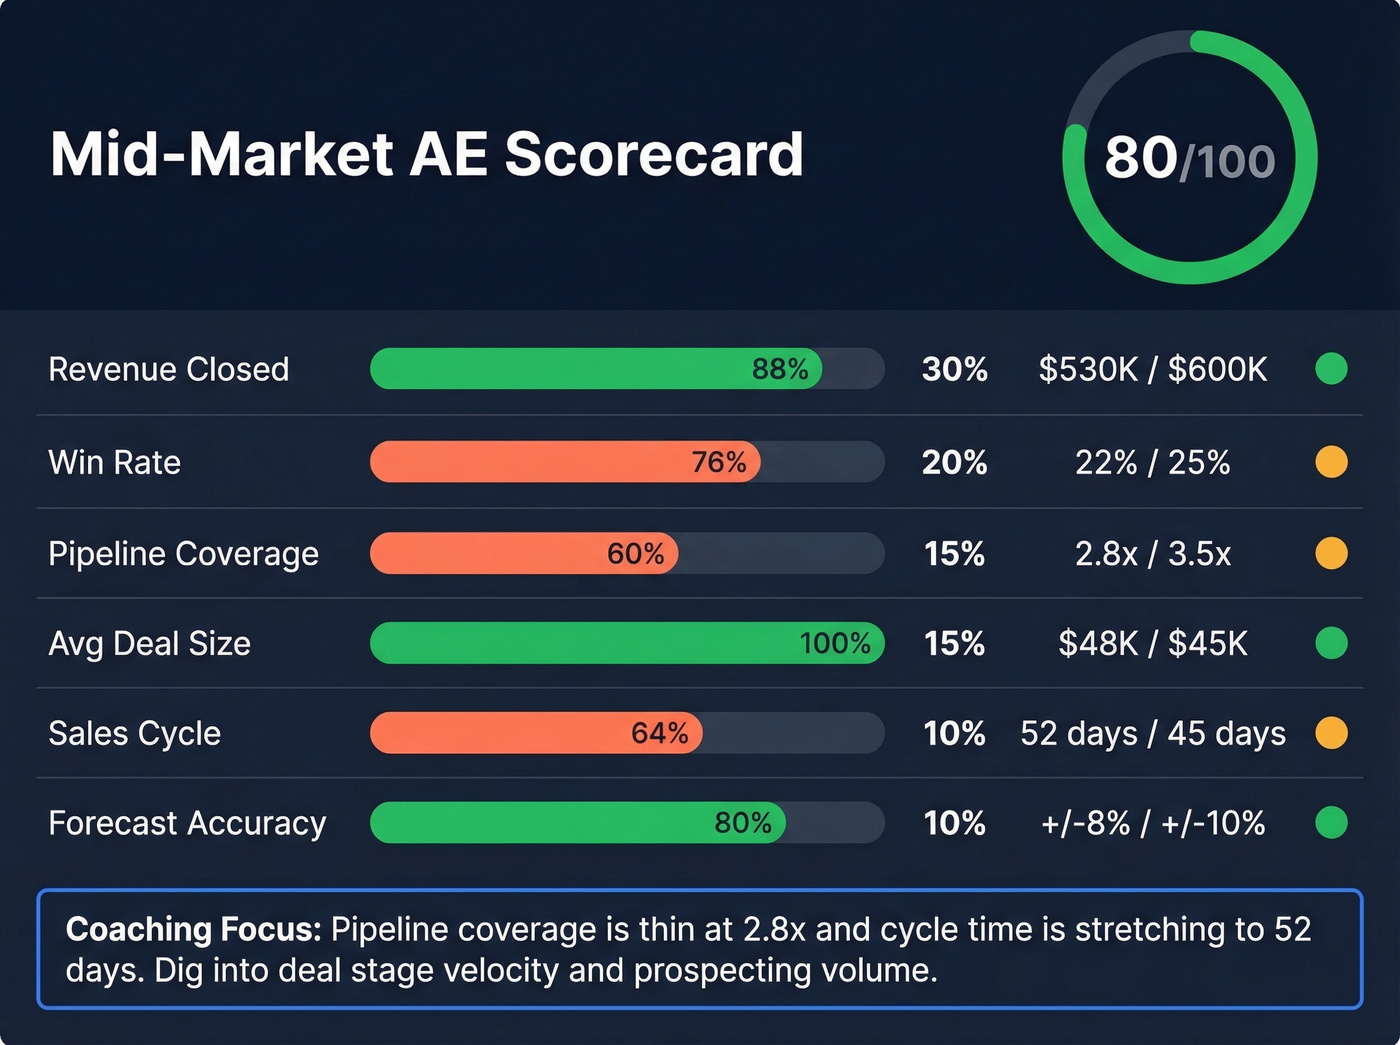
A Filled-Out Example
Most scorecard guides give you a list of 20 KPIs and zero guidance on how to weight them. Here's what a real one looks like for a mid-market AE. We've run this exact format with mid-market AE teams and the composite score consistently surfaces coaching gaps that dashboards miss.
| KPI | Weight | Target | Actual | Norm. Score | Weighted | Status |
|---|---|---|---|---|---|---|
| Revenue closed | 30% | $600K | $530K | 88% | 26.4 | Green |
| Win rate | 20% | 25% | 22% | 76% | 15.2 | Yellow |
| Pipeline coverage | 15% | 3.5x | 2.8x | 60% | 9.0 | Yellow |
| Avg deal size | 15% | $45K | $48K | 100% | 15.0 | Green |
| Sales cycle (days) | 10% | 45 | 52 | 64% | 6.4 | Yellow |
| Forecast accuracy | 10% | +/-10% | +/-8% | 80% | 8.0 | Green |
| Composite | 100% | 80.0 | Green |
This rep is green overall at 80/100, but the yellow flags on pipeline coverage and sales cycle length tell you exactly where to focus the next coaching conversation. That's the power of a composite score - it doesn't just say "good" or "bad," it says "good, but watch these two things."
The normalized score column is what makes KPIs comparable. Without it, you're comparing $530K to 22% to 2.8x - apples to spacecraft. Normalization puts everything on a 0-100 scale so the weights actually work.
The Data Quality Problem
Look, none of this matters if your CRM data is garbage. Poor data quality costs organizations $12.9M annually. Bad data can wipe out up to 30% of revenue potential in missed pipeline opportunities. And reps spend 27% of their time on non-selling activities - much of it cleaning up data that should've been right from the start.
Think about what this means for your scorecard. If a meaningful chunk of emails in your CRM are invalid and a meaningful chunk of phone numbers are disconnected, your SDR's "calls/day" metric gets inflated. You're coaching off fiction. The rep who looks like a top performer on activity volume might actually be dialing dead numbers all day while the rep with fewer logged calls is reaching real humans.
We've seen this play out firsthand. One team we worked with had an SDR who consistently scored green on activity metrics but red on pipeline generated. Turned out 40% of the contacts in his territory had stale data - wrong emails, disconnected numbers. Once they cleaned the list with Prospeo's verification, his connect rate tripled and his scorecard started reflecting reality instead of busywork.
Meeting held rate below 80%? Bounce rates killing your SDRs' scorecard numbers? Teams using Prospeo cut bounce rates from 35%+ to under 4% and tripled connect rates. When your reps dial 125M+ verified mobiles with a 30% pickup rate, every leading indicator on the scorecard improves.
Give your reps data that actually picks up the phone.
Common Pitfalls
Scorecards fail in predictable ways. Here are the five we see most often.
1. Gaming metrics. Every metric that can be gamed will be gamed. The fix is the pair pattern: pair every performance indicator with a quality indicator. Track accounts created alongside average account profit. Track calls made alongside connect rate and pipeline generated per call. Wells Fargo's sham-accounts scandal is the extreme version of what happens when you incentivize a single metric without a counterweight.
2. Confusing activity with performance. A rep logging 100 activities a day with zero pipeline movement isn't a top performer - they're a red flag. High activity with no conversion usually means bad targeting, bad messaging, or bad data. Don't let a green activity score mask a red outcome.
3. Too many KPIs. We've seen teams build scorecards with 15+ metrics. Nobody reads them. Nobody coaches off them. Cap it at 5-8 per role. If a KPI doesn't correlate to revenue, cut it.
4. Set-and-forget syndrome. Building the scorecard is 20% of the work. The other 80% is the review cadence - no regular reviews means no coaching conversations, which means no behavior change. The scorecard becomes a reporting artifact instead of a management tool.
5. Rep distrust. If reps feel surveilled rather than supported, the whole thing backfires. The fix: involve reps in KPI selection. When a rep understands why pipeline coverage is weighted at 15% and agrees it matters, they'll actually try to improve it. Transparency turns a surveillance tool into a development tool.
Most Teams Don't Need Software
If your average deal size is under $25K and your team is under 20 reps, skip the dedicated scorecard platform. A well-built Google Sheet updated weekly will outperform a $50/user/month tool that nobody logs into.
The bottleneck is never the software - it's the discipline to review the numbers and have the coaching conversation. Buy software when the spreadsheet breaks, not before.
Tools Worth Considering
Google Sheets / Excel - Free, flexible, manual. The best starting point for any team building their first scorecard. You'll outgrow it eventually, but start here.
Salesforce - CRM-native dashboards plus Agentforce Sales Coach for AI-powered coaching. Pricing varies by edition and add-ons. If you're already on Salesforce, building scorecards inside it avoids the data-sync headache entirely.
HubSpot - CRM with a free tier and paid Sales Hub plans; Breeze AI Agents add coaching capabilities. Strong for SMBs who want scorecard functionality without enterprise complexity.
Mindtickle - Enablement platform with built-in scorecard and readiness indexes. Typically ~$20-60/user/month depending on package. Strong for teams that want to tie coaching content directly to scorecard gaps.
Highspot - Enterprise enablement with scorecard analytics. Typically ~$30-100/user/month. Better suited for orgs with 50+ reps and dedicated enablement teams.
Revenue.io - AI-powered generative scorecards plus conversation intelligence. Typically ~$60-150/user/month. The most automated option, but the price reflects it.
A note on balanced scorecards: Smartsheet offers balanced scorecard templates that are popular in strategy circles, but these are org-level strategy tools - not the rep-level performance scorecards this guide covers. Don't confuse the two.
FAQ
How often should you update a sales scorecard?
Review weekly for SDRs, bi-weekly for AEs, and monthly at the team level. Revisit the KPIs and weights themselves quarterly - what matters in Q1 will shift by Q3 as your product, market, or team composition changes.
How many KPIs belong on a scorecard?
Five to eight per role. Fewer than five creates blind spots; more than eight causes both reps and managers to tune out. Every KPI should earn its place by demonstrating a clear correlation to closed revenue.
What SaaS-specific metrics should you track?
Prioritize net revenue retention, expansion revenue per rep, and trial-to-paid conversion rate alongside standard KPIs like win rate and pipeline coverage. These metrics capture recurring-revenue dynamics that make SaaS selling fundamentally different from one-time deal closes.
How do you prevent reps from gaming metrics?
Pair every performance indicator with a quality counterweight - track calls made alongside connect rate and pipeline generated per call. Clean contact data also helps here, since reps can't inflate dial counts when every number is validated against a live database.