Serviceable Obtainable Market: The Calculation Method Every Guide Skips
42% of startups fail because there's no market need. But here's the quieter problem: plenty of startups build something people want and still blow their go-to-market because they confused "total market opportunity" with "what we can actually sell next year." That confusion lives in the gap between SAM and your serviceable obtainable market - and most guides gloss right over it.
The consensus on Reddit's r/startups and r/venturecapital is blunt: definitions are everywhere, but realistic assumptions for calculating SOM are nonexistent. Founders keep asking what percentage of SAM is reasonable, over what timeframe, and they get the same vague non-answers.
Here's the quick version. SOM is the revenue you can realistically capture in 1-3 years. Not a fantasy percentage of SAM. Not a top-down slice of a Gartner number. This article gives you the capacity-based formula to derive your penetration rate from actual funnel math, stage-appropriate benchmarks for what "realistic" looks like, and the investor framing that makes your pitch deck credible. Pre-revenue? Skip to the capacity-based method. Pitching next week? Jump to the investor section.
What Is Serviceable Obtainable Market?
Serviceable obtainable market is the portion of your serviceable addressable market (SAM) that you can realistically win given your current resources, competitive position, and go-to-market capabilities - typically within a 1-3 year timeframe. Some frameworks stretch to 3-5 years, but shorter windows force better assumptions.
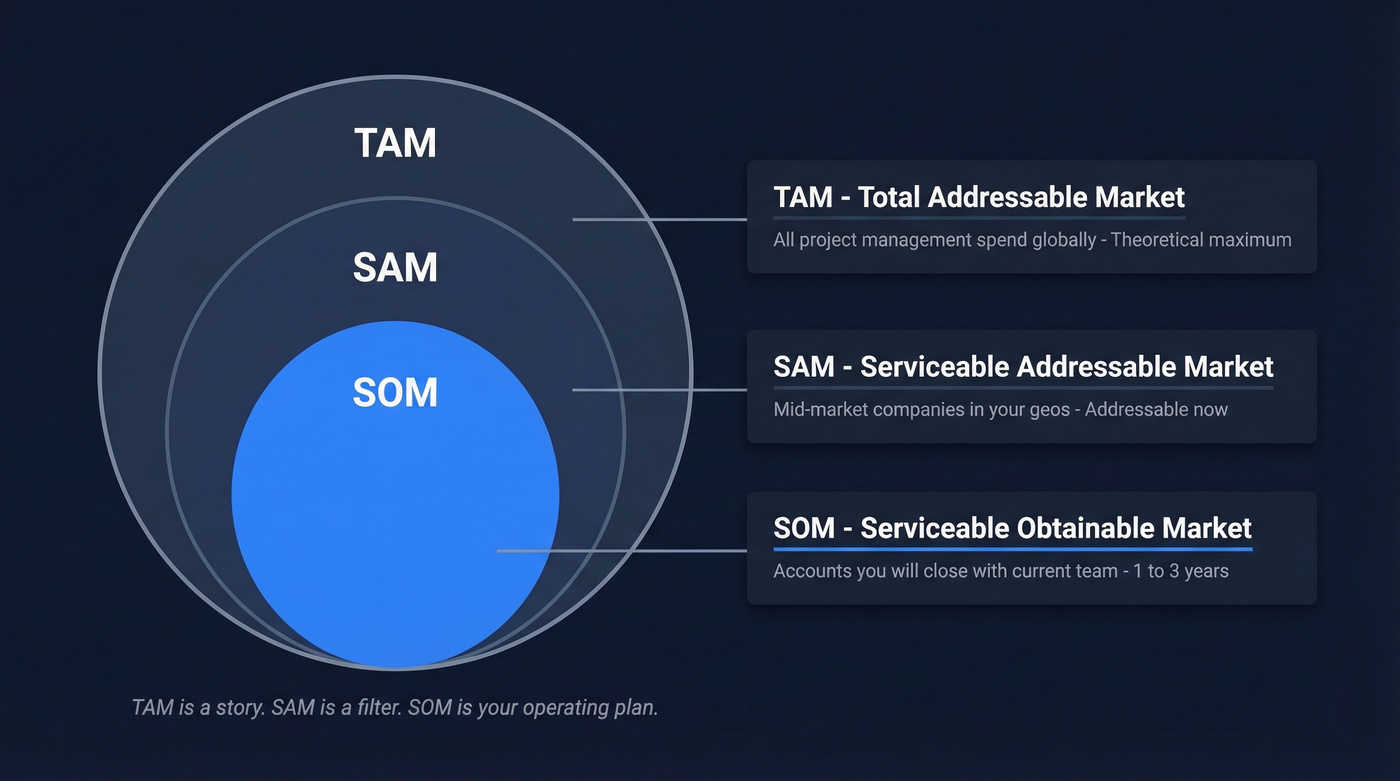
Think of it like a restaurant's capacity: your TAM is everyone in the city who eats out, your SAM is everyone who likes your cuisine and lives nearby, and your SOM is how many covers you can actually serve with your kitchen and staff tonight.
SOM should drive your hiring plan, your quota model, and your burn rate. It's the metric that translates strategy into an operating plan.
TAM, SAM, and SOM at a Glance
| Metric | Definition | Example | Timeframe |
|---|---|---|---|
| TAM | Total demand for your category | All project management spend globally | Theoretical max |
| SAM | Portion you could serve | Mid-market companies in your geos | Addressable now |
| SOM | Portion you'll realistically win | Accounts you'll close with current team | 1-3 years |
SAM vs. SOM: The Practical Test
Scalepath offers a useful framework here. For SAM, the test is: "If this customer came to us organically, could we actually sell to them today?" If yes, they're in your SAM. If not - wrong geography, missing feature, compliance gap - they belong in TAM.
For SOM, the test gets sharper: "Is this customer in our core target market, and do we have referenceable customers like them already?" That second condition is what separates obtainable from addressable. You're not asking whether you could serve them. You're asking whether your current team, positioning, and proof points give you a credible shot at winning their business.
Why SOM Matters More Than TAM
TAM is a story. SAM is a filter. SOM is your operating plan.
Most market sizing guides spend 60% of their words on TAM - the biggest, most impressive, least actionable number. Investors see through this immediately. The average VC spends only 2 minutes and 42 seconds reviewing a cold pitch deck. If your market size slide shows a $50B TAM with no credible path to your first $5M in revenue, you've wasted it.
Underscore VC calls the market size slide "one of the most commonly wasted slides" in a pitch deck - and the TAM/SAM/SOM framework is the trap that makes it wasteful. SOM is where credibility lives. It proves you understand your constraints, your competitive landscape, and the mechanics of how revenue actually gets built.
Here's the thing: if your average deal size is under $10K, skip the TAM slide entirely and lead with SOM. Show the funnel math. Let investors extrapolate the ceiling themselves. We've reviewed pitch decks where a massive TAM actually hurt credibility because it signaled the founder hadn't done the bottom-up work.
How to Calculate SOM Step by Step
Step 1: Define Your TAM
Start with total market demand. For a bottom-up approach - always more credible than top-down - count total potential customers and multiply by average annual contract value.
Step 2: Narrow to Your SAM
Filter TAM by real constraints: geography, language, product capabilities, integrations, compliance. The Wise blog gives a clean example - selling payroll software in the UK, you'd exclude businesses with zero employees, then narrow to the 10-50 employee segment where your product fits. Your addressable market isn't "everyone who might buy someday." It's everyone you could serve if they showed up tomorrow.
Step 3: Estimate Penetration Rate
This is where most guides fail. They say "apply a realistic market share percentage" without telling you how to derive it. Three methods follow in the next section. This is the hard part.
Step 4: Apply the Formula
The formula is simple. The work is in the inputs. Scalepath offers a free B2B market sizing template that structures this exact TAM-to-SAM-to-SOM flow if you want a spreadsheet to work in.
Worked Example: B2B SaaS
You sell a project management tool for mid-market companies (200-1,000 employees) in North America.
- TAM: 85,000 companies x $18,000 ACV = $1.53B
- SAM: Filter to companies using Jira or Asana, US and Canada, engineering teams of 20+. About 12,000 companies. SAM = $216M.
- Penetration rate: Series A with 8 reps. Capacity-based method yields 3.5%.
- SOM: $216M x 3.5% = $7.56M over 1-3 years.
That's a number you can defend. It ties to headcount, quota capacity, and competitive reality - not a percentage pulled from thin air.
How to Estimate Penetration Rate
Three methods, depending on your stage.
Method 1: Historical Market Share
If you have revenue, divide current annual revenue by SAM. That's your penetration rate. Project forward based on growth trajectory and planned capacity additions. You need enough consistent revenue history for this to be meaningful - a single quarter won't cut it.
Method 2: Capacity-Based Funnel Math
This is the method most guides don't give you, and it's the one pre-revenue founders need most. Instead of guessing a percentage, derive it from sales capacity.
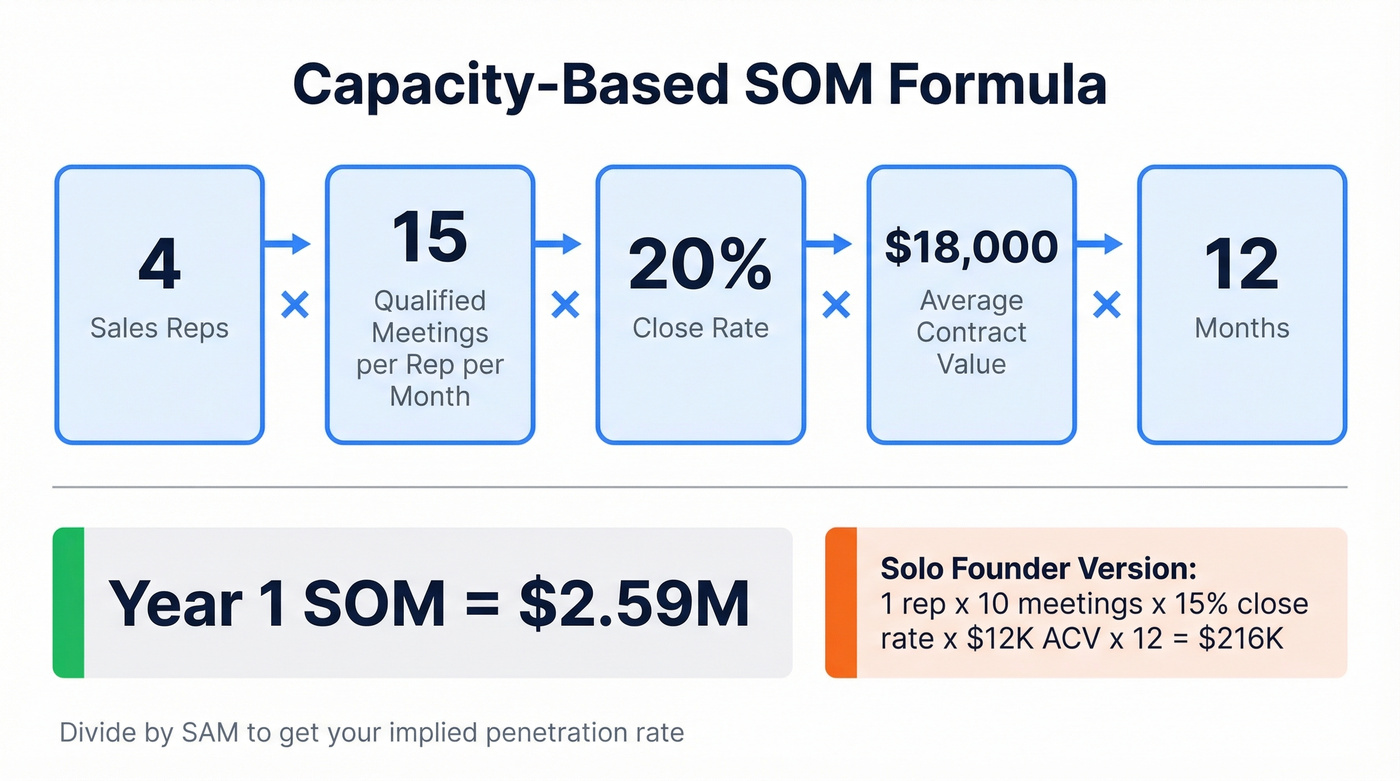
Capacity-Constrained SOM = (# of reps) x (qualified meetings/rep/month) x (close rate) x (ACV) x 12
Example with a small team: 4 reps x 15 qualified meetings/month x 20% close rate x $18,000 ACV x 12 months = $2.59M
Solo founder doing their own sales? 1 rep x 10 meetings/month x 15% close rate x $12,000 ACV x 12 = $216K. That's your honest year-one SOM. It stings, but it's real.
Divide either number by SAM to get your implied penetration rate. For pre-revenue companies, the "Earlyvangelists" concept adds another layer: identify your 50-100 most likely early customers - sharpest pain, shortest sales cycle, highest willingness to buy from an unproven vendor. Your initial obtainable market is the revenue from converting a realistic percentage of that list.
One thing we've learned from working with early-stage sales teams: your bottom-up SOM is only as good as your contact data. If 30% of your prospect emails bounce, your obtainable market just shrank by 30%. Prospeo verifies emails at 98% accuracy with a 7-day refresh cycle, so your model reflects contacts you can actually reach.
Method 3: Comparable Benchmarks
When you lack historical data or enough team to model capacity, use stage-appropriate benchmarks as a sanity check.
| Stage | Rule-of-thumb SOM (% of SAM) | Timeframe |
|---|---|---|
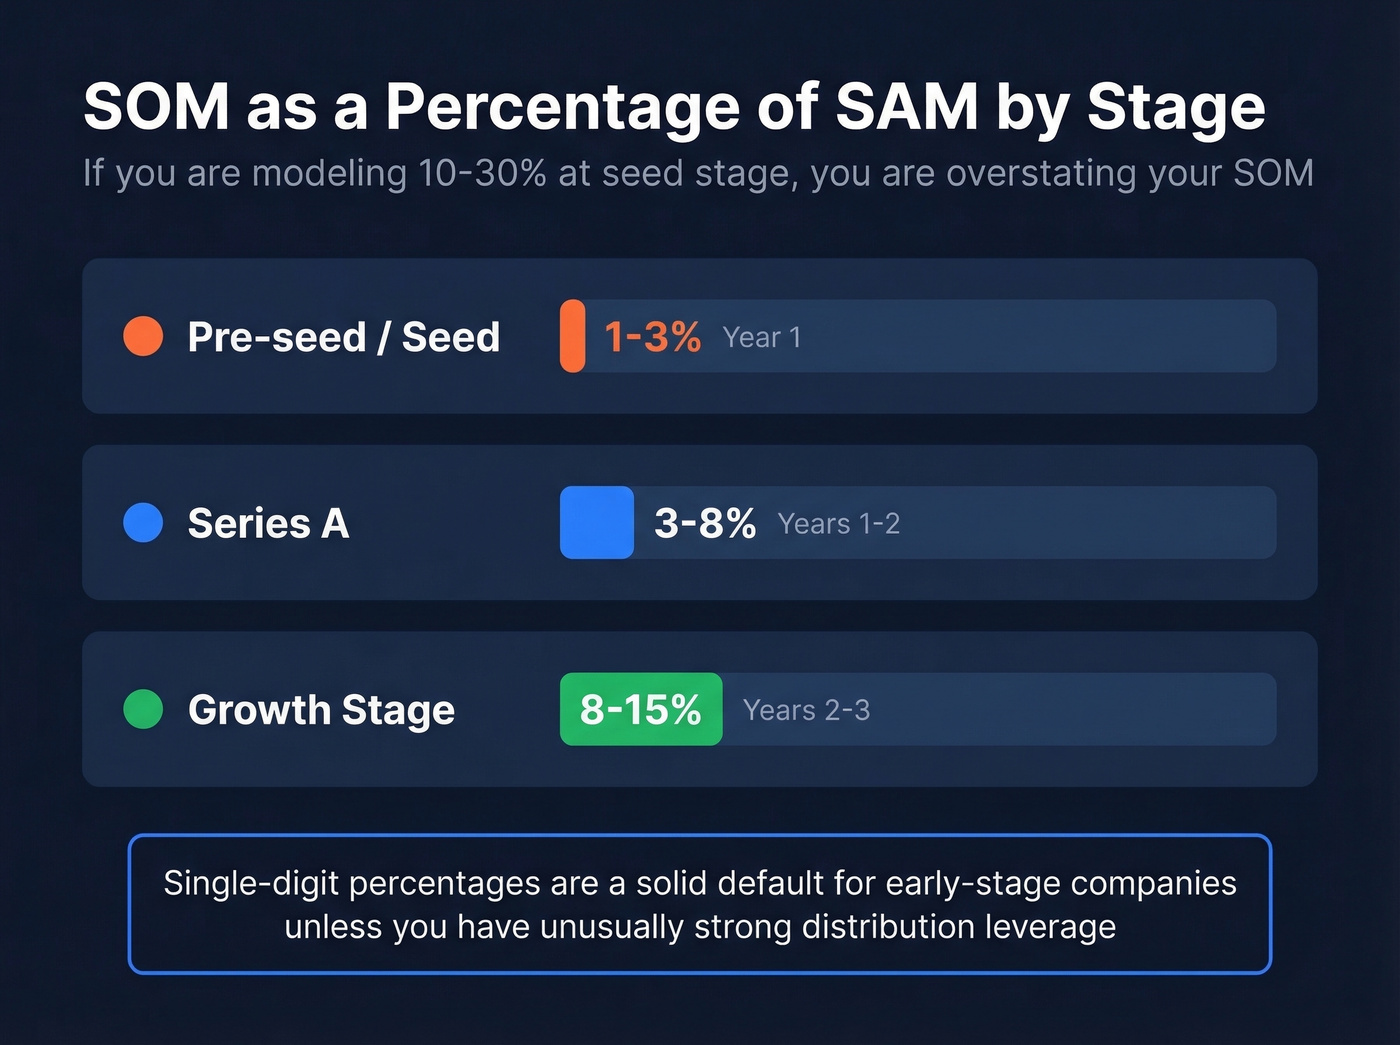
| Pre-seed / Seed | 1-3% | Year 1 |
| Series A | 3-8% | Years 1-2 |
| Growth | 8-15% | Years 2-3 |
Aexus uses a 2.5% penetration rate in their worked examples, landing right in the seed-stage range. If you're modeling 10-30% of SAM at the seed stage - as some founders on Reddit do - you're overstating your SOM. Single-digit percentages are a solid default for early-stage companies unless you have unusually strong distribution leverage.
Your SOM calculation is only as good as your ability to reach the accounts in it. Prospeo gives you 300M+ profiles with 30+ filters - buyer intent, technographics, headcount growth - so you can build the exact SAM segment your funnel math requires, then convert it into pipeline at 98% email accuracy.
Turn your serviceable obtainable market from a spreadsheet into a pipeline.
How Investors Evaluate Your SOM
Investors don't care about your TAM number. They care about whether you understand how you'll get from zero to your first $5M-$10M in revenue.
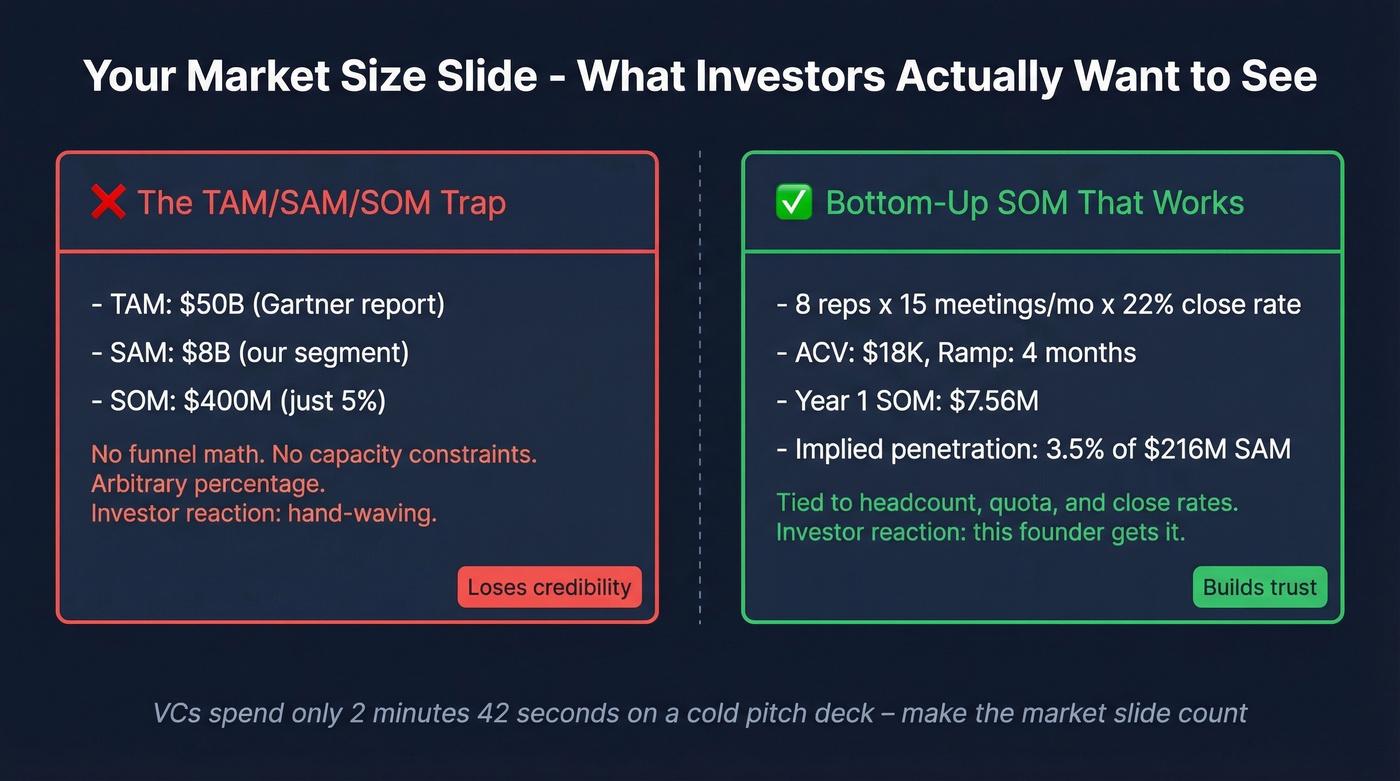
Underscore VC explicitly warns against the "TAM/SAM/SOM Trap" - the pattern where founders show a giant TAM, slice it to a slightly-less-giant SAM, then pick an arbitrary percentage for SOM. What makes investors skeptical: arbitrary percentages with no supporting math, no capacity constraints, and inflated TAMs from analyst reports that define the market more broadly than your product serves. GoingVC's framework is direct - SOM must be grounded in acquisition reality, not wishful percentages.
Lead with your bottom-up SOM on the market size slide. Show the funnel math. Show the rep capacity. Show the close rates and why you're assuming them. In our experience, the founder who shows a $7.5M SOM backed by capacity math is far more credible than the one who shows a $50B TAM and waves their hands about capturing "just 1%."
SOM Across Industries
The constraints that define your obtainable market vary by industry. What's realistic in B2B SaaS looks nothing like healthcare.
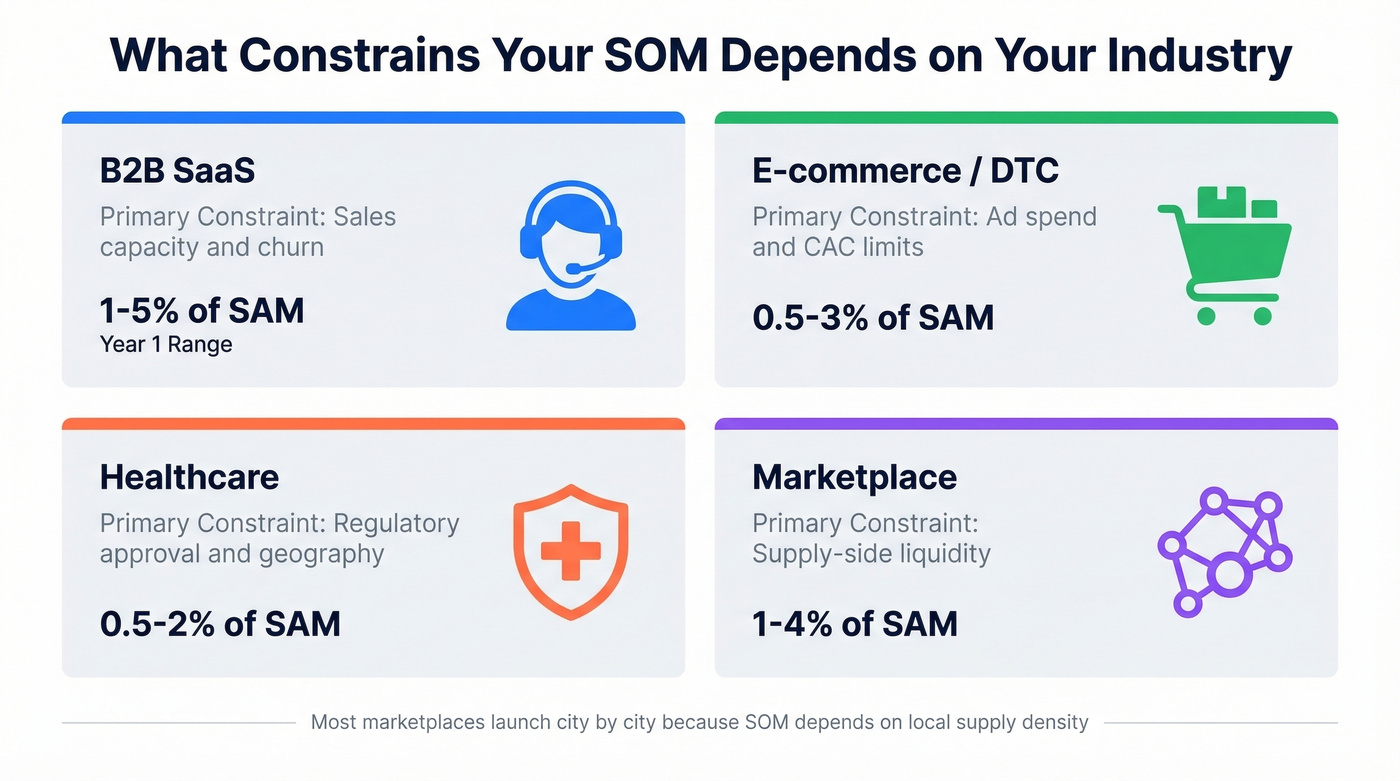
| Industry | Primary Constraint | Rule-of-thumb SOM Range (Yr 1) |
|---|---|---|
| B2B SaaS | Sales capacity, churn | 1-5% of SAM |
| E-commerce / DTC | Ad spend, CAC limits | 0.5-3% of SAM |
| Healthcare | Regulatory approval, geography | 0.5-2% of SAM |
| Marketplace | Supply-side liquidity | 1-4% of SAM |
B2B SaaS SOM is almost always constrained by how many reps you have and how fast they ramp. E-commerce SOM is constrained by acquisition spend before CAC exceeds LTV. Healthcare SOM is constrained by regulatory clearance - you can't sell what isn't approved. Marketplace SOM depends on whether you have enough supply in a given geography to deliver a good buyer experience, which is why most marketplaces launch city by city rather than nationally.
Validate and Expand SOM Over Time
Your SOM isn't a number you calculate once and put on a slide. It should evolve as your team grows and your competitive position shifts.
Validate against CRM pipeline data on a regular cadence - quarterly is a good operating rhythm. If your SOM says $7.5M this year but pipeline coverage is 1.5x on $3M, something's wrong. Either your assumptions are too aggressive or your top-of-funnel is broken.
Quarterly validation checklist:
- Pipeline coverage >= 3x SOM target
- Bounce rate < 5% on target account list
- Close rate assumptions validated against recent quarters
- SAM filters updated for current product capabilities
Let's be honest about something most founders skip: pressure-testing the account list itself. Run your target accounts through an enrichment tool and check how many have valid contact data. If half your "obtainable" accounts have stale emails and no direct dials, your real SOM is half what you modeled.
Strategies to expand SOM over time: add adjacent customer segments, build channel partnerships that extend reach beyond direct sales, expand geographically, and ship features that unlock segments previously outside your SAM. Year 1 SOM might be $5M. Year 3 might be $20M. Each step should be backed by capacity and competitive assumptions that justify the growth.
Capacity-based SOM lives and dies on qualified meetings per rep. Bad contact data kills that number before your reps even pitch. Prospeo delivers verified emails at $0.01 each and 125M+ direct dials with a 30% pickup rate - so every rep hits their meeting targets instead of bouncing off dead inboxes.
Stop losing SOM to bad data. Hit quota with contacts that connect.
10 Common SOM Mistakes
1. Top-down only analysis. Pulling a Gartner number and slicing by percentage isn't market sizing - it's storytelling. Always pair with bottom-up.
2. Ignoring geographic restrictions. Your product might work globally. Your sales team, compliance, and support don't.
3. The "just 1%" fallacy. Even 1% of a massive TAM is a red flag - it signals you haven't thought about competition or go-to-market mechanics.
4. Using outdated data. Old analyst reports don't reflect 2026 competitive dynamics or category consolidation.
5. Confusing TAM, SAM, and SOM. If your SOM exceeds SAM, your definitions are broken. It happens more than you'd think.
6. Over-generalizing your target. "All SMBs" isn't a segment. "SaaS companies, 50-200 employees, using HubSpot, in North America" is.
7. Ignoring product limitations. If your product doesn't cover key use cases for a segment, that segment isn't in your SAM. Full stop.
8. Single price point bias. Modeling TAM with enterprise ACV while selling mid-market skews everything. Use blended pricing.
9. Failing to update. SOM at seed stage is meaningless by Series B. Revisit quarterly for operating plans, annually for investor materials.
10. Inflating for investors. We've seen the pattern: an AI-driven CRM startup inflates its market with top-down math, ignores entrenched competitors, then burns cash on broad targeting. Bottom-up analysis usually reveals a much smaller initial SOM - smaller, but defensible and fundable.
FAQ
What does SOM mean and why does it matter?
SOM - serviceable obtainable market - is the slice of your addressable market you can realistically capture with your current resources and go-to-market motion. It matters because it connects market opportunity to an executable revenue plan. TAM and SAM describe potential; SOM describes what you'll actually achieve in 1-3 years.
What's the difference between SAM and SOM?
SAM is the market you could theoretically serve given your product, geography, and integrations. SOM is the subset you'll realistically win given your sales capacity and competitive position. SAM answers "who could we serve?" - SOM answers "who will we actually close?"
How often should you recalculate SOM?
Quarterly for operating plans, annually for investor decks. Team size, close rates, and competitive dynamics shift constantly - a six-month-old SOM is already stale. Validate against CRM pipeline data each quarter to catch assumption drift early.
What's a realistic SOM for a startup?
Seed-stage B2B SaaS companies typically model 1-5% of SAM in year one. The methodology matters more than the number - a defensible 2% backed by funnel math beats an aspirational 10% with no logic behind it.
Can SOM be larger than SAM?
Never. SOM is always a subset of SAM, which is always a subset of TAM. If your SOM exceeds SAM, your definitions are wrong - revisit your filters and make sure you're not double-counting segments or inflating penetration assumptions.