TAM Expansion: The Strategy Guide Most Market-Sizing Articles Skip
You're sitting in a Series B board meeting. Growth decelerated from 120% to 55% in two quarters, and the lead investor asks the question nobody wants to hear: "Have we tapped the TAM?" The room goes quiet - because the honest answer is that nobody's sure. The TAM number on the original pitch deck was stitched together from a Gartner report, a competitor's S-1, and some generous assumptions about adjacent markets that nobody had validated with a single customer conversation.
The real problem isn't that TAM is made up. It's that most teams treat it as a static number instead of a strategic lever. TAM expansion is how the best companies avoid hitting a ceiling.
The Short Version
Expansion isn't optimization. Upselling your current customers is optimization. Expansion means entering markets with new incumbents and new budget pools. Confusing the two is the most expensive mistake in growth strategy.
The three most underused expansion levers are cost reduction (creating first-time buyers), M&A (buying your way into adjacent markets), and AI-era budget creation - new spend categories that didn't exist two years ago. And here's the thing: your expanded TAM is worthless without verified contacts in the new segment. Strategy decks don't generate pipeline. Accurate data does.
TAM, SAM, and SOM Refresher
TAM, SAM, and SOM (Total Addressable Market) is the total revenue opportunity if you captured 100% of your market. SAM (Serviceable Addressable Market) narrows that to the segment you can realistically serve with your current product and distribution. SOM (Serviceable Obtainable Market) is what you can actually win in a given timeframe.
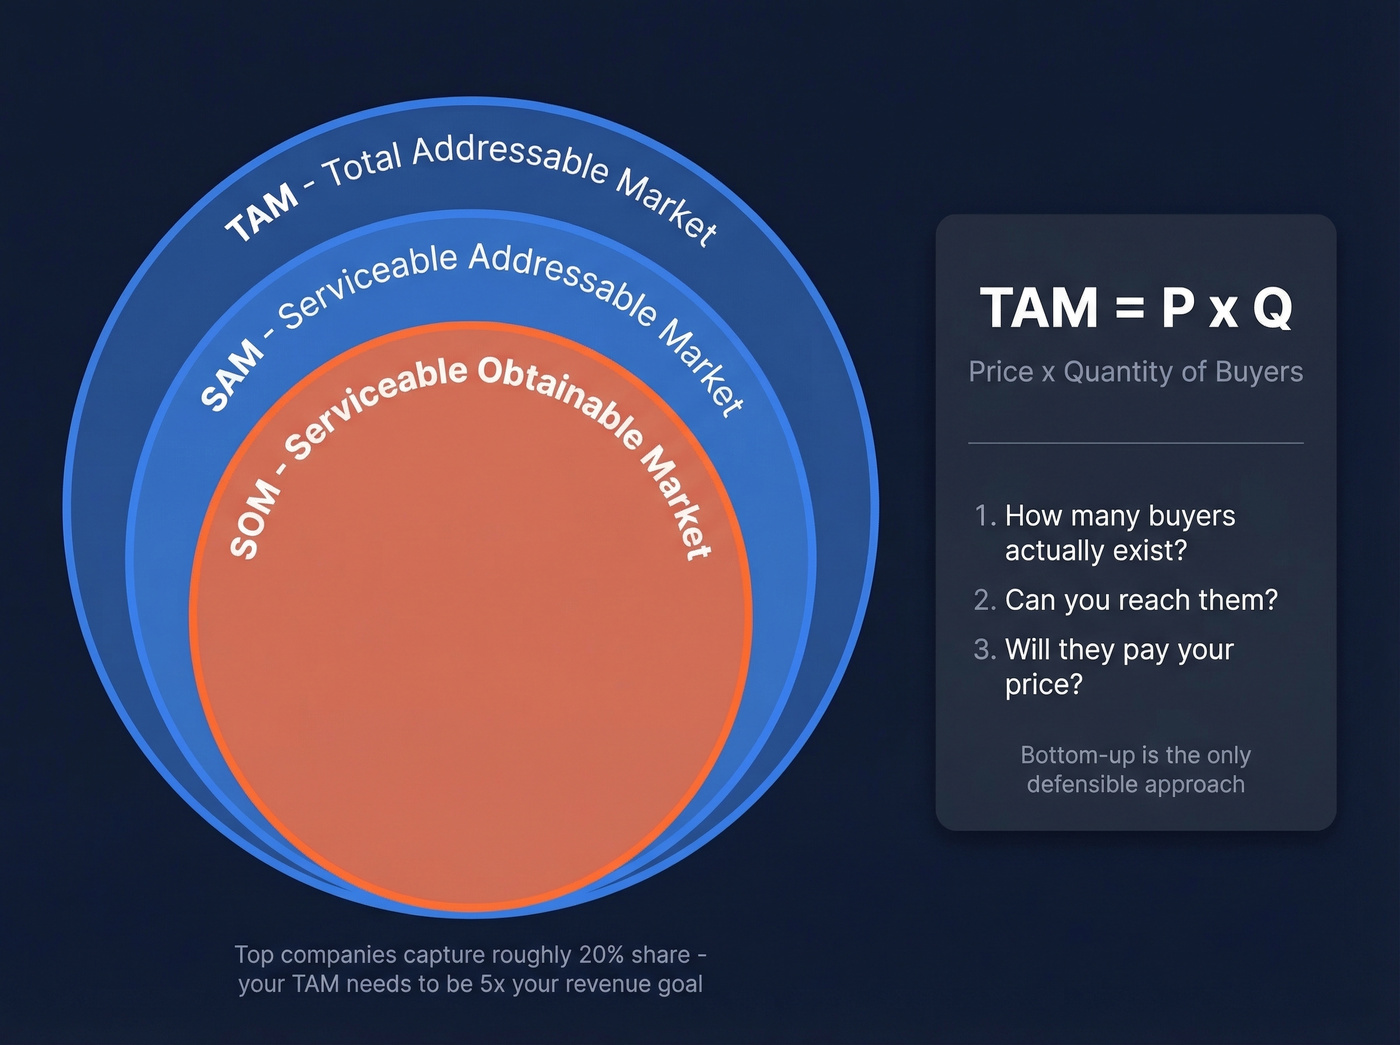
The math is simple: P x Q - price times quantity. The hard part is always Q. How many buyers actually exist, can you reach them, and will they pay? Bottom-up is the only defensible approach. Market-leading horizontal SaaS companies tend to capture around 20% market share over time, per Lightspeed's TAM masterclass - which means your TAM needs to be 5x your revenue ambition.
Optimization vs. Expansion
Here's the distinction that trips up most growth teams: optimization and expansion look similar on a revenue chart but are fundamentally different strategies.
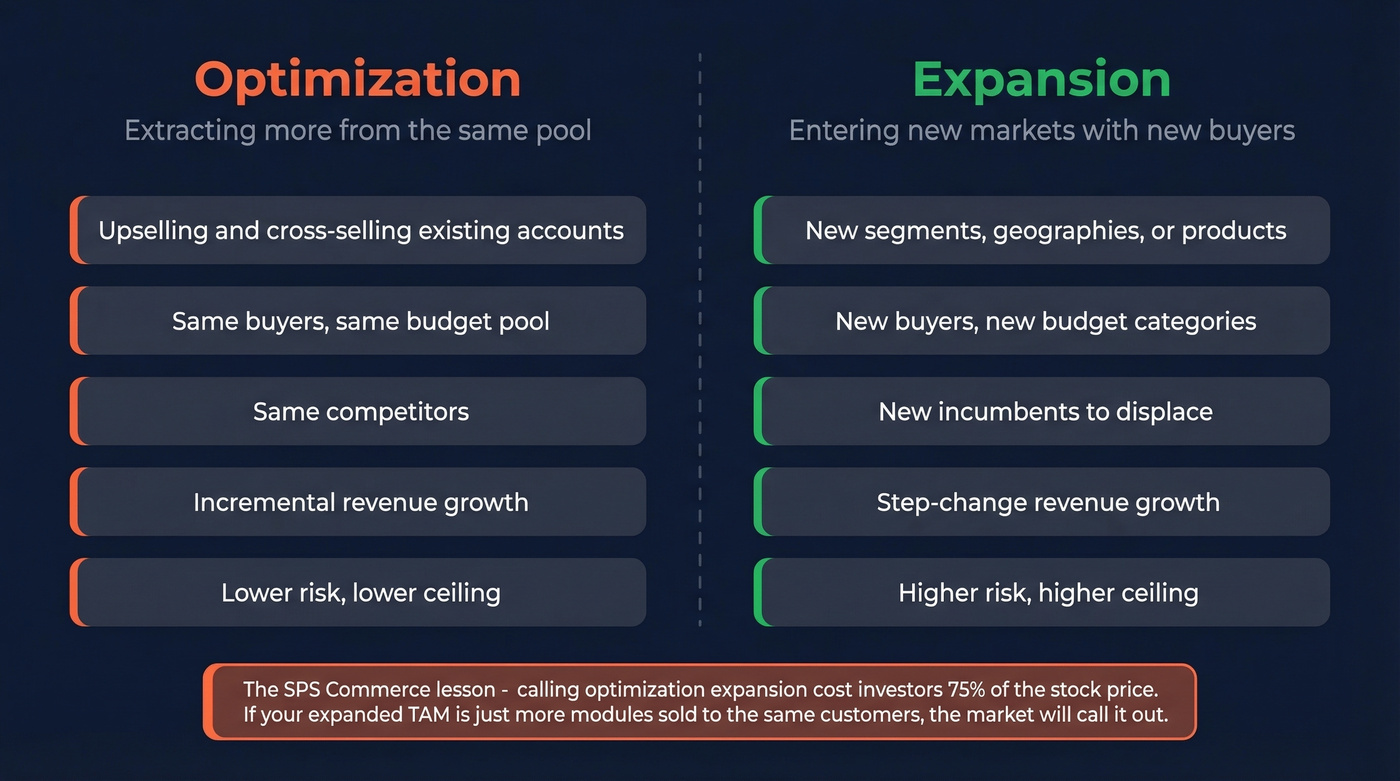
Optimization means upselling, cross-selling, and extending within your existing ecosystem - extracting more value from the same pool of buyers. When you expand your total addressable market, you're entering a market with a new set of incumbents and a new pool of budget. Different competitors, different buying committees, different objections.
The SPS Commerce story is the cautionary tale. SPS has 45,000+ recurring revenue customers, reported $751M in revenue, notched its 100th consecutive quarter of topline growth, and cited an $11B TAM that included compliance management, revenue recovery, and vendor performance analytics. The stock fell roughly 75% between mid-2024 and late February 2026 when investors questioned whether that $11B figure was genuine expansion or just optimization dressed up in a bigger number. The core EDI market is around $4B. Investors noticed the gap.
If your "expanded TAM" is really just more modules sold to the same 45,000 customers, the market will eventually call that out.
When to Expand Your Market
Not every company needs to pursue new market segments. Some need better penetration of the market they already have. We recommend revisiting your TAM quarterly - market conditions, competitive dynamics, and your own capabilities change faster than annual planning cycles assume. Here are the signals that it's time:
- You've captured >20% of your current addressable market. Each incremental point of share gets exponentially harder from here.
- YoY growth has decelerated below 30% - not because execution is slipping, but because the addressable pool is shrinking relative to your size.
- >25% of customer feature requests fall outside your current offering. Your customers are telling you where the adjacent opportunity lives.
- You're approaching the penetration ceiling. Euclid VC's analysis of roughly 100 public software companies found only six had ARR greater than 15% of their stated TAM. Most companies expand their market definition well before penetration becomes the binding constraint.
Your expanded TAM is just a number until you can reach buyers in those new segments. Prospeo gives you 300M+ profiles across every geography and industry, with 30+ filters - including buyer intent, technographics, and headcount growth - so you can validate new markets with real contacts, not Gartner estimates.
Turn your TAM expansion strategy into pipeline for $0.01 per verified email.
Seven TAM Expansion Mechanisms
1. New Geographies
The most obvious lever, and the most operationally complex. Geographic expansion doesn't just mean translating your website - it changes regulatory requirements, payment infrastructure, and GTM motion entirely. A US-first SaaS company entering EMEA needs local compliance (GDPR at minimum), localized pricing, and often a regional sales team. Start with a bottom-up count of target accounts in the region, multiply by a localized price point (purchasing power parity matters), and discount by realistic penetration rates. The math is straightforward; the execution is where teams underestimate the lift by 3-5x.
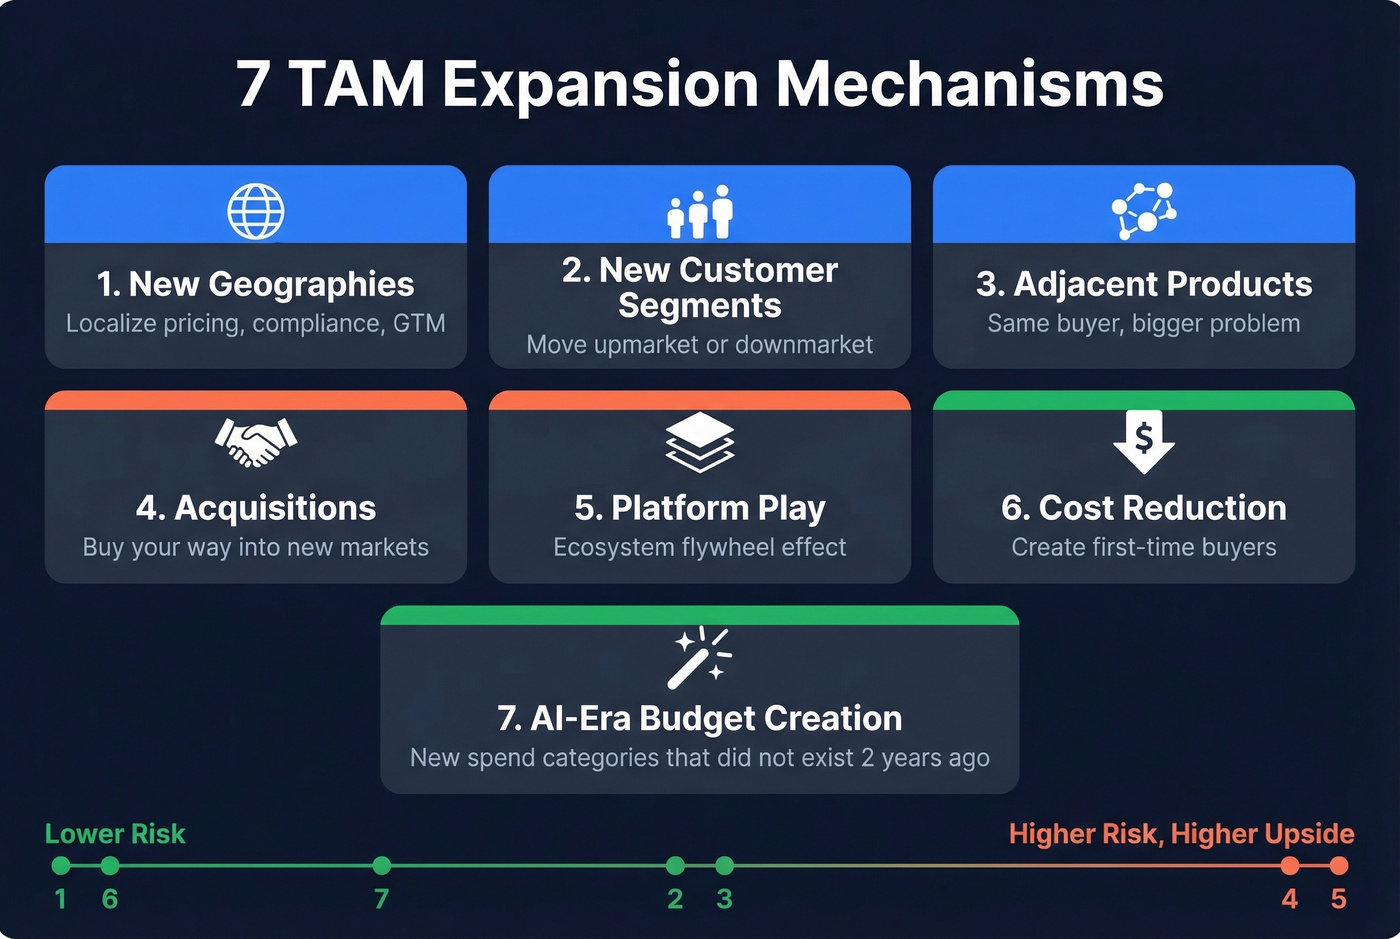
2. New Customer Segments
Moving upmarket or downmarket sounds like a pricing decision. It's a structural GTM change. It affects cost-to-acquire, cost-to-serve, product expectations, onboarding, and customer success.
We've seen teams burn six figures on enterprise outbound campaigns while their SMB base churned because nobody was watching the core motion. Think of it as a beachhead strategy: you need a dedicated land-and-expand motion for each segment, not one motion stretched across both.
3. Adjacent Products & Workflows
The smartest expansion targets share infrastructure with your current product. Pipe17's adjacency framework maps three dimensions: same buyer with a bigger problem, same data with a new workflow, same infrastructure with a different market. Same-buyer expansion is lowest risk because you already have distribution. Same-infrastructure expansion is highest risk but highest TAM upside.
4. Acquisitions
When organic product development is too slow, you buy your way in. Stripe acquired Paystack, TaxJar, Bouncer, Recko, and Lemon Squeezy to expand from payments API into broader financial infrastructure. Canva acquired Affinity and Leonardo.Ai to move from design tool into a full visual communication platform.
Each acquisition redefines the job, not the feature. It changes the narrative about what the company does - and what market it can credibly claim.
5. Platform & Ecosystem Play
The most ambitious mechanism. Shopify has achieved roughly 20x market expansion since 2015 by evolving from e-commerce storefront to full commerce operating system - payments, fulfillment, capital, POS, B2B wholesale. Platform plays compound because each new capability attracts new participants to the ecosystem, which attracts more developers, which creates more capabilities. It's a flywheel, not a roadmap.
6. Cost Reduction Creating New Buyers
This is the most underappreciated mechanism - and the one I'd bet on for the next decade.
When you reduce cost-to-serve, you don't just improve margins - you create first-time buyers who couldn't afford the product before. That's true market expansion, not optimization. Consider: automation can reduce onboarding and support costs from $50k per customer to a level where serving customers paying $5k annually becomes profitable. Suddenly your addressable market is 10x larger.
The Lemonade Foundation story illustrates this perfectly. Their parametric insurance product in Kenya scaled from 7,000 farmers in March 2023 to 260,000 two years later - a 37x increase. Automated underwriting eliminated the overhead that made insuring smallholder farmers uneconomical. The TAM didn't change because of a new product; it changed because the cost structure made a new buyer segment viable for the first time.
7. AI-Era Budget Creation
Most teams are still sizing their market against 2023 budget categories. That's a mistake. AI isn't just automating existing workflows - it's creating entirely new budget categories. AI budgets now average 8-12% of total IT spending in 2026, up from 2-3% in 2023. McKinsey estimates the long-term AI opportunity at $4.4T, much of which represents addressable market that didn't exist five years ago.
Gartner forecasts 35% of point-product SaaS tools will be replaced by AI agents by 2030. For companies positioned correctly, automation reduces cost-to-serve enough to make $50-$500/month SMB price points viable - expanding the addressable opportunity by 50-100x by reaching segments that were previously uneconomical to serve.
Modern Frameworks Beyond Ansoff
The Ansoff Matrix - penetration, market development, product development, diversification - has been the default expansion framework since 1957. These modern alternatives add the quantitative rigor it lacks.
Entry Market + Expansion Mixes
This framework replaces static TAM/SAM/SOM circles with SAM0 (the sales-qualified ICP you can name today), SAM1 (your first expansion unlock), and SAM2+ (subsequent expansions).
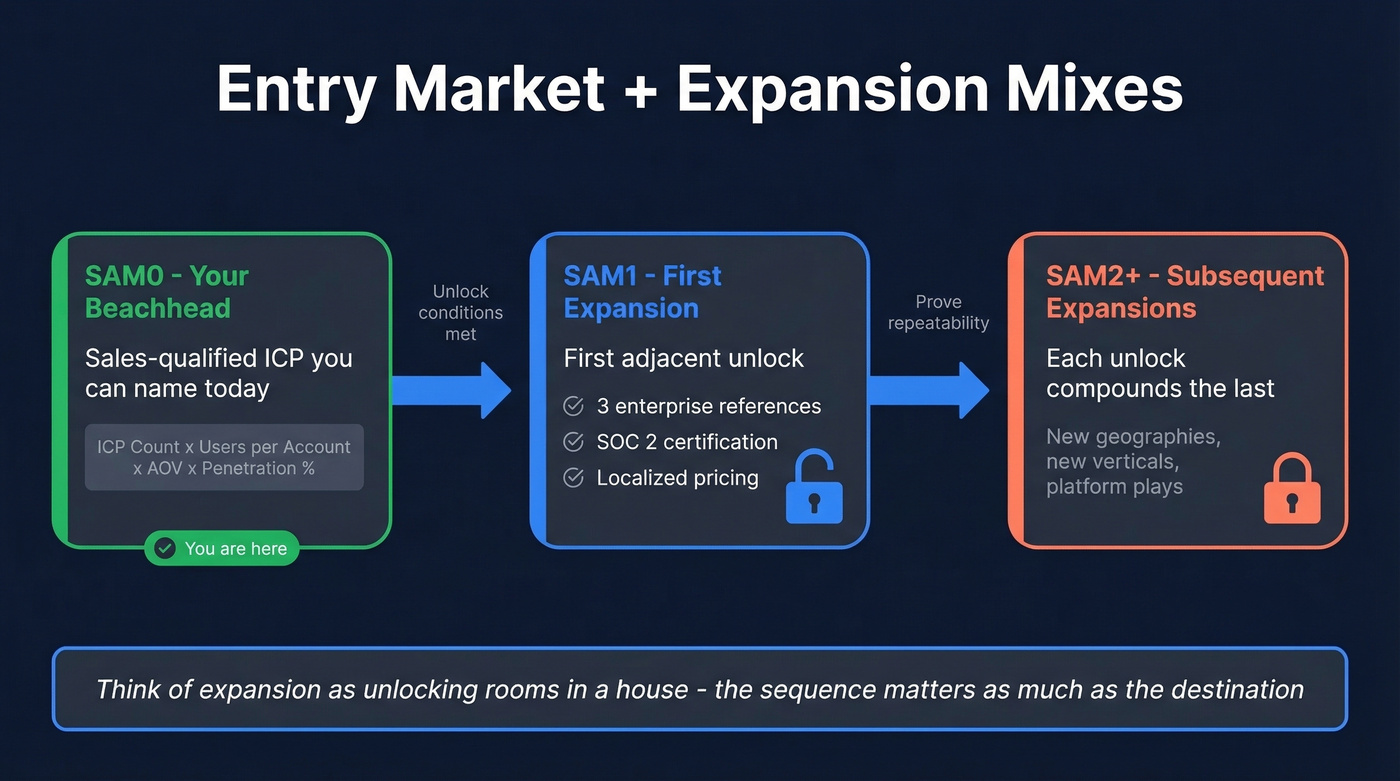
The formula: [Sales-qualified ICP count] x [users per account] x [realistic AOV] x [achievable penetration %]. Think of expansion as unlocking rooms in a house - each room has unlock conditions. SAM1 might require three enterprise reference customers and SOC 2 certification before you can credibly sell to regulated industries. The sequence matters as much as the destination.
Known, Emerging, and Invisible TAM
Paul Asel's framework splits TAM into three buckets. Known TAM is what analyst reports cover - Gartner and IDC have sized it. Emerging TAM reflects new behaviors and early signals that analysts haven't quantified yet. Invisible TAM is the market that doesn't exist until enabling technology arrives.
The most valuable expansion targets live in emerging and invisible TAM. By the time a market is "known," the incumbents are already entrenched and the multiples are priced in. Airbnb's TAM wasn't the hotel market - it was invisible until the behavior of staying in strangers' homes became normalized.
LTV x TAM Matrix
A 2x2 matrix that maps your GTM motion to your expansion strategy. High LTV with small TAM means whale hunting - enterprise sales, deep accounts, high touch. Low LTV with large TAM means casting a wide net - PLG, self-serve, volume.
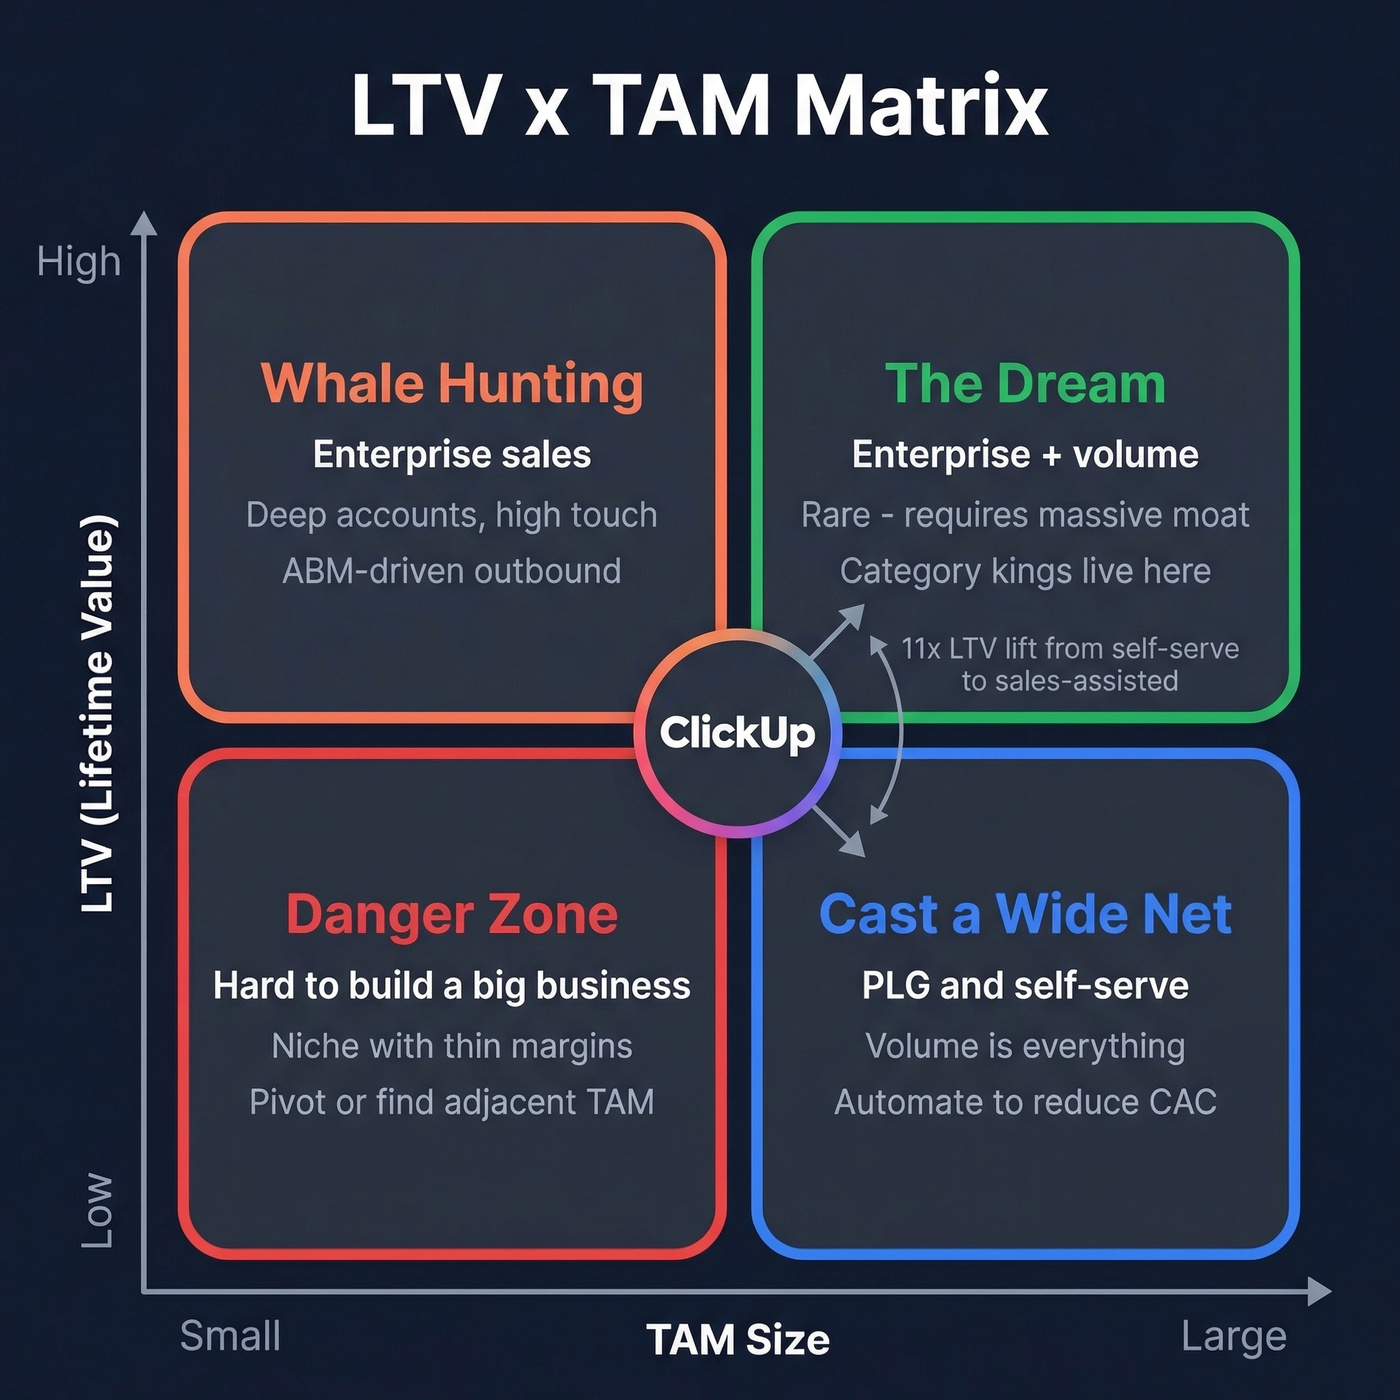
ClickUp's dual-engine model proves you can run both simultaneously. PLG handles distribution for the low-LTV, large-TAM quadrant, while a sales-led motion expands accounts once users land. The result: an 11x lift in LTV when a customer moves from self-serve to sales-assisted. That's a market expansion play disguised as an upsell motion - and it's one of the most elegant land-and-expand strategies in SaaS.
How Investors Pressure-Test Your TAM
VCs don't just want a big number. They want a number that supports fund-returner math.
Here's how it works for a $500M fund: at 20% ownership, returning the fund 1x requires a $2.5B exit. At a 10x revenue multiple, that implies $250M in revenue. For the next buyer to still see growth runway, the narrative needs to support $500M+ revenue over 5-7 years. At roughly 20% market share, that backs into a minimum TAM of $2.5B.
| Benchmark | Value |
|---|---|
| Lower bound TAM (public SW) | ~$5B |
| TAMs < $100B | 93% |
| TAMs < $50B | 78% |
| Market share ceiling (horizontal SaaS) | ~20% |
| ARR > 15% of stated TAM | Only 6 companies |
SOM must be grounded in bottom-up assumptions - CAC, pipeline capacity, conversion rates - not wishful thinking. Investors will reverse-engineer your SOM from your sales team's capacity and call out any gap between what you can execute and what you're projecting. If you're pitching a global TAM, be prepared to show region-by-region bottoms-up math. A single worldwide number without geographic decomposition is a red flag.
Common Expansion Mistakes
Inflating numbers with adjacent markets you can't access. A Reddit practitioner on r/sales put it bluntly: "Out of 50,000 potential companies, maybe 8,000 are realistically reachable in the next 3 years." Including enterprise buyers you can't sell to, geographies you don't operate in, and segments that require a different product isn't expansion - it's fiction.
Confusing optimization with expansion. The SPS Commerce lesson bears repeating. If your "expanded TAM" is really more modules sold to the same customer base, investors will see through it. Real expansion means new incumbents and new budget pools.
Moving up/downmarket without changing GTM motion. Enterprise sales requires different people, processes, and patience than SMB self-serve. Teams that try to bolt enterprise onto an SMB motion end up doing both poorly. Skip this path unless you're willing to staff and fund it as a separate business unit for at least 12 months.
Building for imaginary customers. If you can't name 50 companies in your expanded segment that would buy today, you're building for a market that doesn't exist yet. Bottom-up thinking prevents this.
Turning Expanded TAM Into Pipeline
Let's be honest about where most expansion efforts stall. You've identified a new segment, mapped the buyer personas, built the messaging - and then you realize you don't have a single verified email address for the new ICP. The strategy-to-execution gap is a data problem.

Prospeo closes that gap with 300M+ professional profiles, 143M+ verified emails, and 125M+ verified mobile numbers. When you're entering a segment you've never sold into, the ability to filter by buyer intent across 15,000 topics, technographics, headcount growth, and funding stage means you're building lists of companies that actually match your expansion thesis - not spraying cold emails at a generic firmographic list.
Here's a quick way to gut-check your expansion pipeline math: if your new segment has 5,000 target accounts and your historical conversion rate is 2%, you need 250 meetings to generate meaningful pipeline. Track three leading indicators to know if your expansion is working: new-segment pipeline velocity (are deals moving?), CAC in the new segment versus your core (how much more expensive is it?), and time-to-first-deal. If CAC in the new segment is 3x your core after six months, the expansion thesis needs revisiting.
The difference between a successful expansion and a failed one almost always comes down to how fast you can generate pipeline in the new segment. Strategy is the easy part. Execution speed is the constraint.
Moving into new geographies or customer segments means new buying committees you've never contacted. Prospeo's 143M+ verified emails and 125M+ mobile numbers refresh every 7 days - so when you enter an adjacent market, you're reaching real decision-makers, not stale records from last quarter.
Stop sizing markets you can't actually reach. Start prospecting them.
FAQ
What's the difference between TAM expansion and market penetration?
Market penetration means winning more share in your current TAM - more logos, higher win rates, better retention within the same addressable market. TAM expansion means redefining the market itself by entering segments, geographies, or product categories with new incumbents and new budget pools. Penetration has a ceiling; expansion moves the ceiling.
How big does my TAM need to be for venture funding?
Euclid VC's dataset suggests a lower bound around $5B for public software companies. Lightspeed's fund-returner math implies a $2.5B minimum in a $500M-fund scenario assuming roughly 20% market share dynamics. Mid-single-digit billions is the practical floor for venture-scale outcomes.
Can you expand TAM without launching new products?
Yes. Geographic expansion, moving upmarket or downmarket with dedicated GTM motions, reducing cost-to-serve to unlock new buyer segments, and acquiring companies in adjacent categories all expand TAM without building new products from scratch. Stripe's acquisition strategy is a prime example - buying TAM is often faster than building it.
When should a startup start thinking about expanding its TAM?
When you've captured >20% of your current addressable market, when YoY growth decelerates below 30%, or when >25% of customer feature requests fall outside your current offering. Most companies expand their TAM definition before penetration becomes the binding constraint - Euclid found only six public software companies with ARR exceeding 15% of their stated TAM.