Top-Down vs Bottom-Up Sales Forecasting: Which Method Actually Works?
The top-down vs bottom-up sales forecasting debate gets plenty of attention, but most teams miss forecasts for a simpler reason: their inputs are garbage. In a survey of 400 sales and finance leaders, four in five missed a quarterly forecast in the past year, and 66% said their reporting systems can't access historical CRM/performance data.
Here's the thing - if your CRM is dirty, arguing about forecasting methodology is just rearranging deck chairs.
How Top-Down Forecasting Works
Top-down starts big and narrows. You begin with Total Addressable Market (TAM), filter to your Serviceable Addressable Market (SAM), then estimate your Serviceable Obtainable Market (SOM) - the slice you can realistically win in a given period.
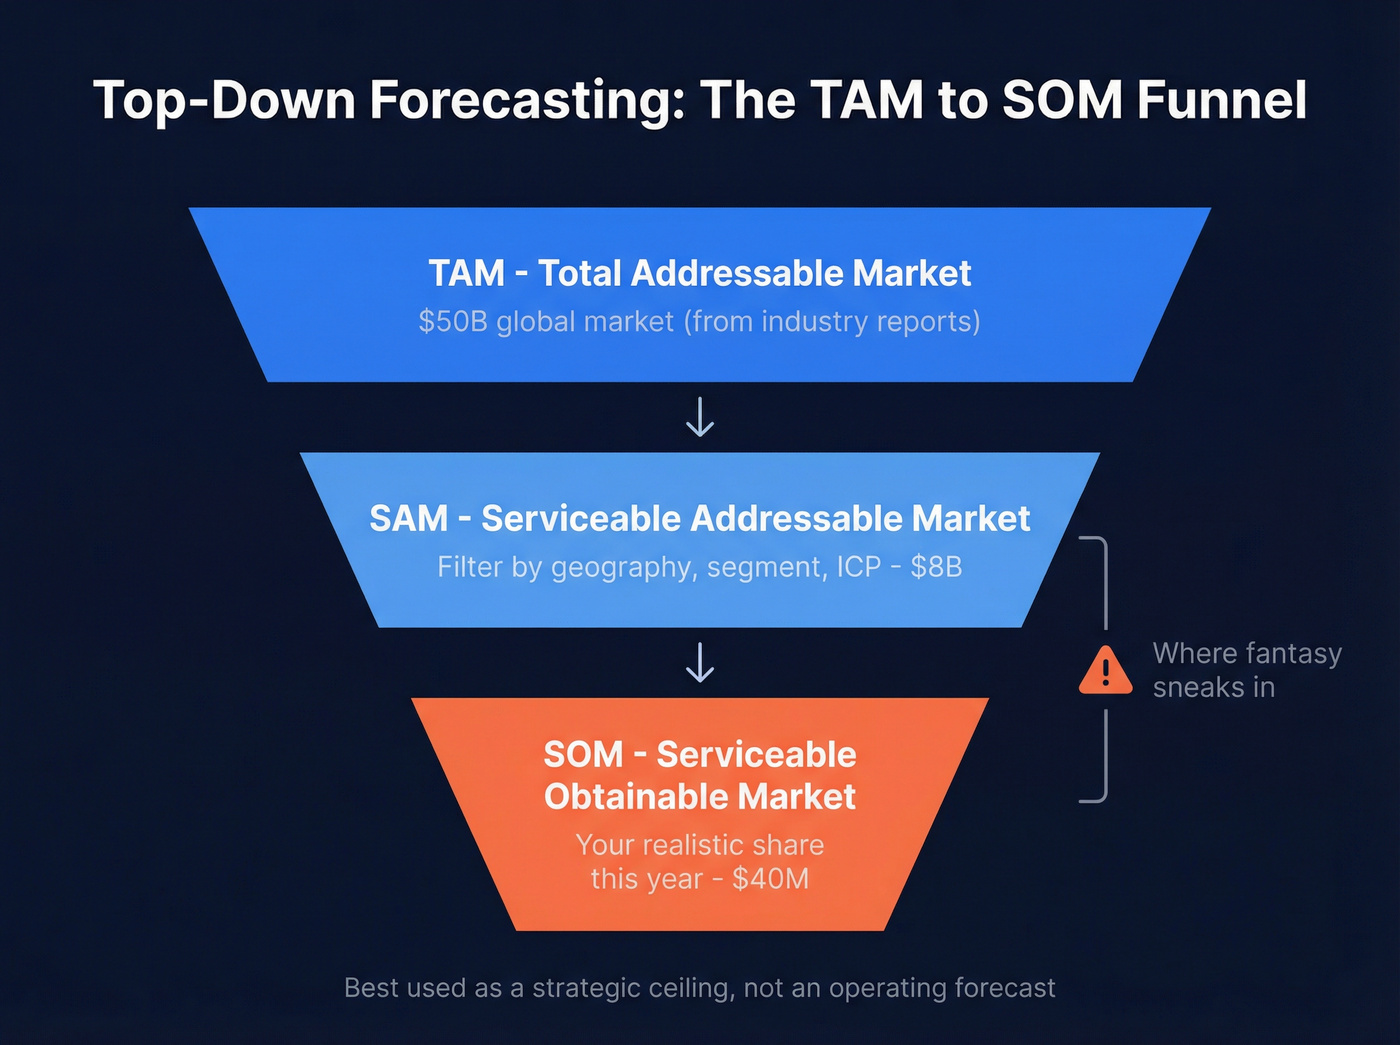
It looks great in a deck. Pull a market size from an industry report, filter by geography and segment for SAM, pick a penetration rate for SOM. Executives like it because it ties targets to a story about market opportunity.
The penetration rate is where fantasy sneaks in. A thread on r/EntrepreneurRideAlong used a perfect example: "150 million pairs of running shoes were sold worldwide, so we'll grab 1%." Sounds reasonable until you ask what channel, what budget, what sales capacity, and what timeline will produce 1.5M pairs. Silence. Every time.
Use top-down as a sanity check and a strategic ceiling, not as a quarter-by-quarter operating forecast.
How Bottom-Up Forecasting Works
Bottom-up forecasting builds from what your team is actually doing: pipeline, win rates, deal sizes, and cycle time. This is the method that gives you levers you can pull next week.
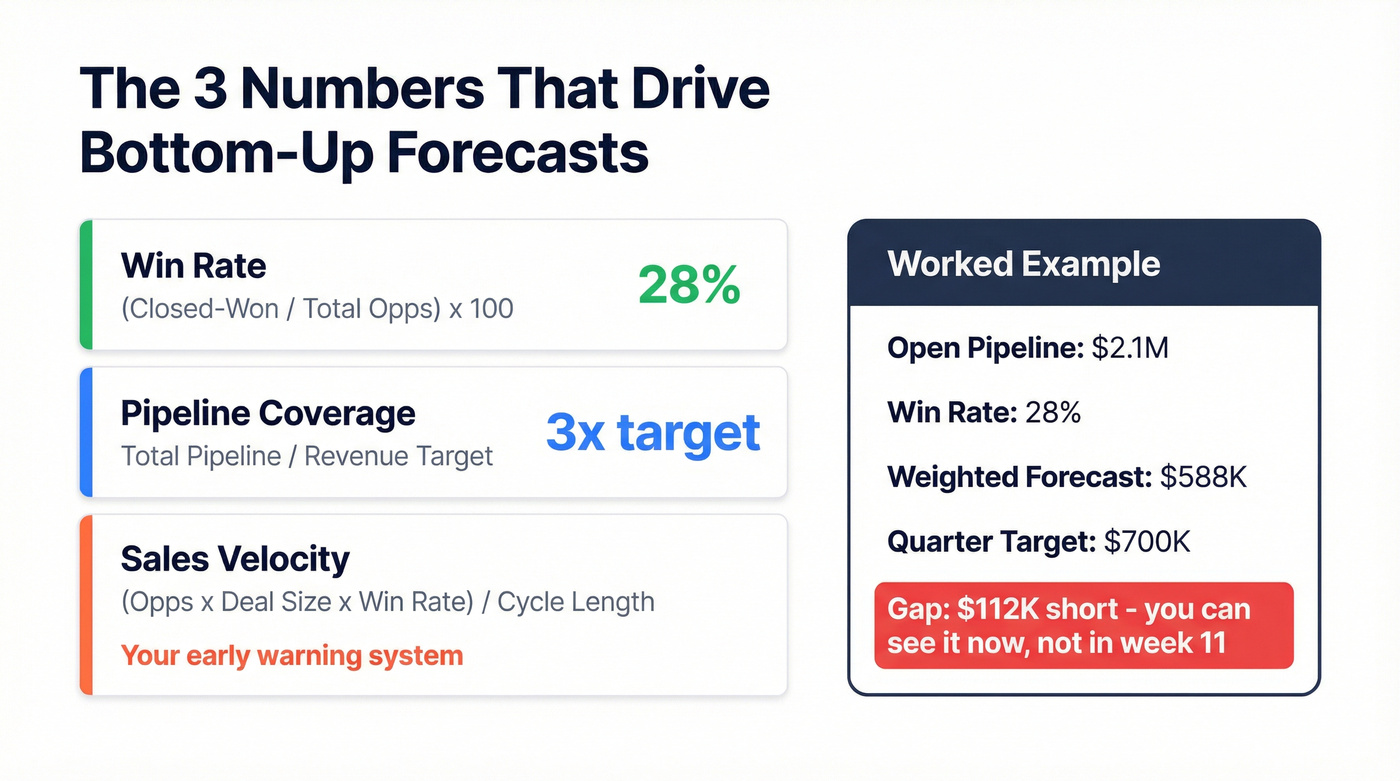
Three numbers do most of the work:
Opportunity-to-close rate: (Closed-won opportunities / Total opportunities) x 100. If you closed 22 out of 100, your win rate is 22%. Keep your pipeline clean or this number gets inflated fast - dead deals sitting in "Negotiation" for six weeks will wreck it.
Pipeline coverage ratio: Total pipeline value / Revenue target. The classic benchmark is 3x coverage - $3M in pipeline to hit $1M. But if a chunk of your pipeline hasn't moved stages in weeks, you don't have 3x coverage. You have wishful thinking.
Sales velocity: (Number of opportunities x Average deal size x Win rate) / Sales cycle length in days. This is your early warning system. No need to wait until week 11 to panic.
A tight example: you've got $2.1M in open pipeline and a 28% historical win rate. Your weighted forecast is $588K. If the quarter target is $700K, you're short, and you can see it immediately.
In our experience, teams that force weekly pipeline updates and delete dead deals stop "missing" forecasts. They start choosing them.
Side-by-Side Comparison
| Dimension | Top-Down | Bottom-Up | Winner |
|---|---|---|---|
| Data inputs | Market sizing | CRM + pipeline | Bottom-Up |
| Speed to build | Hours | Days/weeks | Top-Down |
| Near-term accuracy | Low | High | Bottom-Up |
| Best use | Strategy + ceilings | Quarterly execution | Bottom-Up |
| Biggest risk | Made-up assumptions | Dirty/stale CRM | Top-Down (less fragile) |
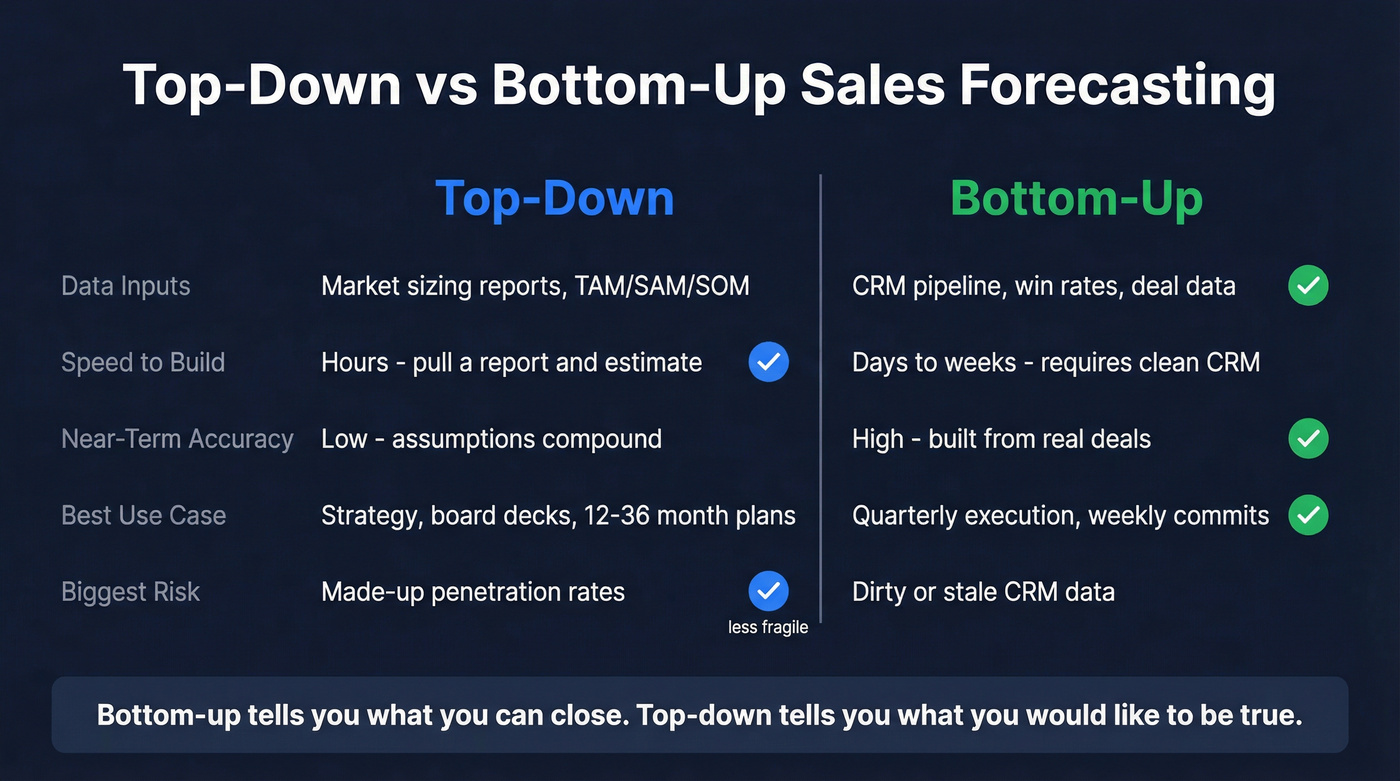
Bottom-up tells you what you can actually close. Top-down tells you what you'd like to be true. Understanding that difference is what separates a useful model from a slide deck exercise.
Bottom-up forecasts break when 30% of your pipeline contacts have invalid emails. Prospeo's 98% email accuracy and 7-day data refresh cycle mean your win rates, coverage ratios, and velocity calculations reflect reality - not ghosts.
Stop forecasting on top of dirty data. Fix the inputs first.
When to Use Each Method
No philosophy required - just match your situation.
| Factor | Choose Top-Down | Choose Bottom-Up | Choose Hybrid |
|---|---|---|---|
| Company stage | Pre-revenue / new market | Established GTM motion | Post-Series A with real pipeline |
| Data maturity | Little/no CRM history | 6+ months of clean CRM | Clean CRM + credible market sizing |
| Planning horizon | 12-36 months | This quarter / next quarter | Annual plan + quarterly commits |
| Sales motion | New ICP, unproven channels | Repeatable ICP + process | Mix of new + established segments |
One more useful signal: in a Varicent analysis of territory and quota planning that mirrors forecasting dynamics, the most-satisfied cluster - 26% of the sample - used bottom-up planning 86% of the time. That tracks with what we've seen in the wild. The closer you get to execution, the more bottom-up wins.
The Hybrid Approach That Survives Board Meetings
Your VP of Sales says $4.2M. Your CEO's top-down model says $5.8M. Both numbers can't be right.
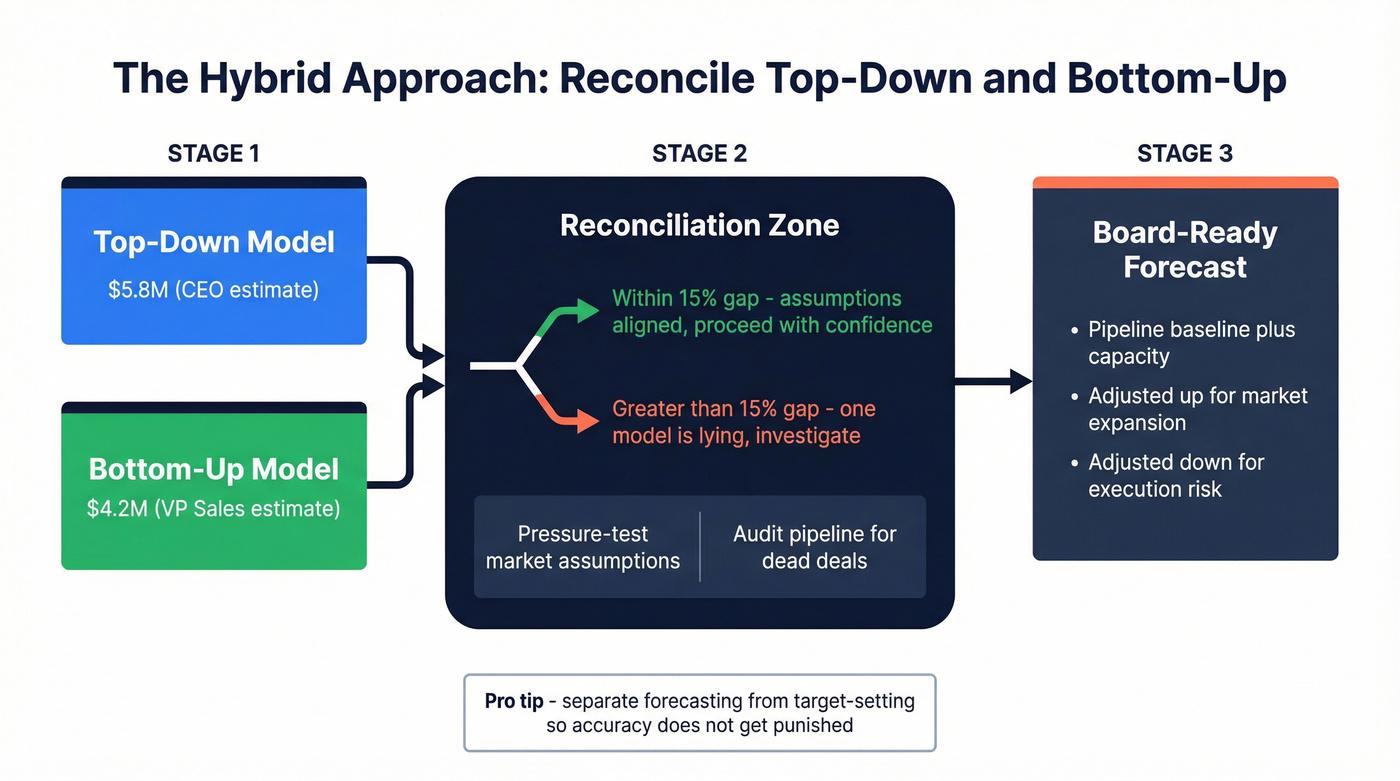
Hybrid forecasting fixes this by building both models independently and reconciling them. A practical heuristic: if the two forecasts land within ~15% of each other, your assumptions are aligned. If they're farther apart, one model is lying - either your market assumptions are inflated or your pipeline math is built on junk.
Some teams call this middle-out forecasting: start from a realistic mid-level baseline of current pipeline plus capacity, then adjust up with market expansion bets and down with execution risk. The entire point of comparing these two approaches is to find where the perspectives disagree - and why.
Let's be honest about the hardest part, though. It isn't the math - it's incentives. An r/FPandA thread captured the dynamic perfectly: when forecasts drive budgets and quotas, people game the numbers. The fix isn't a better spreadsheet. Separate forecasting from target-setting so accuracy doesn't get punished.
Why Most Forecasts Still Miss
Forecasting is an input problem disguised as a modeling problem.
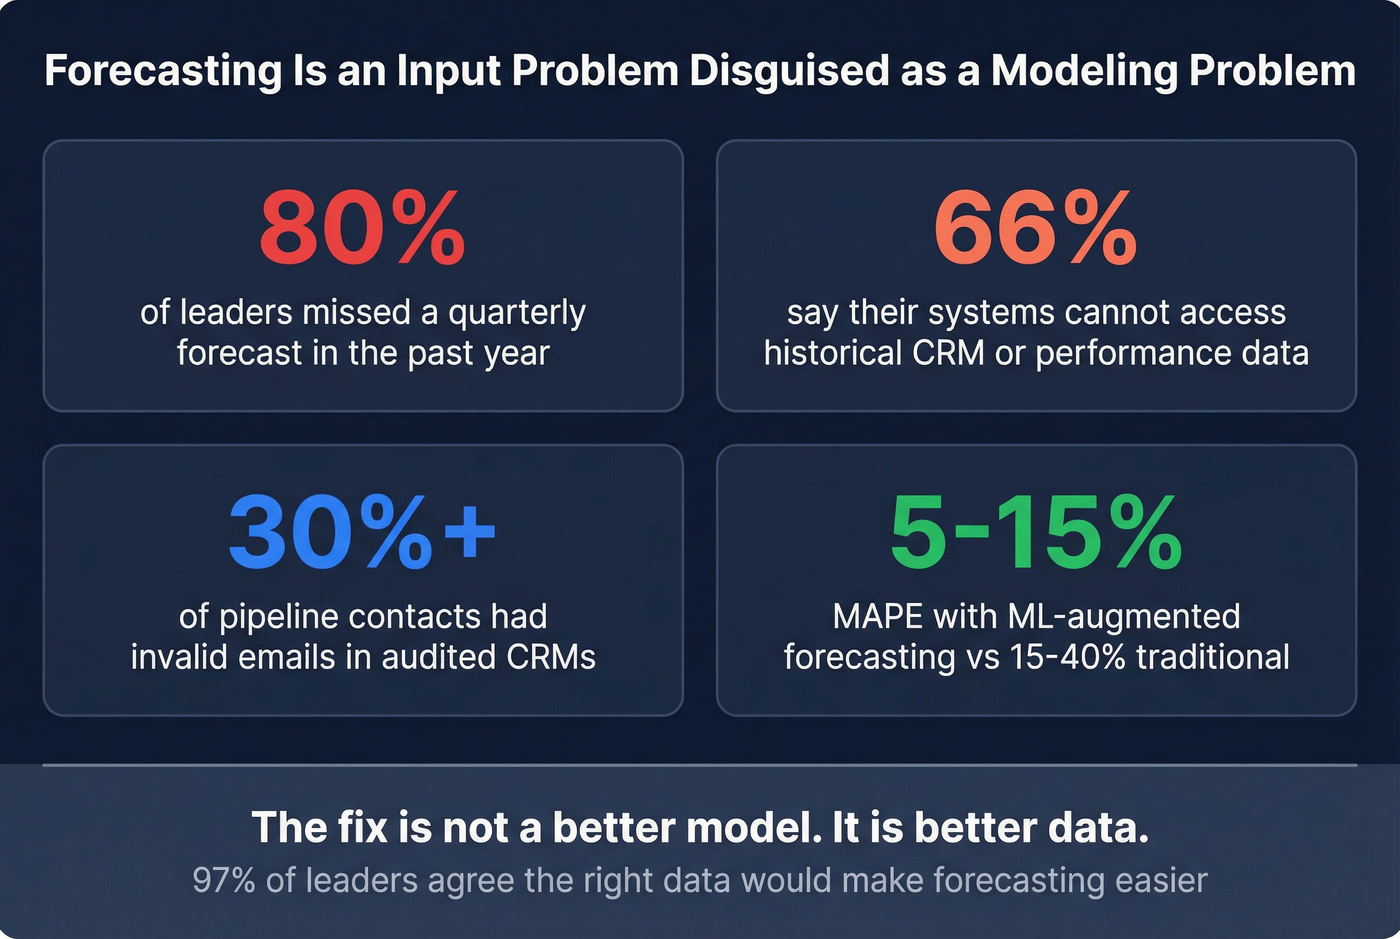
In that same survey of 400 leaders, 97% agreed the right data would make accurate forecasting easier - yet 66% said their systems can't access historical CRM/performance data. That gap is where forecasts go to die: bounced emails, job changes, duplicate accounts, and "late-stage" deals that haven't had a real conversation in months. We've audited pipelines where 30%+ of contacts had invalid email addresses. Every one of those records was inflating someone's forecast.
Traditional forecasting typically lands around 15-40% MAPE; ML-augmented approaches can get to 5-15%, which is why Gartner projects that by 2030, 80% of CSOs will require AI-augmented plans. But none of it matters if your pipeline is full of ghosts.
Prospeo addresses the unglamorous part that actually moves forecast accuracy: 98% email verification, records refreshed every 7 days, and CRM/CSV enrichment returning 50+ data points per contact. If your pipeline data is the weak link, Prospeo's data enrichment is where to start.
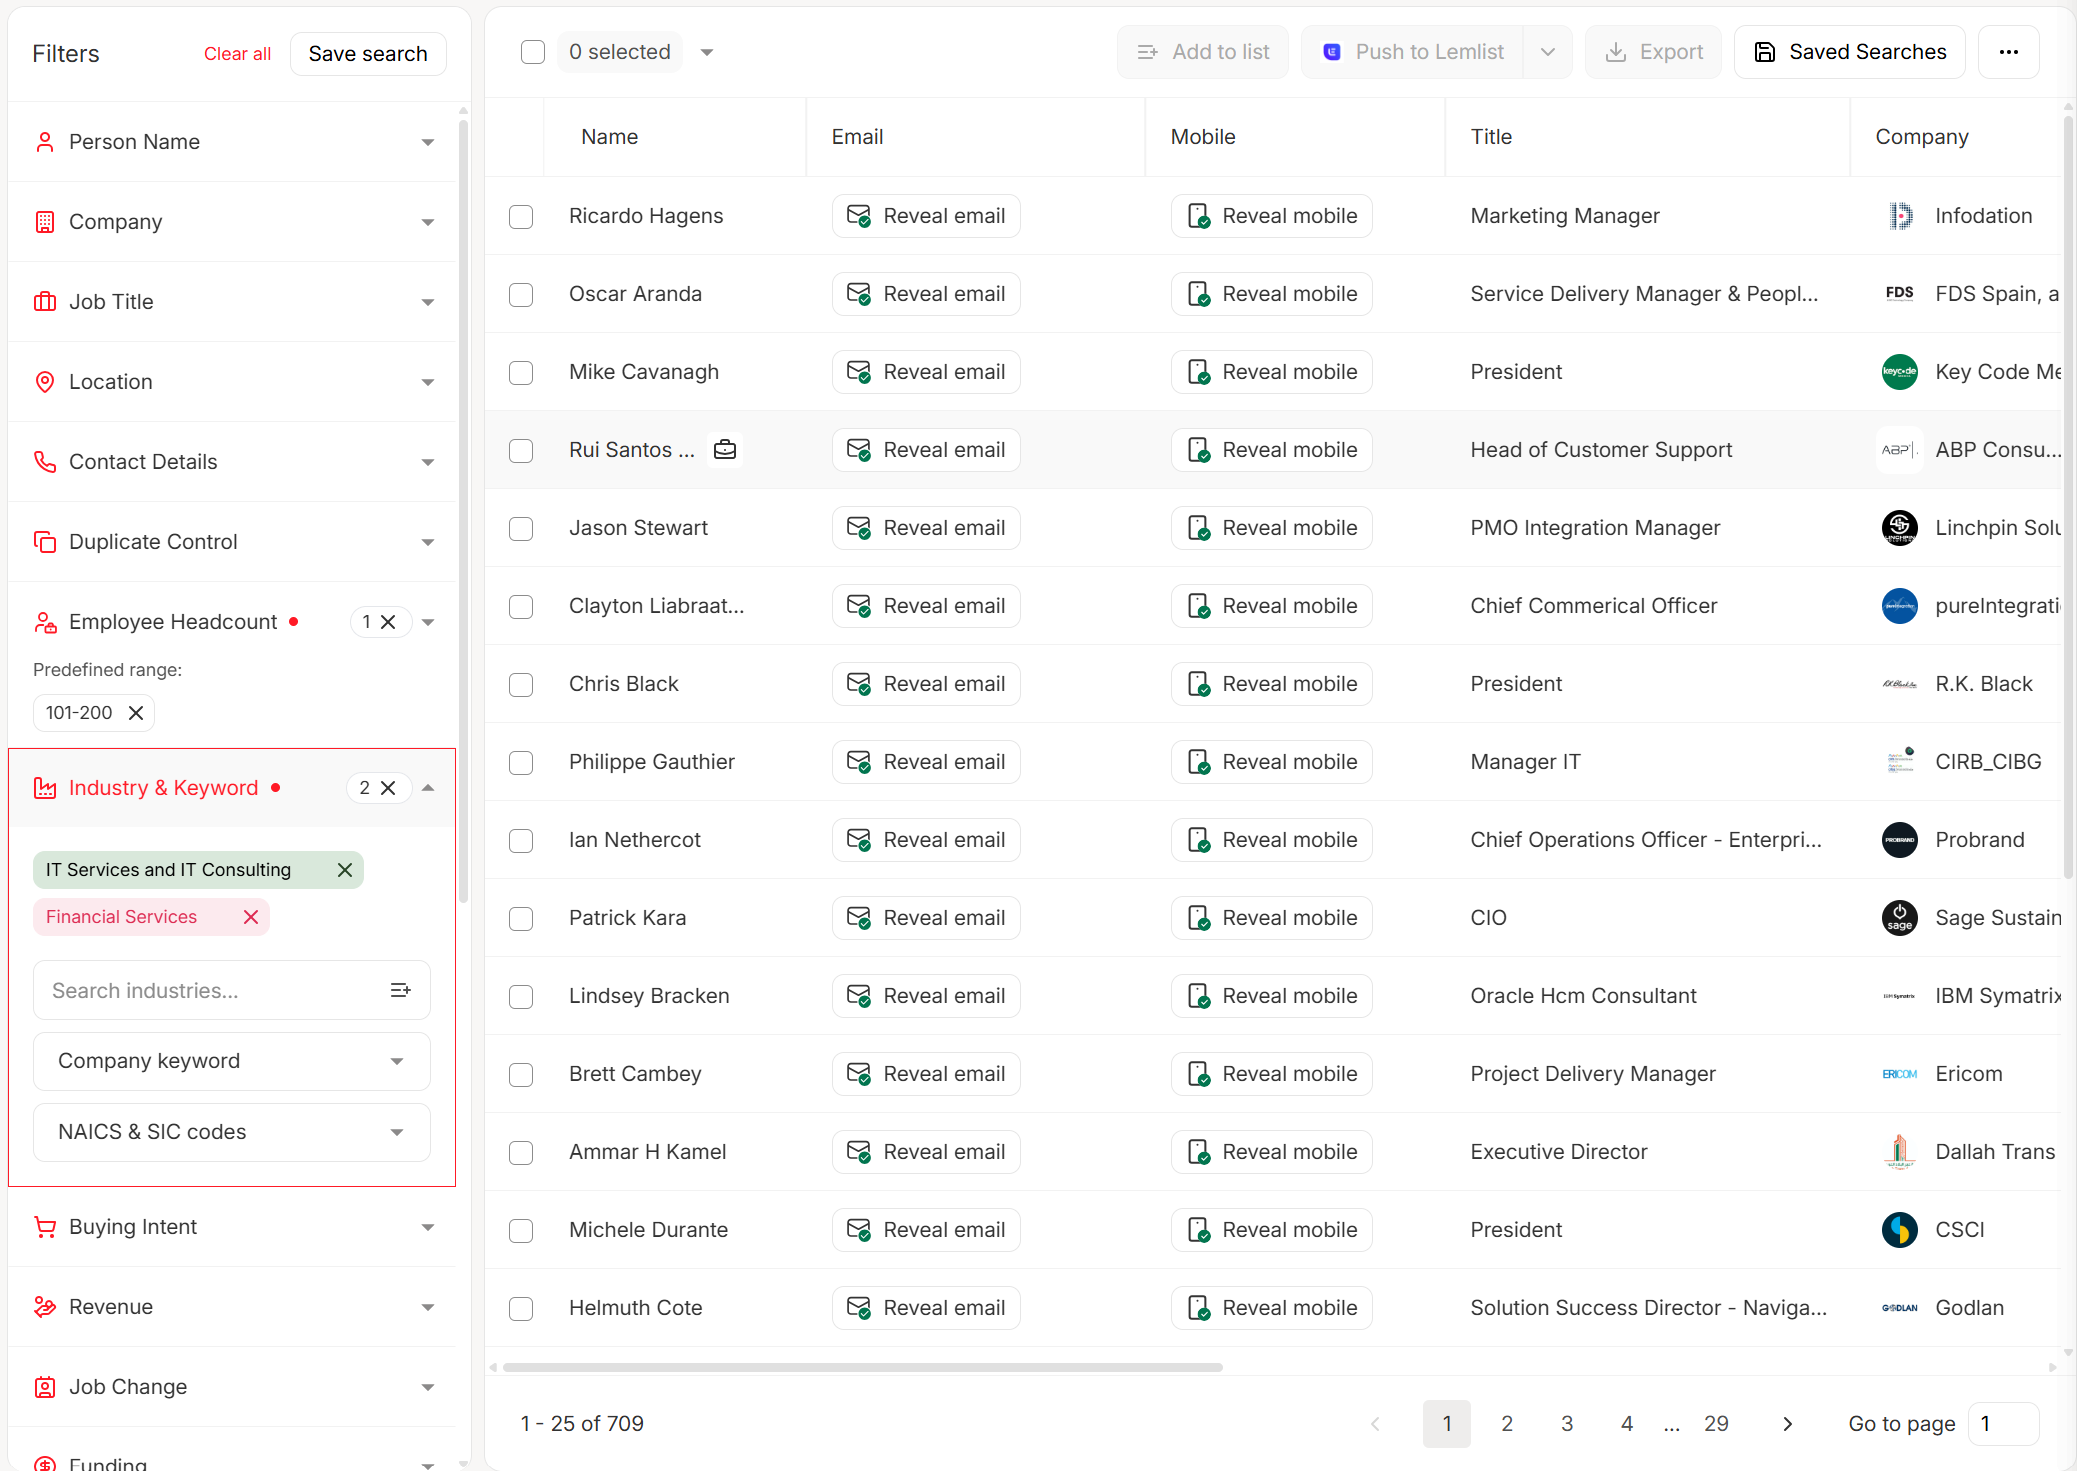
Every stale contact in your CRM inflates your pipeline coverage and distorts your forecast. Prospeo's enrichment returns 50+ verified data points per contact at a 92% match rate - so your bottom-up model actually holds up in the board meeting.
Audit your pipeline data before your next quarterly commit.
What Your Forecast Model Needs
Whether you build in a spreadsheet or a dedicated tool, include these fields:
- Opportunity Name and Sales Rep for accountability
- Sales Phase/Stage - Discovery, Demo, Proposal, Negotiation, Closed
- Region and Segment
- Forecast Amount and Probability % by stage
- Projected Close Month
- Weighted Forecast Amount (Forecast Amount x Probability)
For starting templates, Smartsheet's sales forecasting templates and K38 Consulting's roundup are both solid. Skip anything that asks you to fill in 40 columns before you've closed a single deal - keep it simple and keep it current.
If you're evaluating tooling beyond spreadsheets, start with sales forecasting solutions and compare feature depth across the best sales forecasting tools.
FAQ
Which method is more accurate for near-term revenue?
Bottom-up wins for near-term forecasts because it's built from pipeline reality: win rates, deal size, and cycle time. Top-down works best for 12-36 month strategic planning. Run both and reconcile for the most reliable number.
Can you combine both approaches?
Yes. Build a bottom-up forecast from pipeline and a top-down estimate from market sizing, then reconcile the gap. If they land within about 15%, your assumptions are aligned. If not, pressure-test the market assumptions or audit the pipeline.
What's the biggest reason sales forecasts miss?
Data quality. Two-thirds of sales and finance leaders say their reporting systems can't access historical CRM/performance data, and stale records corrupt every model. Keeping contact and account data current - through regular enrichment and verification - is the single highest-leverage fix.
How do I start bottom-up forecasting with no historical data?
Start with today's pipeline and conservative assumptions. Track win rate, average deal size, and cycle length for one full quarter, then recalibrate. One quarter of clean data beats a "1% of TAM" guess and improves fast as you iterate.