10 Types of Sales Analytics (and the Benchmarks That Define "Good")
Only 43.5% of sales professionals hit quota last year. Reps spend roughly 30% of their time actually selling. And 91% of CRM data is incomplete. Those three numbers explain why understanding the types of sales analytics isn't optional - it's the difference between teams that diagnose problems early and teams that find out they missed the quarter during the board meeting.
The standard framework - descriptive, diagnostic, predictive, prescriptive - is too abstract to build dashboards from. Sales teams need granular, operational subtypes tied to real benchmarks. What follows are ten categories of sales analysis that map to how revenue orgs actually work, with the numbers that define "good" at each level.
What You Need (Quick Version)
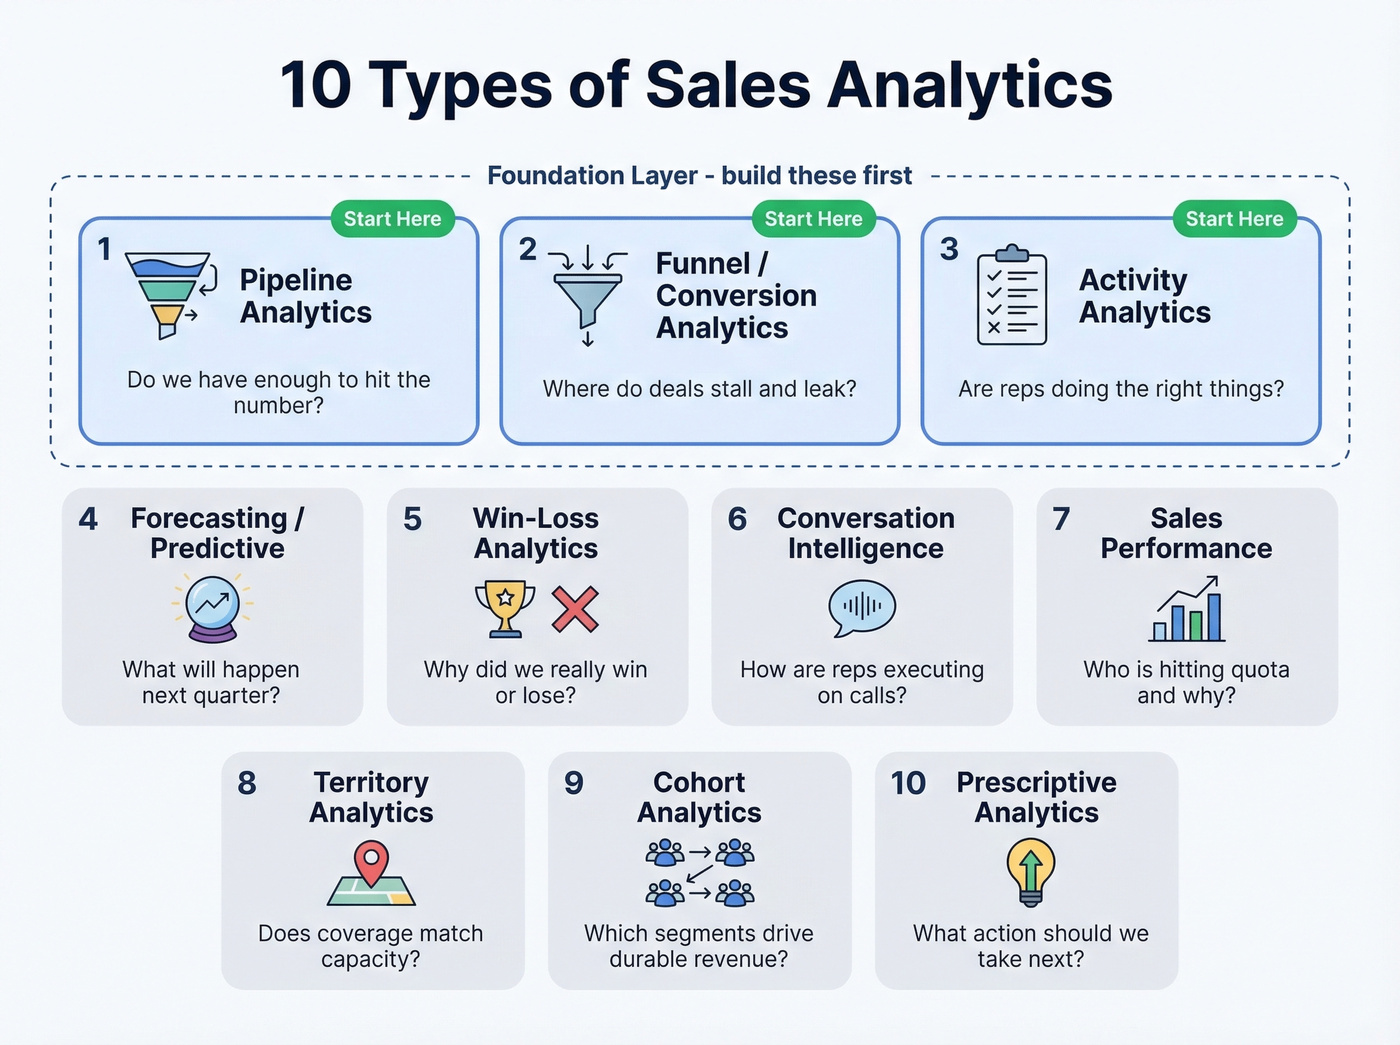
If you're building a sales analytics practice from scratch, don't boil the ocean. Start with three:
- Pipeline analytics - tells you whether you have enough to hit the number
- Funnel/conversion analytics - tells you where deals stall and leak
- Activity analytics - tells you whether reps are doing the right things at the right volume
Everything else layers on top once those three are solid. But before you build a single dashboard, audit your CRM data. 91% of it is incomplete, and 70% decays into inaccuracy every year. No analytics framework survives a garbage-in problem.
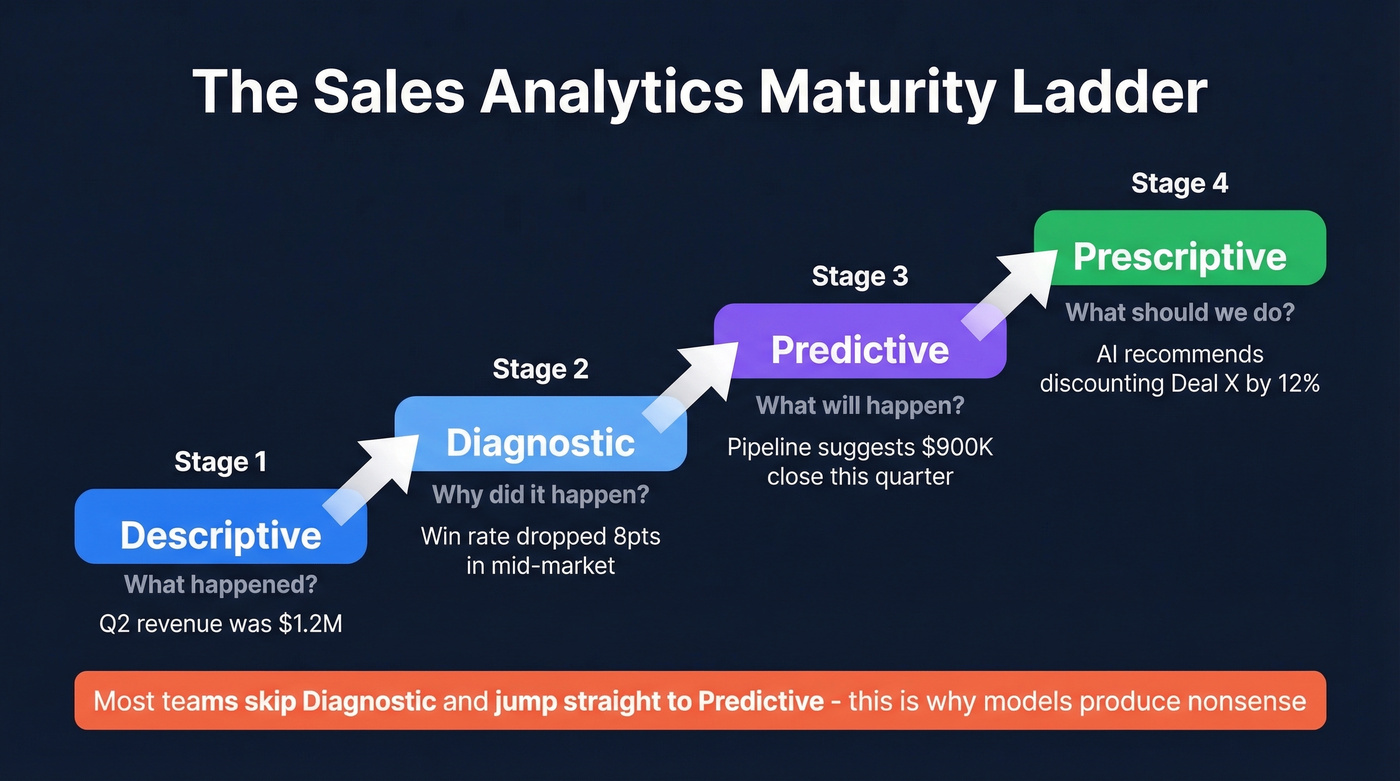
The Four Analytics Pillars
Most teams have seen these before. The insight they miss is that diagnostic analytics - the "why" layer - is the one most commonly skipped. Teams jump from "what happened" straight to "what will happen" and wonder why their predictive models produce nonsense.
| Pillar | Question It Answers | Sales Example |
|---|---|---|
| Descriptive | What happened? | Q2 revenue was $1.2M |
| Diagnostic | Why did it happen? | Win rate dropped 8pts in mid-market |
| Predictive | What will happen? | Pipeline suggests $900K close this quarter |
| Prescriptive | What should we do? | AI recommends discounting Deal X by 12% |
Think of these as a maturity ladder. You can't prescribe actions if you haven't diagnosed root causes, and you can't diagnose anything without reliable descriptive data. Now let's get specific.
10 Types of Sales Analytics That Matter
1. Pipeline Analytics
Pipeline analytics is the heartbeat of any revenue org. It answers one question: do we have enough qualified pipeline to hit the number?
The core formula is pipeline velocity:
(Number of Opportunities x Average Deal Size x Win Rate) / Sales Cycle Length
This gives you a dollar-per-day throughput metric. Track it weekly, not monthly - by the time a monthly report flags a problem, you've already lost three weeks.
The benchmark that matters most is pipeline coverage. You need 3x to 6x your quota in active pipeline value to comfortably hit target. Below 3x and you're relying on heroics. Above 6x, validate your stage definitions and qualification criteria so you're not inflating pipeline with low-probability deals.
The more advanced play is management by exception. Instead of reviewing every deal in a pipeline meeting, filter for anomalies: stalled deals without activity in 14+ days, close dates that slipped more than once, deals where the champion went dark. We've seen teams cut pipeline review time in half by switching to exception-based dashboards instead of scrolling through 200 open opportunities.
2. Funnel / Conversion Analytics
Funnel analytics tracks how efficiently prospects move through each stage. The magic is in the stage-by-stage conversion rates, because that's where you find the bottleneck.
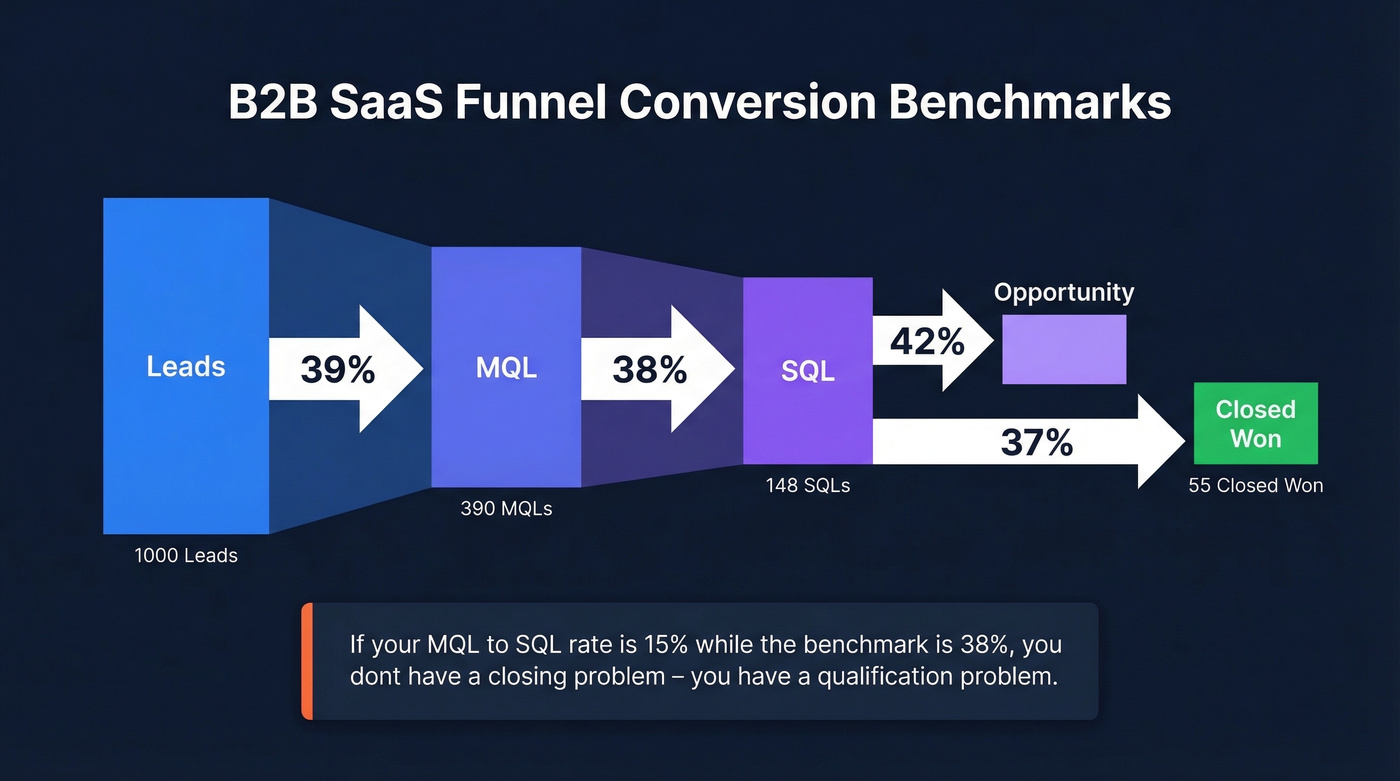
Here are B2B SaaS benchmarks worth bookmarking:
| Stage Transition | Benchmark Rate |
|---|---|
| Lead to MQL | 39% |
| MQL to SQL | 38% |
| SQL to Opportunity | 42% |
| SQL to Closed Won | 37% |
If your MQL-to-SQL conversion is 15% while the benchmark is 38%, you don't have a closing problem - you have a qualification problem. Funnel analytics forces you to locate the actual constraint instead of blaming reps for not closing harder.
Segment these rates by lead source, persona, and deal size. The aggregate number is useful. The segmented view is where you find actionable insights.
3. Forecasting / Predictive Analytics
Here's the thing: most sales forecasts are just vibes dressed up in a spreadsheet. A manager asks each rep for their "commit" number, rolls it up, applies a gut-feel haircut, and calls it a forecast. The result is typically plus or minus 12-15% variance from actual.
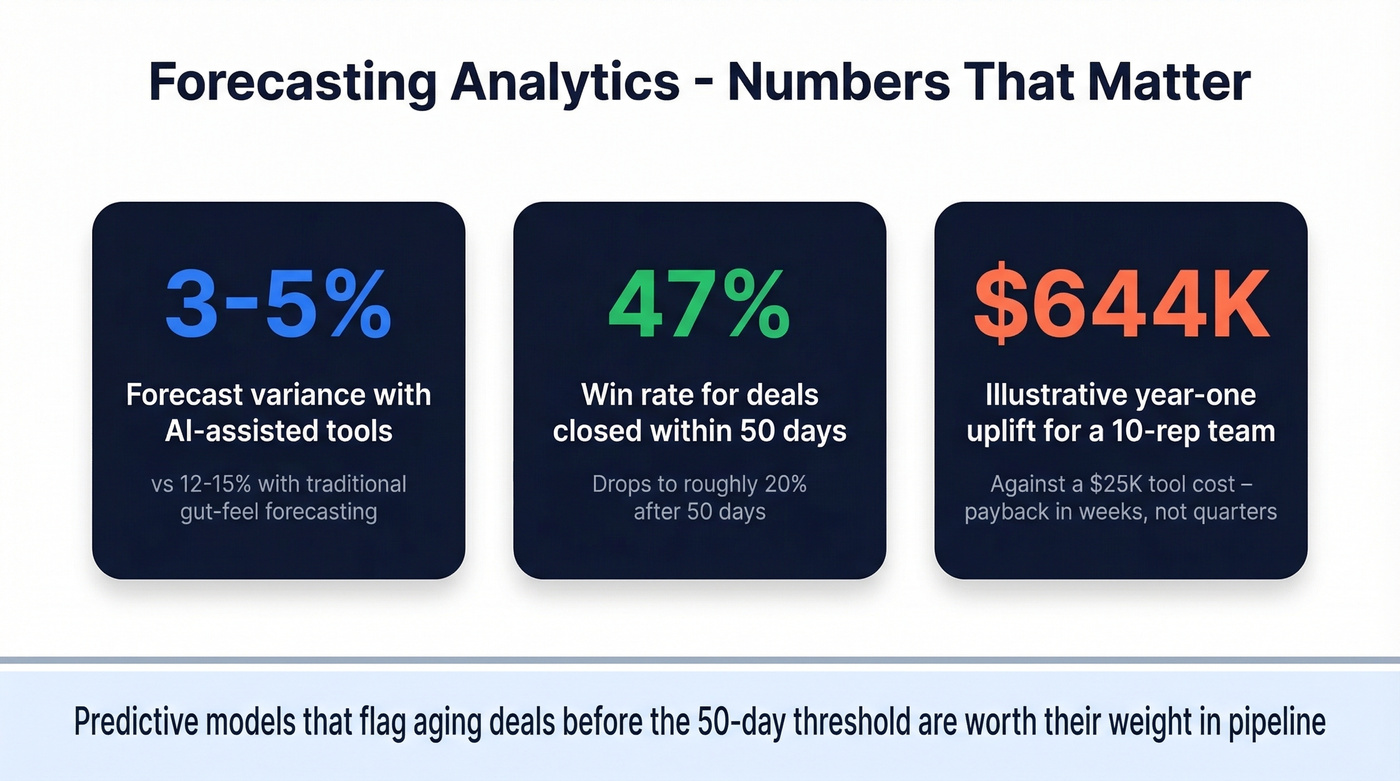
AI-assisted forecasting tools compress that to plus or minus 3-5% variance. Aviso published an illustrative model for a 10-rep team: a 4-point win rate improvement plus a 15-day cycle reduction produces $644K in year-one uplift against a $25K tool cost. Even if you cut those numbers in half, the payback period is measured in weeks, not quarters.
One benchmark worth internalizing: opportunities closed within 50 days carry a 47% win rate. After 50 days, win rates drop to roughly 20% or lower. Predictive models that flag aging deals before they cross that threshold are worth their weight in pipeline.
4. Win-Loss Analytics
Win rate and win-loss ratio sound interchangeable. They're not.
Win rate = wins divided by total opportunities. Win-loss ratio = wins divided by losses, excluding no-decisions and stalled deals. You need both - they tell different stories about competitive performance versus overall pipeline health.
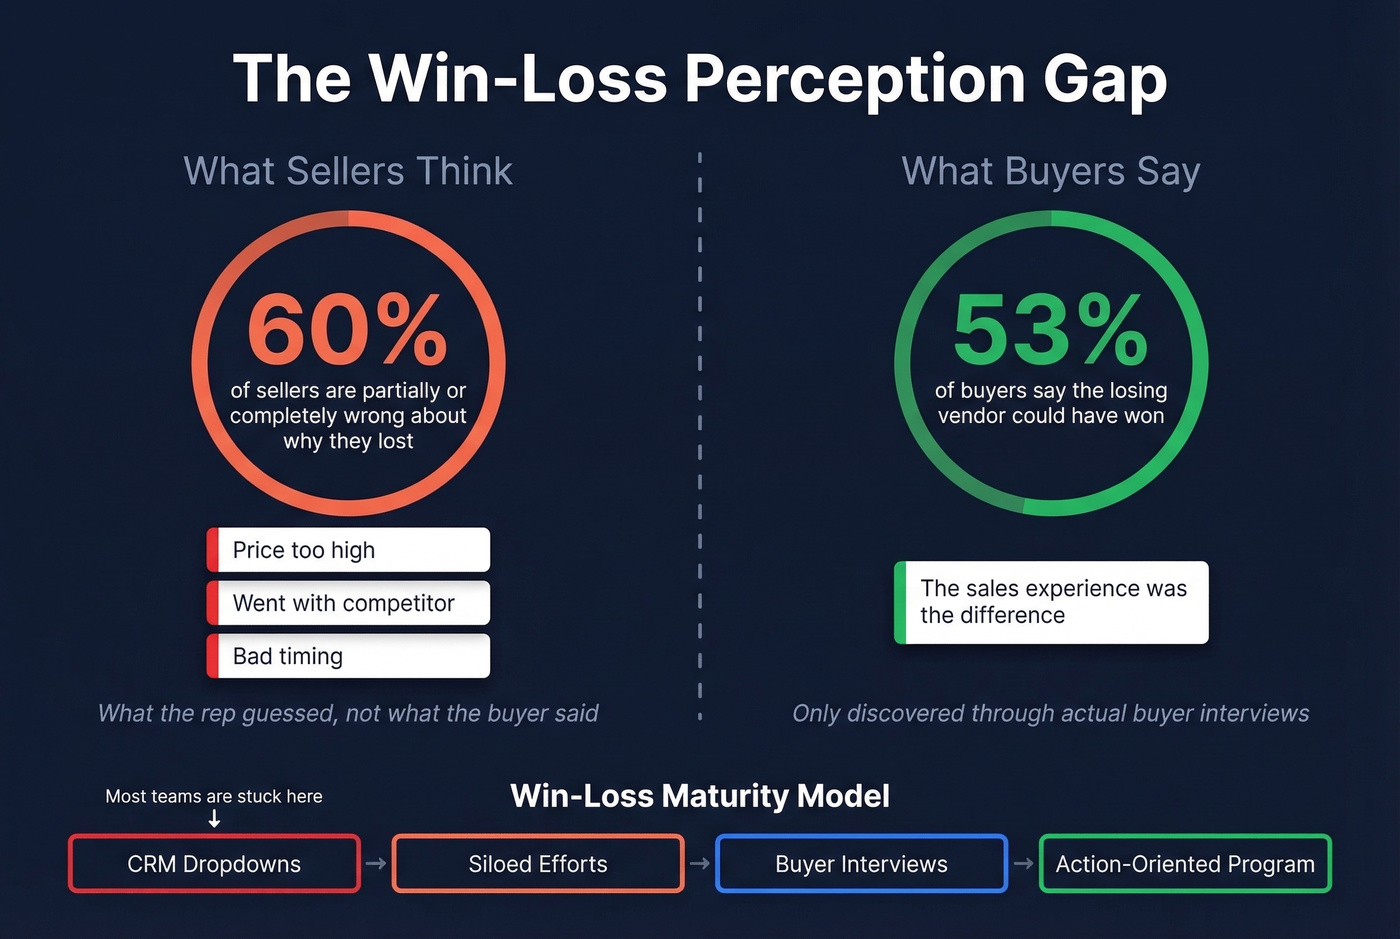
The uncomfortable truth: 60% of sellers are partially or completely wrong about why they lost a deal. CRM reason codes - "price too high," "went with competitor," "timing" - are the biggest lie in B2B sales. They're what the rep guessed, not what the buyer said. And 53% of buyers report that the losing vendor could have won if they'd handled the sales experience differently.
Real win-loss analysis means talking to buyers. The maturity model progresses from sales-sourced CRM dropdowns (biased, sporadic) through siloed departmental efforts, to integrated programs with buyer interviews, and finally to action-oriented programs where cross-functional teams drive measurable changes from findings. Most teams are stuck at stage one.
5. Conversation Intelligence Analytics
Use conversation intelligence if you need to coach reps on execution - talk-time ratios, objection handling, competitor mentions, next-step setting. CI tools like Gong excel at surfacing patterns across hundreds of recorded calls.
But skip CI as your only win-loss source. Conversation intelligence captures roughly 5% of the buyer's journey - the parts where a seller is present and recording. The other 95% happens outside your view: internal champion conversations, procurement reviews, competitor demos. Sellers and buyers disagree on loss reasons 50-70% of the time. CI tells you how reps performed; win-loss analysis tells you why buyers decided. Confusing them is one of the most common analytics mistakes in B2B sales.
6. Activity / Productivity Analytics
Reps spend about 30% of their time selling. The other 70% goes to admin, CRM updates, internal meetings, and searching for contact data. Activity analytics tracks the leading indicators - calls made, emails sent, meetings booked, proposals delivered - that eventually produce lagging indicators like revenue.
The distinction between leading and lagging matters enormously. Revenue tells you what happened last quarter. Activities, pipeline creation rate, and engagement velocity tell you what's happening right now.
Ask any RevOps leader what breaks their activity dashboards, and the answer is almost always data quality - not tooling. If 70% of your CRM contact data decays annually, your reps are calling disconnected numbers and emailing bounced addresses, and the dashboard dutifully records all that wasted activity as "productive." Automation can free up roughly 20% of seller capacity, but only if the underlying data is reliable. Prospeo's 7-day data refresh cycle and 98% email accuracy keep the contact data feeding those dashboards honest, so activity metrics actually reflect effort against reachable prospects.
7. Sales Performance Analytics
Performance analytics zooms out from individual activities to rep-level and team-level outcomes. Quota attainment is the headline metric, and the headline is grim: 69% of reps fell short of quota in recent benchmarks, with only 15% of sales teams having more than half their reps at 80%+ attainment.
The value is in segmentation. Performance by rep, by segment, by product line, by tenure. A rep who's crushing it in mid-market but struggling in enterprise isn't a performance problem - it's a territory problem. Performance analytics without segmentation is just a leaderboard, and leaderboards don't fix anything.
8. Territory Analytics
Territory analytics answers whether your market coverage matches your capacity. Four questions to run through:
- Capacity model - How many accounts can one rep effectively work? Most teams overestimate by 40%+.
- Coverage ratio - What percentage of target accounts have active engagement this quarter?
- Whitespace analysis - Where are the untouched accounts that fit your ICP?
- Balance check - Are reps distributed proportionally to opportunity density?
The common failure mode is over-indexing on named accounts while ignoring greenfield territory. We've run analyses where teams had 40% of their reps covering 15% of their addressable market, with the remaining 85% completely untouched. That kind of imbalance costs you a year of growth before anyone notices.
9. Cohort Analytics
Imagine two deals that both closed at $50K ARR. One was an enterprise deal from Q1 that expanded to $65K within a year. The other was an SMB deal from Q3 that churned at renewal. In aggregate, your NRR looks fine. Cohort analytics tells you the real story.
By grouping customers by acquisition period or segment and tracking their behavior over time, you separate durable revenue from churn-prone revenue. A healthy SaaS business might show 110% net revenue retention overall, but cohort analysis could reveal that enterprise deals expand at 130% while SMB deals contract at 85%. NRR and GRR by cohort are essential for understanding which segments actually drive long-term value - and which ones flatter your topline while quietly eroding your base.
10. Prescriptive Analytics
Prescriptive analytics sits at the top of the maturity ladder - systems that don't just predict outcomes but recommend specific actions. This is where AI coaching tools live. Outreach's Kaia, for example, shaves 11 days off sales cycles on average and boosts win rates by roughly 10 percentage points on deals over $50K.
The broader trend: 45% of revenue teams now use a hybrid AI-SDR model where AI handles initial outreach sequencing and humans take over at the engagement signal. Prescriptive analytics powers the decision layer - which accounts to prioritize, when to discount, which deals to walk away from.
Real talk: If your average deal size is under $10K, you probably don't need prescriptive AI. The ROI math doesn't work until deal sizes justify the tooling cost. Nail your pipeline, funnel, and activity analytics first - that alone will move the number more than any AI layer bolted onto bad data.
Every analytics type on this list - pipeline, funnel, forecasting, win-loss - breaks down when 91% of your CRM data is incomplete. Prospeo's enrichment engine fills gaps across 50+ data points per contact with a 92% match rate and a 7-day refresh cycle. Clean data in, accurate analytics out.
Stop building dashboards on decaying data. Fix the foundation first.
Benchmarks at a Glance
Every key benchmark from this guide in one table. Bookmark it.
| Metric | Benchmark |
|---|---|
| Pipeline coverage | 3x-6x quota |
| B2B win rate (avg) | 28% |
| "Good" win rate | >50% |
| Quota attainment | 43.5% |
| Lead to MQL | 39% |
| MQL to SQL | 38% |
| SQL to Opp | 42% |
| SQL to Closed Won | 37% |
| Win rate within 50 days | 47% |
| Win rate after 50 days | ~20% |
| Sales cycle (most common) | 1-2 quarters (34% of teams) |
| CRM data incomplete | 91% |
| CRM data decay (annual) | 70% |
| Time spent selling | ~30% |
Analytics Maturity Model
Not every team needs prescriptive AI. Most teams need to stop lying to themselves about their data quality. The five-level maturity model provides a realistic self-assessment:
- Chaotic - No consistent reporting. Reps track deals in spreadsheets. Forecasts are fiction.
- Reactive - Basic CRM dashboards exist but nobody trusts them. Reports are pulled ad hoc when leadership asks.
- Defined - Standardized metrics, automated reporting, repeatable processes. Most teams should aim here first.
- Managed - Diagnostic analytics in place. Teams understand why numbers move, not just that they moved.
- Optimized - Predictive and prescriptive analytics drive daily decisions. AI augments human judgment.
In our experience, teams stuck at level 2 who try to buy their way to level 5 with an expensive forecasting platform always regret it. Diagnostic analytics - the "why" layer - is the foundation that makes predictive models trustworthy. If you're at level 2, your next move is standardizing definitions and automating descriptive reports, not shopping for AI software.
Common Mistakes to Avoid
Building on rotten data. If your CRM data is incomplete and decaying, every dashboard you build is a guess. Fix the foundation before you build the analytics.
Ignoring leading indicators. Revenue tells you what happened last quarter. Activities, pipeline creation rate, and engagement velocity tell you what's happening now.
Not segmenting. An aggregate 28% win rate hides the fact that your enterprise segment closes at 40% and your SMB segment closes at 12%. Slice every metric by segment, persona, deal size, and source.
Poor visualization choices. A 47-row pivot table isn't a dashboard. If a VP can't grasp the insight in five seconds, the visualization failed.
Trusting CRM reason codes. 60% of sellers are wrong about why they lost. Run actual buyer interviews - see the win-loss section above.
Over-relying on historical data. Markets shift. A model trained on 2024 buying patterns won't reflect 2026 budget cycles. Refresh your models quarterly and weight recent data more heavily.
Tools by Analytics Category
The tools you need depend on which types of sales analytics you're implementing:
| Category | Tool | Analytics Types | Starting Price |
|---|---|---|---|
| B2B Data | Prospeo | Pipeline, activity, territory | Free; ~$0.01/email |
| CRM | Salesforce | All | $25/user/mo |
| CRM | HubSpot | Pipeline, funnel, activity | Free tier available |
| CRM | Pipedrive | Pipeline, activity | $14/user/mo |
| BI Platform | Tableau | All | $15/user/mo |
| BI Platform | Zoho Analytics | All | $24/mo |
| Revenue Intel | Gong | Conversation, win-loss | ~$100-150/user/mo |
| Revenue Intel | Clari | Forecasting, pipeline | Not public |
Every analytics tool on this list produces better outputs when the underlying contact and account data is accurate. Prospeo's CRM and CSV enrichment returns 50+ data points per contact with a 92% API match rate, and its 7-day refresh cycle means the data feeding your dashboards isn't already stale by the time you pull a report. The free tier gives you 75 verified emails per month - enough to test whether cleaner data actually moves your metrics before committing budget.

Pipeline velocity depends on three inputs: opportunities, win rate, and cycle length. Bad contact data tanks all three - emails bounce, dials go nowhere, and reps waste 70% of their time on stale records. Prospeo delivers 98% email accuracy and 125M+ verified mobiles so your activity analytics actually reflect selling, not chasing ghosts.
Give your reps data that converts at every funnel stage.
FAQ
What are the four main types of analytics?
Descriptive (what happened), diagnostic (why), predictive (what will happen), and prescriptive (what to do about it). Sales teams need the ten operational subtypes covered above - pipeline, funnel, forecasting, win-loss, conversation intelligence, activity, performance, territory, cohort, and prescriptive - to get actionable insights.
Which type of sales analytics should I start with?
Pipeline, funnel/conversion, and activity analytics. These three answer the essential questions: do we have enough pipeline, where are deals leaking, and are reps doing the right activities at the right volume? Most teams that skip straight to predictive models regret it.
How do I improve sales forecast accuracy?
Move from spreadsheet roll-ups to AI-assisted forecasting. Teams using predictive tools report variance improvements from 12-15% down to 3-5%. Clean, regularly refreshed data is the prerequisite - automated enrichment tools can handle that hygiene at scale.
Why is CRM data quality critical for sales analytics?
Every metric you calculate is only as reliable as the data feeding it. With 91% of CRM data incomplete and 70% decaying annually, a pipeline coverage ratio built on stale contacts and outdated deal stages is meaningless. Automated enrichment and regular data hygiene aren't optional.
What's the difference between win rate and win-loss ratio?
Win rate = wins divided by total opportunities, including no-decisions. Win-loss ratio = wins divided by losses only, excluding stalled deals. Use both: win rate measures overall pipeline efficiency, while win-loss ratio isolates competitive performance against vendors you actually faced.