12 Types of Sales Reports (With Formulas, Benchmarks & Templates)
Most Sales Reports Are Useless
[69% of B2B reps missed quota](https://www.globenewswire.com/news-release/2020/07/27/2067906/0/en/Study-Finds-69-of-B2B-Salespeople-Do-Not-Have-Enough-Leads-in-Their-Pipeline-to-Meet-Sales-Quota.html) last year. Meanwhile, reps spend 60% of their time on non-selling tasks - updating CRMs, formatting spreadsheets, building reports nobody reads. And [57% of sales pros say the cycle is getting longer](https://www.salesforce.com/sales/state-of-sales/), which means the reports you do build need to be sharper than ever.
The problem isn't a lack of data. It's that most sales teams drown in reports tracking activity without connecting it to revenue. A 47-tab spreadsheet with call counts by hour isn't a report. It's a surveillance system. Understanding the right types of sales reports - and which ones your team actually needs - is the fix.
What You Need (Quick Version)
If you're building your first reporting framework, start with three reports:
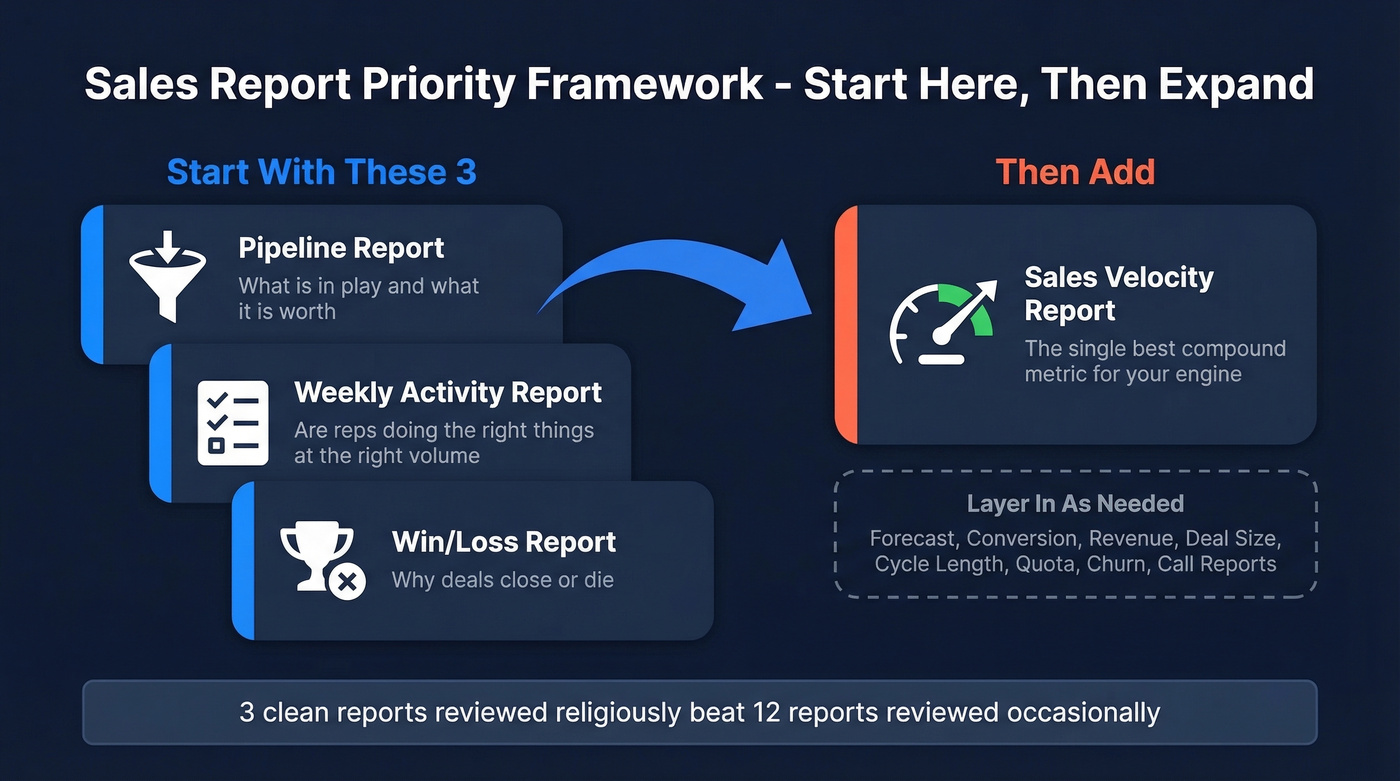
- Pipeline report - what's in play and what it's worth
- Weekly activity report - are reps doing the right things at the right volume
- Win/loss report - why deals close or die
Once those are running clean, add a sales velocity report. It's the single best compound metric for understanding whether your engine is accelerating or stalling. Everything else on this list is a refinement for your specific business model.
Here's the thing: most teams would get more value from three clean reports reviewed religiously than from twelve reports reviewed occasionally. Build the habit before you build the stack.
The 12 Report Types Your Team Needs
Pipeline Report
Your pipeline report is the foundation. It shows every active deal, its stage, its value, and its probability of closing. Two formulas matter:
- Total pipeline value:
=SUM(deal values) - Weighted pipeline:
=SUM(deal value x probability)
The weighted number is what you actually plan around. You need a minimum of 3x pipeline-to-quota coverage. If your win rate sits below 25%, push that to 4-5x. Review weekly - this is the report your Monday morning should start with.
Sales Forecast Report
A pipeline report shows every active deal. A forecast filters that pipeline to predict what will actually close in a specific period. They're not the same thing, and conflating them is one of the most common reporting mistakes in B2B sales.
Best-in-class forecast accuracy runs 80-90%. Only 7% of teams exceed 90%. Run your forecast weekly for commit calls and monthly for board-level reporting. If your forecast accuracy is below 70%, the most common culprit is sloppy stage definitions - reps are advancing deals that haven't earned the next stage.
Conversion Rate Report
Formula: (conversions / total opportunities) x 100
Benchmarks vary wildly by channel. Meeting-to-opportunity conversion should land between 25-40%. Cold outreach to closed deal? Expect 0.2-2%. [Cold email reply rates run 1-5%], and cold calling connects at roughly 2.3%. That's not a rounding error - cold outbound is a volume game, and your conversion report should reflect that reality rather than hiding it behind averages. Review biweekly at minimum; weekly if you're running high-volume outbound.
Win/Loss Report
Track losses by both value and count - they tell different stories. Losing ten $5K deals to "no decision" is a different problem than losing two $200K deals to a competitor. Average win rates run 20-30%; best-in-class teams hit 35-40%+.
The real value here isn't the number itself. It's the loss reasons. Build a standardized dropdown in your CRM (price, timing, competitor, no decision, champion left) and enforce it. We've seen teams ignore this for quarters and then wonder why their win/loss data is useless - garbage in, garbage out. Review monthly.
Sales Activity Report
This is the daily pulse. Track six KPIs: calls made, deal creation, pipeline generated, lead response time, capacity work rate (unique prospects touched in 30 days), and closed-won revenue.
One benchmark stands above the rest: lead response under 5 minutes drives 8-21x higher conversion, and 35-50% of deals go to the first responder. If your activity report doesn't surface response time, you're missing the single highest-leverage metric for inbound leads.
The other gap worth tracking: [80% of deals require 5+ touches], yet 44% of reps stop after one. Your activity report should surface that persistence gap. Auto-generate this from your CRM - don't make reps build it manually.
Sales Call Report
If your reps are writing nightly call reports at 8 PM, you don't have a reporting process - you have a micromanagement problem. The consensus on r/sales is pretty clear: manual call reports are time-consuming and produce low-quality data that nobody trusts anyway.
Auto-track calls from your dialer or CRM. Review the aggregate weekly. The report should show call volume, connect rate, and outcomes - not a narrative essay about each conversation.
Revenue Report
Most teams already track revenue - the mistake is not slicing it enough. Segment by rep, product line, territory, and channel. A rep hitting quota entirely through one product line is a different story than a rep diversified across three.
Reporting by team reveals whether revenue concentration is a rep-level habit or a territory-level constraint. If you can't answer "where is our revenue actually coming from?" in under 30 seconds, your revenue report needs more dimensions. Review monthly; run quarterly analysis for territory and channel trends.
Average Deal Size Report
Formula: =AVERAGEIF(stage,"Closed-Won",deal_value)
This report catches two problems early: pricing drift (deals getting smaller because reps are discounting to close) and market shift (your ICP is changing and you haven't noticed). If average deal size drops 15%+ quarter-over-quarter, something structural is happening. Skip this one if you're pre-revenue or selling a single SKU at a fixed price - it won't tell you anything useful yet. Review monthly or quarterly.
Sales Cycle Length Report
Formula: =AVERAGE(close_date - creation_date)
With 57% of sales pros reporting longer cycles, this metric matters more than ever. Track it by segment, deal size, and lead source. Enterprise deals taking 120 days isn't alarming - but if your SMB cycle creeps from 21 to 45 days, your qualification process is broken. Review monthly; run quarterly trend analysis.
Sales Velocity Report
Formula: (opportunities x avg deal size x win rate) / avg sales cycle length

This is one of the most underrated compound metrics in sales reporting. Velocity tells you how much revenue your pipeline generates per day - the one number that connects activity to outcome in a single figure. In our experience, it's the report that gets the most "aha" moments from leadership teams seeing it for the first time.
Improving any of the four inputs improves velocity. More opportunities, bigger deals, higher win rates, or shorter cycles - pick the lever with the most room and focus there. Review monthly.
Quota Attainment Report
Formula: (actual revenue / quota) x 100
With 69% of B2B reps missing quota, this report is less about celebration and more about diagnosis. Segment by rep, team, and territory. Look for patterns - if an entire territory is underperforming, the problem isn't the reps. Review monthly with a quarterly rollup.
Churn / Retention Report
For SaaS or any subscription model, this report is non-negotiable. Track churn by cohort, reason, and revenue impact. A single-digit monthly logo churn rate can look manageable until you realize it's concentrated in your highest-value segment.
Build this monthly. Include both logo churn (accounts lost) and revenue churn (dollars lost) - they diverge more than you'd expect.
Your conversion rate report will always look broken if you're reaching the wrong people with bad data. Prospeo's 300M+ verified profiles and 98% email accuracy mean every metric in your pipeline report reflects real opportunities - not bounced emails and dead contacts.
Clean data in, clean reports out. Start with 75 free emails.
Templates for Common Report Types
Here are the column structures for the three most common sales reports, adapted from Smartsheet's downloadable templates and Livespace's pipeline formulas for what actually works in practice.
| Column | Pipeline | Weekly Activity | Monthly Dashboard |
|---|---|---|---|
| Row unit | Deal | Rep (per day) | Rep (monthly) |
| Col 1 | Deal name + stage | Calls made | Lead conversion rate |
| Col 2 | Value + probability | Leads generated | Outbound calls |
| Col 3 | Expected revenue | Deals closed | Revenue vs goal |
| Col 4 | Closing date | Revenue closed | Win rate |
| Cadence | Weekly | Weekly | Monthly |
The pipeline template should calculate weighted value automatically. The weekly activity template needs variance columns - target vs. actual for each metric. The monthly dashboard should chart lead-to-opportunity and opportunity-to-win ratios over time.
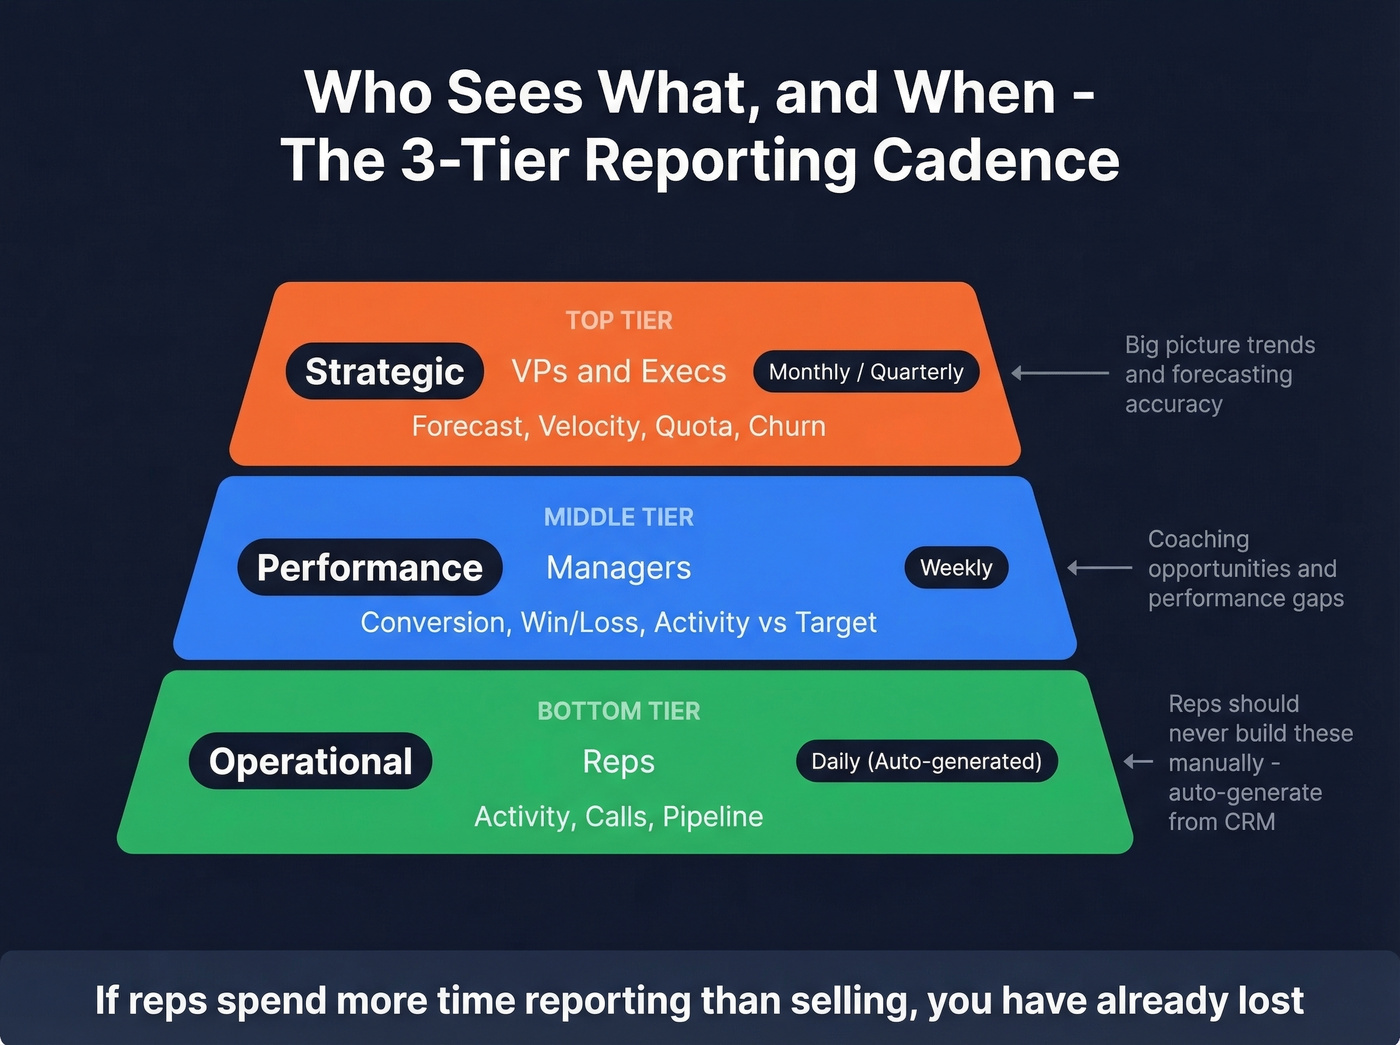
Who Sees What, and When
Not every report goes to every person. Here's the three-tier cadence framework that keeps reporting useful without creating noise:
| Tier | Audience | Reports | Cadence |
|---|---|---|---|
| Operational | Reps | Activity, calls, pipeline | Daily (auto) |
| Performance | Managers | Conversion, win/loss, activity vs target | Weekly |
| Strategic | VPs / Execs | Forecast, velocity, quota, churn | Monthly / Quarterly |
Reps should never build their own daily reports. Auto-generate from CRM data. Manager-level reporting should focus on the performance tier - reviewing conversion and win/loss data weekly and flagging coaching opportunities. Execs get the strategic view monthly: forecast accuracy, velocity trends, and quota attainment across the org.
Let's be honest - if your reps spend more time reporting on selling than actually selling, you've already lost.
5 Reporting Mistakes That Kill Accuracy
1. Leading with vanity metrics. Total emails sent isn't a KPI. Pipeline created is. Replace every vanity metric with the business outcome it's supposed to drive.
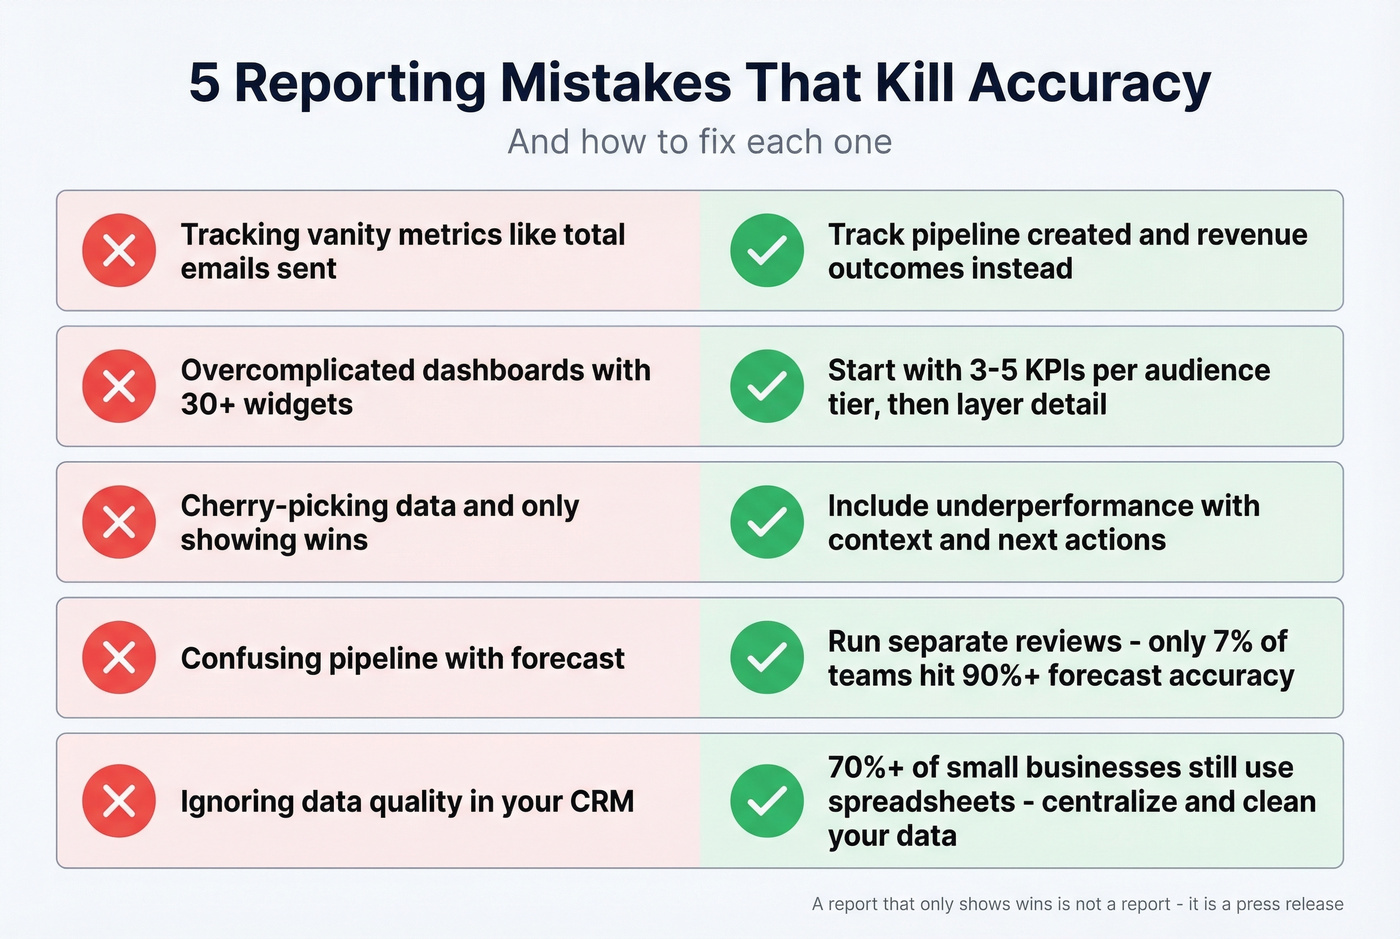
2. Overcomplicated dashboards. Start with 3-5 KPIs per audience tier, then layer detail for people who want to drill down. A 30-widget dashboard helps nobody.
3. Cherry-picking data. Include underperformance with context and next actions. A report that only shows wins isn't a report - it's a press release.
4. Confusing pipeline with forecast. Only 7% of teams achieve above 90% forecast accuracy, and the most common reason is treating pipeline as forecast. Run separate reviews for each.
5. Ignoring data quality. 70%+ of small businesses still rely on spreadsheets or notebooks for sales tracking. Even teams using CRMs rarely audit for duplicates, inconsistent naming, or fields that haven't been updated in months. Your reports are only as accurate as the records they pull from.
Fix Your Data First
Every formula and benchmark above becomes fiction if your underlying data is stale. CRM records decay fast - contacts change roles, emails bounce, phone numbers go dead. And 74% of sales teams using AI are prioritizing data hygiene specifically because their models break on bad inputs.
Prospeo's 7-day data refresh cycle and 98% email accuracy catch stale contacts before they corrupt your pipeline report or inflate your forecast. Native Salesforce and HubSpot integrations mean enrichment runs in the background, not as a quarterly fire drill. When you build reports on top of clean, continuously enriched data, every metric - from velocity to quota attainment - reflects reality instead of wishful thinking.
Reports built on decaying data create false confidence. That's how you walk into a board meeting promising $2M and delivering $1.2M.
Sales velocity depends on four inputs - and bad contact data quietly destroys all of them. Fewer real opportunities, longer cycles chasing wrong numbers, lower win rates from never reaching decision-makers. Prospeo refreshes 300M+ profiles every 7 days so your reports track revenue, not decay.
Stop reporting on stale data. Every metric improves when contacts are real.
FAQ
What should a weekly sales report include?
Track six metrics: calls made, deals created, pipeline generated, lead response time, capacity work rate, and closed-won revenue. Pull these from your CRM automatically - never make reps build the report manually. The goal is a focused snapshot that surfaces gaps, not a data dump.
What's the difference between a pipeline report and a forecast?
A pipeline report shows every active deal and its weighted value. A forecast filters that pipeline to predict what will actually close in a specific period. Teams that conflate the two typically see forecast accuracy below 70%. Run separate reviews for each.
How do you keep sales report data accurate?
Automate data hygiene with a tool that refreshes records on a regular cycle. CRM contacts decay within weeks as people change roles and emails bounce. Pair that with enforced naming conventions and quarterly deduplication, and your reports will actually mean something.
How often should sales reports be reviewed?
Reps need daily activity data auto-generated from the CRM. Managers should review conversion and win/loss reports weekly. Execs review forecasts, velocity, and quota attainment monthly or quarterly. Match cadence to audience - the tier framework above maps each report to its ideal frequency.
What's the single most important sales report?
The pipeline report - it's the foundation everything else builds on. But if you want the single most insightful metric, sales velocity wins. It combines four inputs (opportunities, deal size, win rate, cycle length) into one number that tells you whether your revenue engine is accelerating or stalling.