How to Analyze Bounce Rate in GA4 (Not Just Define It)
Your CMO just asked why the website bounce rate is 55%. You open GA4 and realize bounce rate isn't even in the default dashboard. Every article you find defines what bounce rate is - as if that's the hard part. It's not. The hard part is figuring out why it's high, where it matters, and what to do about it.
That's what real bounce rate analysis looks like. GA4 now runs on roughly 14.2 million websites, and most teams still haven't configured bounce rate reporting properly.
The Quick Version
GA4 bounce rate = 100% minus engagement rate. The default 10-second engagement timer is almost certainly too low for content-heavy sites - 30 seconds is a strong starting point. Then stop looking at sitewide bounce rate and start segmenting by channel, device, and landing page. That's where the actual insights live.
Website vs. Email Bounce Rate
"Bounce rate" means two completely different things depending on whether you're in analytics or email ops.
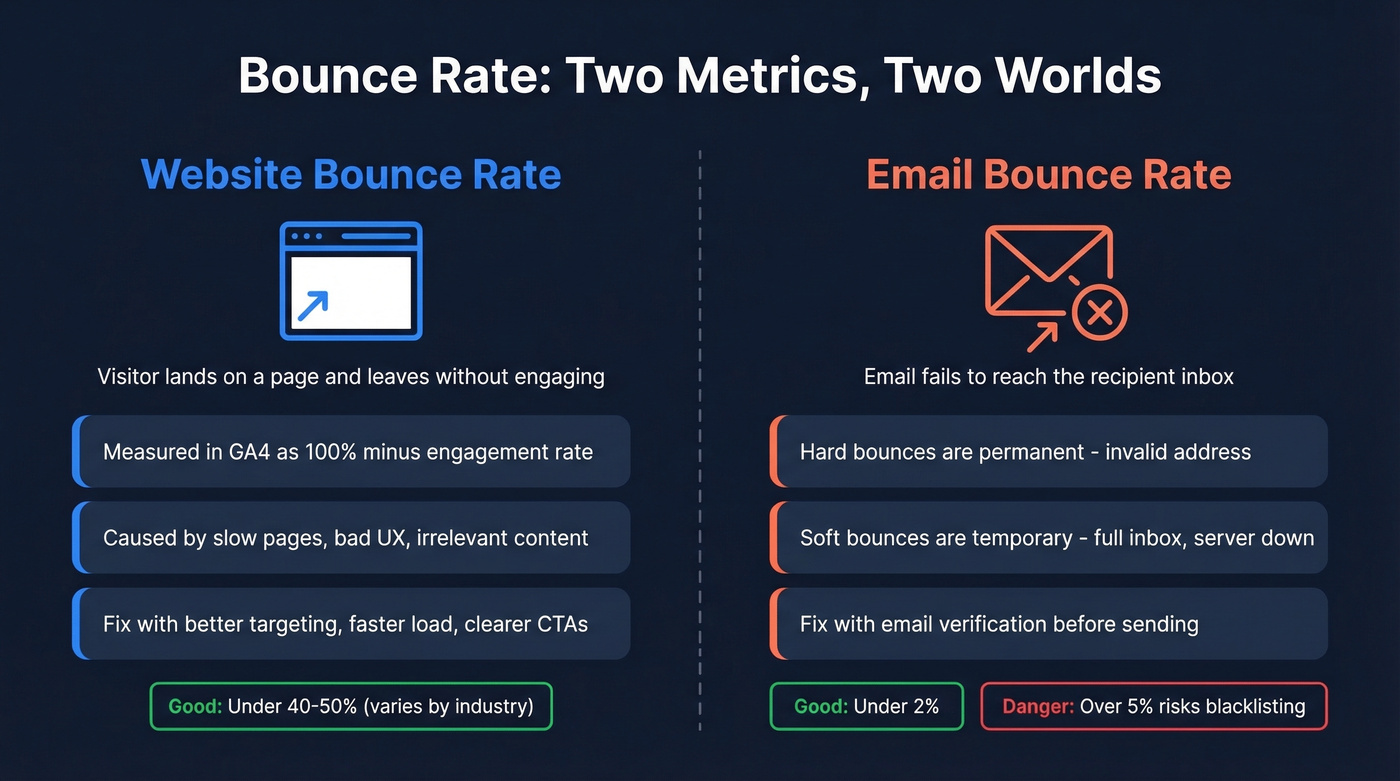
Email bounce rate is the percentage of emails that fail to reach inboxes. Hard bounces mean permanently invalid addresses; soft bounces are temporary failures like full inboxes or server timeouts. Under 2% is excellent, 2-5% needs attention, and over 5% puts your domain at risk of blacklisting. Proper email bounce management starts before you ever hit send - tools like Prospeo's email verification catch invalid addresses, spam traps, and honeypots before they tank your sender reputation. Snyk's team cut their email bounce rate from 35-40% down to under 5% after switching to verified lists.
The rest of this article focuses on the website side.
How GA4 Defines Bounce Rate
GA4 completely rewired how bounce rate works compared to Universal Analytics. In UA, a bounce was simply a single-page session - visitor lands, doesn't click anything, leaves. A reader who spent 20 minutes absorbing your best blog post counted as a bounce. That was always a flawed measurement.
GA4 flipped the logic. Instead of tracking bounces directly, it tracks engaged sessions and derives the metric from there. A session counts as engaged if it meets any of three criteria: the visitor stays longer than 10 seconds, views 2+ pages, or triggers a key event. Bounce rate = 100% - engagement rate.
GA4 numbers can differ significantly from UA - sometimes higher, sometimes lower - because the definitions are fundamentally different. If your rate "changed" after migrating to GA4, don't compare the two directly. They're measuring different things entirely.
Customizing the Engagement Timer
If you haven't changed the default 10-second timer, your data is lying to you. Ten seconds is nothing on a content-heavy page where readers scroll for minutes.
Go to Admin > Data Streams > your stream > Configure tag settings > (Show more) > Adjust session timeout (menu labels vary slightly by GA4 version). Set the engaged-session threshold to 30 seconds. For many content sites, that's the sweet spot - it filters out genuine bounces while keeping real readers from being miscounted. In our experience, this single change often drops reported bounce rates by 5-15 points. Do it before you analyze anything else.
Benchmarks by Industry
A "good" bounce rate depends entirely on page type and intent. 70% on a FAQ page is success - the visitor got their answer. 70% on a pricing page is a fire alarm.
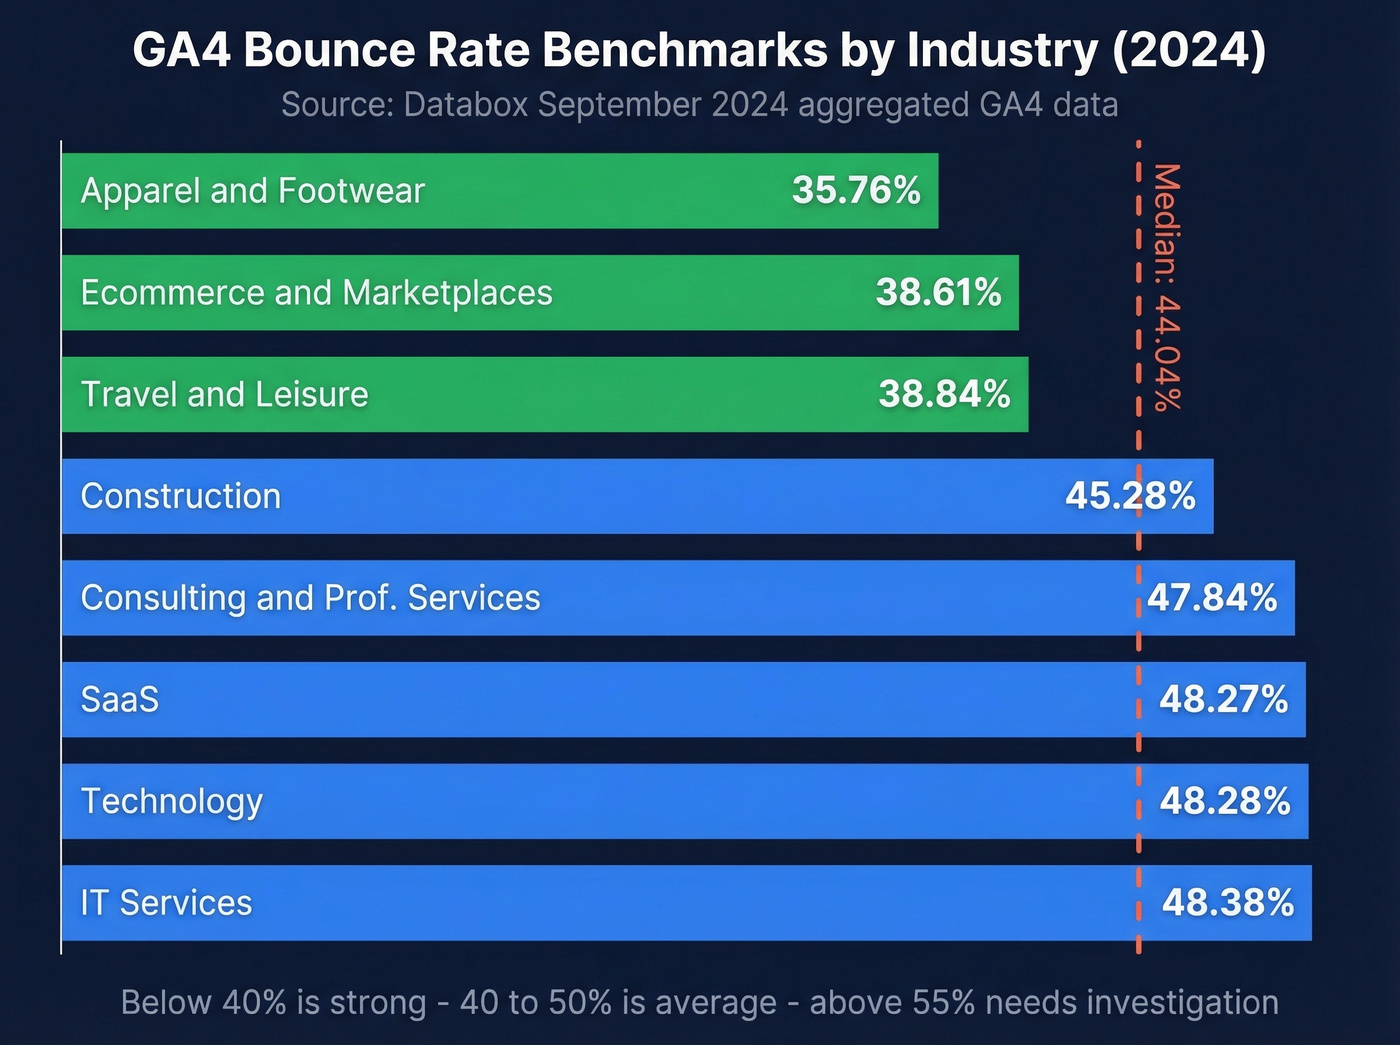
That said, you need a baseline. Databox's September 2024 GA4 benchmarks give us the best current dataset:
| Industry | GA4 Bounce Rate |
|---|---|
| Apparel & Footwear | 35.76% |
| Ecommerce & Marketplaces | 38.61% |
| Travel & Leisure | 38.84% |
| Construction | 45.28% |
| Consulting & Prof. Services | 47.84% |
| SaaS | 48.27% |
| Technology | 48.28% |
| IT Services | 48.38% |
| Median (all industries) | 44.04% |
A 2023 HubSpot survey of 336 marketers reported an average of 37%. HubSpot's sample was self-reporting marketers, so it's useful directionally but less reliable than Databox's aggregated GA4 data. The gap between 37% and 44% likely reflects GA4's engagement-based definition versus older UA-era self-reporting.
If you're in SaaS and sitting at 48%, you're dead average. At 60%, something's off - and the next section shows you how to find it.
Website bounce rate hurts conversions. Email bounce rate kills your domain. Prospeo's 5-step verification catches invalid addresses, spam traps, and honeypots before you send - delivering 98% email accuracy at $0.01 per lead.
Stop diagnosing bounces after the damage is done. Prevent them.
Step-by-Step Analysis in GA4
Adding Bounce Rate to Reports
GA4 doesn't show bounce rate by default. Open the Traffic Acquisition report (Life Cycle > Acquisition), click the pencil icon to customize, add "Bounce rate" as a metric, and save. Now you can see it by channel grouping - organic, paid, direct, referral, email - without building a custom exploration.
If you have the Landing page report published in your GA4 Reports (often under Engagement), customize it the same way. That's where the real insights start showing up.
Building a Diagnostic Exploration
Standard reports give you the overview. Explorations give you depth.
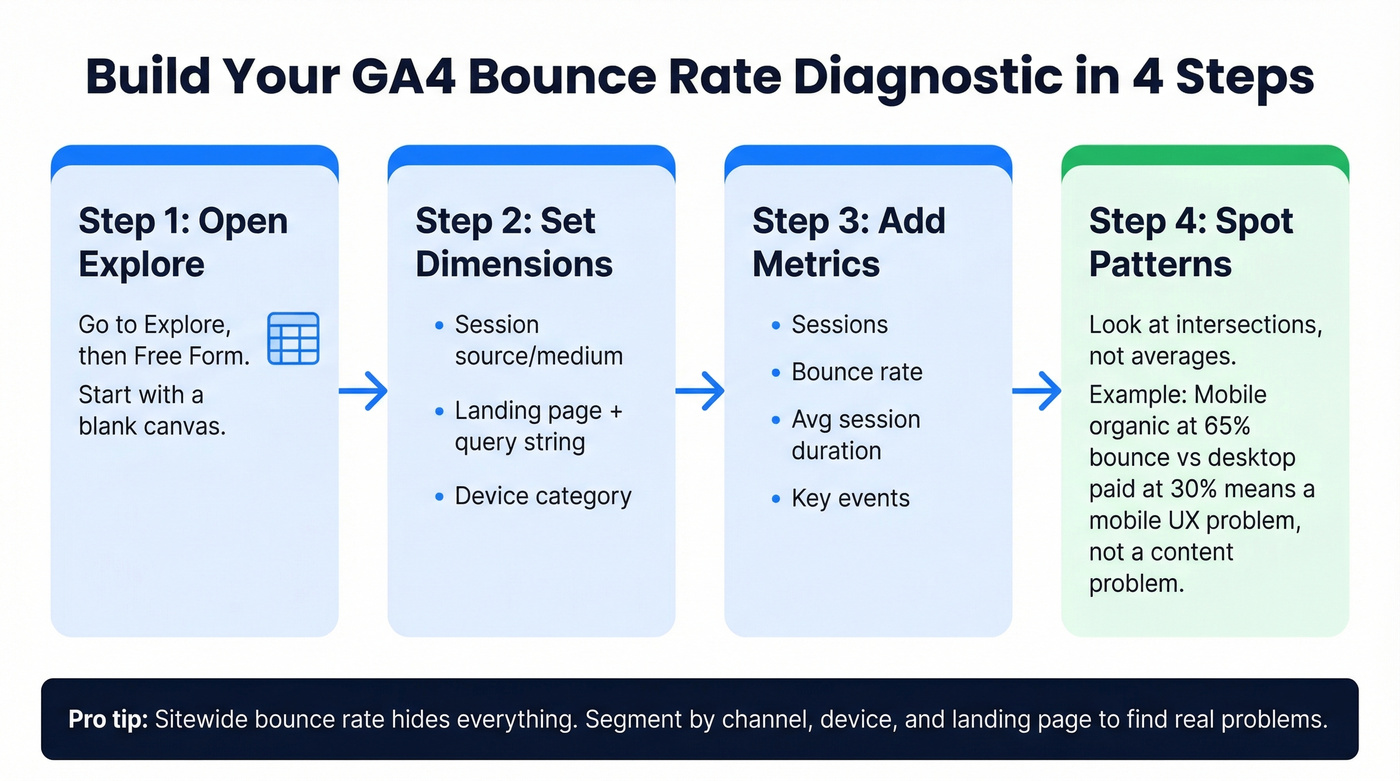
Go to Explore > Free Form. Set your dimensions: Session source/medium, Landing page + query string, Device category. For metrics, pull in Sessions, Bounce rate, Average session duration, and Key events. This gives you a matrix where you can spot patterns - maybe mobile organic traffic bounces at 65% while desktop paid bounces at 30%. That's a mobile UX problem, not a content problem. We've found that the exploration view is where most "aha" moments happen, because it forces you to look at intersections rather than averages.
Segmenting Bounced vs. Engaged Sessions
Sitewide bounce rate is nearly useless as a diagnostic metric. You need to segment.
Break your data by channel, device, landing page, and new vs. returning visitors. A common confusion on r/GoogleAnalytics: reports show high average session duration and high bounce rate simultaneously. This isn't a bug. A small number of deeply engaged sessions pull the average duration up while the majority are sub-10-second bounces. Segmenting reveals this - averages hide it.
Diagnosing Anomalies
Here's the thing: comparing bounce rates across different analytics platforms is the single biggest time-waster in web analytics. Pick one source of truth and stick with it.
A textbook example showed up on Reddit - a Shopify store owner saw their GA4 bounce rate spike from ~10% to ~60% around June 2024, while Shopify's own analytics stayed steady at 60-70%. The culprit wasn't a traffic problem. It was a measurement problem - the pre-June numbers were likely using a different engagement definition, and the "spike" was GA4 recalibrating to its true engaged-session logic. We've seen teams waste weeks chasing phantom spikes like this. Don't do it.
Another common trap: denominator confusion at the page level. In UA, page bounce rate was Bounces / Entrances. In GA4, the metric is tied to sessions that include the page, which can understate the true landing-page rate when most sessions merely pass through. One analyst proposed a workaround: (Sessions x Bounce Rate) / Entrances to normalize back to an entrance-based metric. It's not official GA4 math, but it's a useful diagnostic lens.
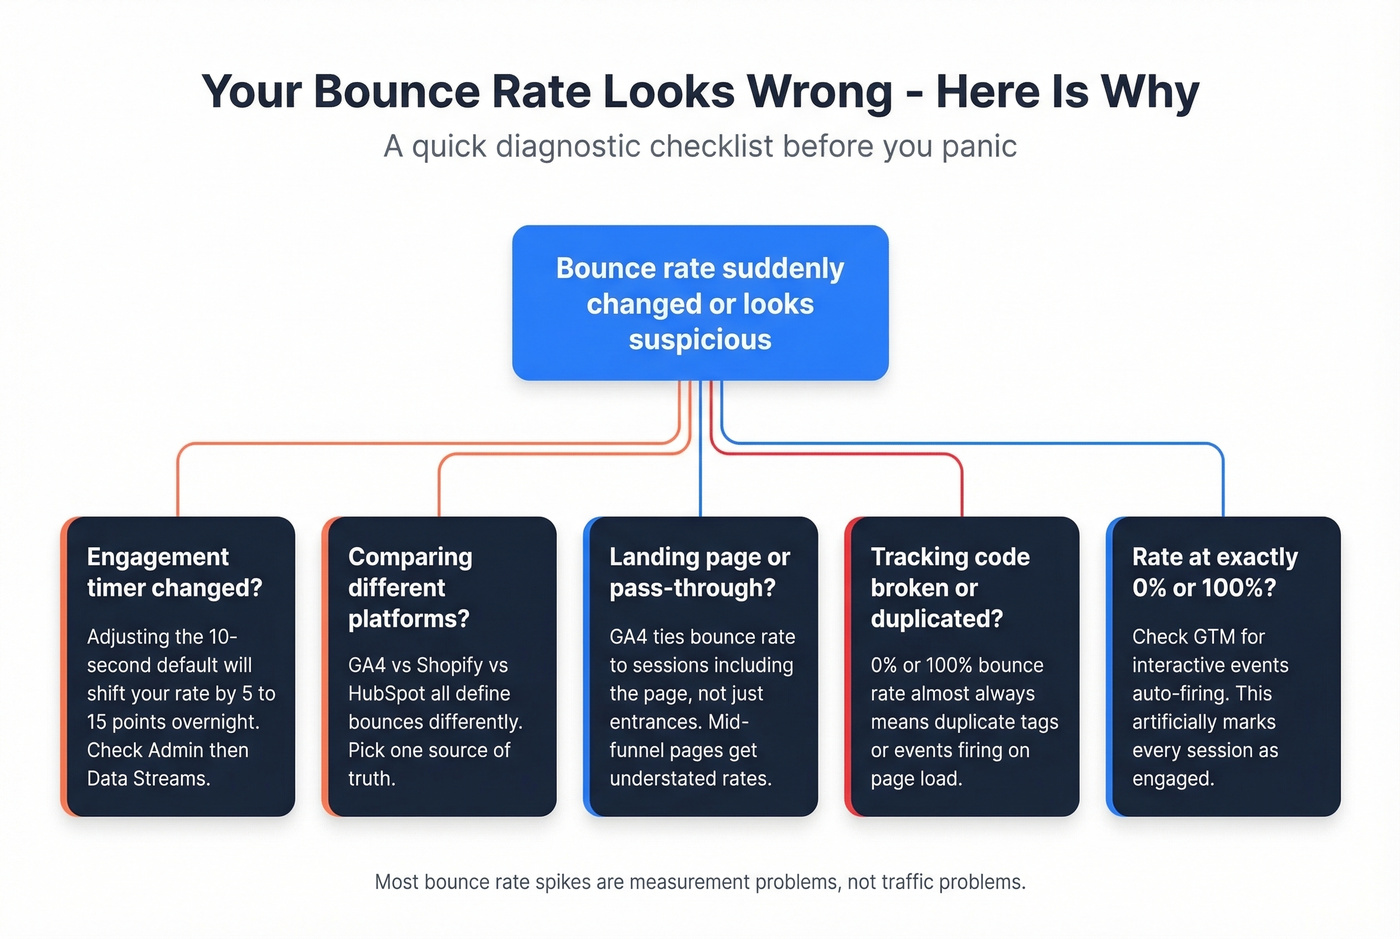
Quick diagnostic checklist when numbers look wrong:
- Did you recently change the engagement timer?
- Are you comparing GA4 to a platform with a different definition?
- Is the page primarily a landing page or a mid-funnel pass-through?
- Did tracking code change, break, or get duplicated?
- Is your rate at 0% or 100%? That almost always means duplicate tracking code or interactive events firing on page load.
Making Your Data More Accurate
The single most impactful thing you can do beyond the timer change: set up scroll depth and timed engagement events in GTM. Takes 15 minutes. Changes everything.
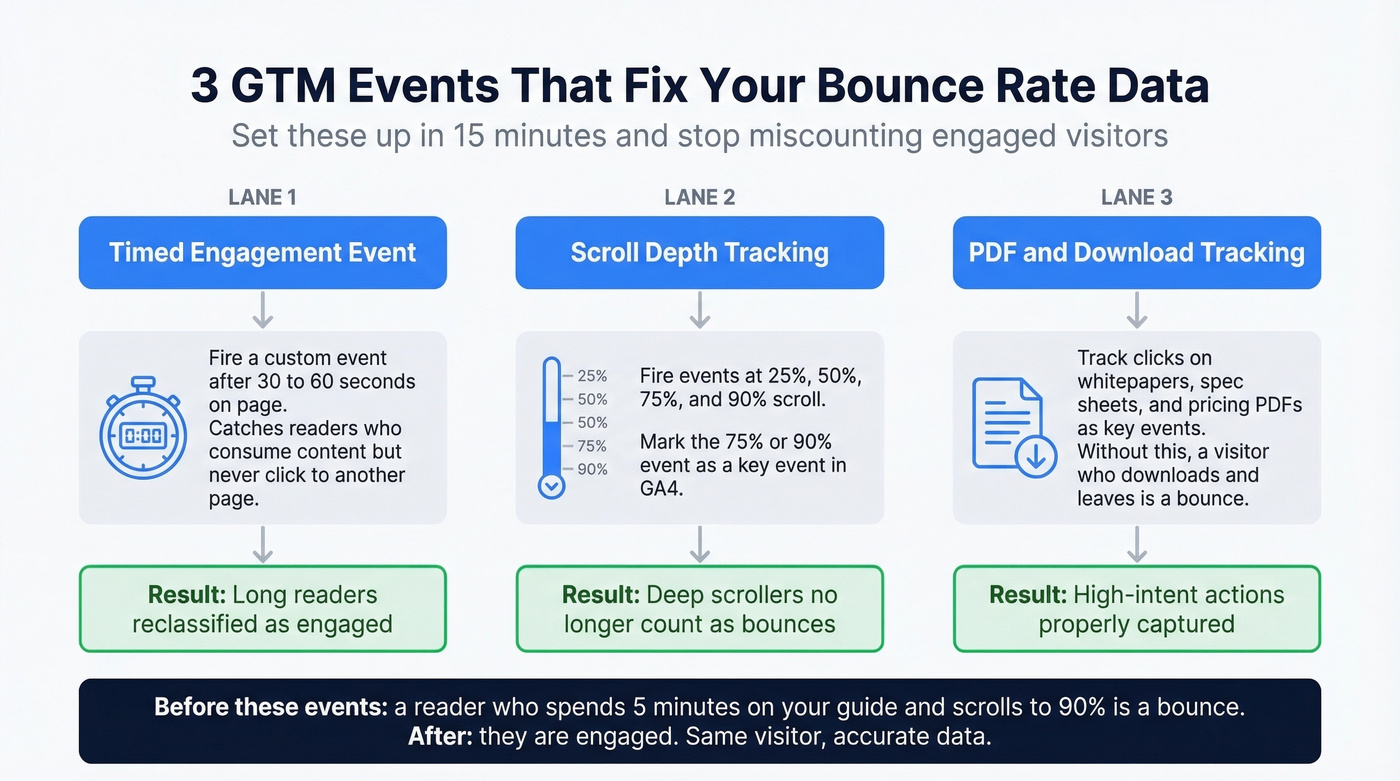
GA4 counts a session as engaged based on time, pageviews, or key events. If someone reads your entire 2,000-word guide, scrolls to 90%, but never clicks another page and leaves before the timer fires - that's a "bounce." That's wrong, and you can fix it.
Set up these events in Google Tag Manager:
- Timed engagement event - fire a custom event after 30-60 seconds on page. This reclassifies long readers as engaged.
- Scroll depth tracking - fire events at 25%, 50%, 75%, and 90% scroll thresholds. Mark the 75% or 90% event as a key event in GA4.
- PDF/download tracking - if you offer whitepapers or spec sheets, track those clicks as key events. Without this, a visitor who downloads your pricing PDF and leaves is counted as a bounce.
Some analysts take this further with a "time-adjusted bounce rate" - excluding all sessions under 10-15 seconds as a cleaner engagement proxy. It's a useful lens when you want to separate genuine disinterest from measurement noise.
Each of these reclassifies sessions that look like bounces into engaged sessions, giving you a metric that actually reflects user behavior.
Tools for Bounce Rate Analysis
GA4 is the default, but it's not the only option - especially if you need session-level detail or privacy-first tracking.
| Tool | Session Logs | Privacy-First | Price |
|---|---|---|---|
| GA4 | No | No | Free |
| Clicky | Yes | No | $9.99/mo |
| Matomo | Yes | Yes | Free / $42/mo cloud |
| Plausible | No | Yes | $29/mo |
| Fathom | No | Yes | $15/mo |
| Hotjar/FullStory | Yes | No | $39-99+/mo |
Clicky is the standout for session-level debugging. You can watch an individual visitor's path and see exactly where they dropped - hard to beat at $9.99/mo for up to 1M pageviews. Matomo is the pick for self-hosted, privacy-compliant analytics with full reporting. Plausible and Fathom are lightweight, cookie-free options for GDPR-sensitive sites, though you sacrifice session-level granularity.
Skip Hotjar and FullStory if you just need bounce rate numbers - they don't replace your analytics tool. But when you've identified a high-bounce page in GA4, drop in a heatmap or session replay to see what visitors actually do before they leave. That combination is where the real diagnostic power sits.
How to Reduce Bounce Rate
Let's be honest: stop trying to "reduce" your bounce rate as a goal. Start trying to understand it. A high rate is a symptom, not a disease. If you're closing deals and getting the right people to the right pages, a 50% bounce rate might be perfectly fine.
That said, once you've diagnosed the cause, here are the levers that actually move the needle.
Page speed is the most common culprit. If your page takes 4+ seconds to load, visitors leave before they engage. Check Core Web Vitals and fix the biggest bottlenecks first. Content-intent matching is next: if someone searches "GA4 bounce rate benchmarks" and lands on a page about website design, they're gone in seconds. Audit your top landing pages against the search queries driving traffic to them.
Give visitors a clear next step with strong internal linking - related articles, deeper guides, product pages. Reduce dead ends. If your mobile bounce rate is 15+ points higher than desktop, your responsive design needs work: check font sizes, tap targets, and layout shift. And for teams running outbound campaigns, the quality of your contact data determines who sees your pages in the first place. Sending to unverified lists means lower open rates and less qualified traffic reaching your site - garbage in, garbage out.
If you want a prioritized checklist, use our how to reduce bounce rate guide, then compare your numbers against bounce rate benchmarks to see what’s normal for your category.
Segmenting website bounces is smart. Eliminating email bounces is smarter. Snyk's 50-person sales team went from 35-40% email bounce rates to under 5% and added 200+ opportunities per month - all by switching to Prospeo's verified contact data.
Get the only B2B data refreshed every 7 days, not every 6 weeks.
FAQ
Is Bounce Rate a Google Ranking Factor?
No. Google doesn't use GA4 bounce rate as a direct ranking signal. Matt Cutts explicitly denied it, and Rand Fishkin's experiment on manipulating it produced inconclusive results. Correlation between low bounce rates and high rankings exists because good content satisfies both users and search engines. Optimize for users, not for the metric itself.
What's a Good Bounce Rate for Ecommerce?
Databox's GA4 benchmarks put Ecommerce & Marketplaces at 38.61% and Apparel & Footwear at 35.76%. Under 40% means you're performing well. Above 50% on product or category pages warrants investigation - check page load speed, mobile experience, and whether your traffic sources match buyer intent.
Why Did My Bounce Rate Spike After Switching to GA4?
GA4 uses an engagement-based definition fundamentally different from UA's single-page-session model. A visitor who read for 10 minutes but only viewed one page was "engaged" in UA but counts as a bounce in GA4 unless they hit the engagement timer, viewed 2+ pages, or triggered a key event. Increase your timer to 30 seconds and add scroll/time events for accuracy.
How Is Email Bounce Rate Different from Website Bounce Rate?
Email bounce rate tracks delivery failures - messages rejected by mail servers due to invalid addresses, full inboxes, or blocklisting. Website bounce rate tracks visitor engagement on pages. For email bounces, the fix is list hygiene and verification before you send. For website bounces, the fix is UX, content, and intent alignment. Separate them in reporting - they need different teams and different action plans.
Bounce Rate vs. Exit Rate
Bounce rate measures non-engaged sessions - the visitor arrived, didn't meet GA4's engagement criteria, and left. Exit rate measures the percentage of visitors who left from a specific page, regardless of how many pages they viewed before. A high exit rate on your checkout confirmation page is expected. A high bounce rate on your homepage is a problem. They answer different questions about different behaviors.