Bounce Rate Benchmarks by Industry: 2026 Data You Can Actually Trust
Your CMO drops a message in Slack: "Our bounce rate is 62%. Is that bad?" You open three benchmark articles, and each one gives you different numbers with zero methodology. Half are still citing Universal Analytics data that hasn't been relevant since Google sunset UA in 2023. The other half don't tell you whether they're measuring mobile, desktop, or both.
Here's the thing - finding reliable bounce rate benchmarks by industry shouldn't require cross-referencing a dozen conflicting sources. We've watched teams waste entire sprints optimizing pages that were already performing fine, all because they benchmarked against the wrong numbers. What follows is what the data actually looks like in 2026, where it comes from, and when you should stop worrying about bounce rate entirely.
Quick Reference: 2026 Benchmarks
- Average across all industries: around 45-55% in GA4
- Ecommerce: 20-45% · SaaS: 35-55% · Blogs/Content: 70-90%
- Mobile bounces run ~10 points higher than desktop, and mobile is 64.35% of traffic
- GA4 ≠ Universal Analytics. Old benchmarks from before 2024 aren't comparable. Only use GA4-era data.
- Bounce rate is diagnostic, not a success metric. Engagement rate and conversion rate matter more.
What Bounce Rate Means in GA4
If you're still thinking about bounce rate the way you did in Universal Analytics, stop. GA4 redefined it completely.
In GA4, a bounce is a non-engaged session - the inverse of engagement rate. An engaged session meets any one of three criteria: the user stays for 10+ seconds, views 2+ pages, or triggers a conversion event. If none of those happen, it's a bounce.
That 10-second threshold is configurable up to 60 seconds in your GA4 admin settings. Most teams leave it at the default, which means GA4 reports lower bounce rates than Universal Analytics did for the same traffic. A session where someone reads for 15 seconds and leaves was a bounce in UA. In GA4, it's engaged.
Old benchmarks from the UA era aren't comparable to GA4 numbers. If you're benchmarking against a "2022 industry average," you're comparing apples to engine blocks. Some analysts find GA4's engagement rate overly generous compared to UA's simpler logic, and teams that want UA-style tracking can replicate it via BigQuery - but for most marketers, the GA4 default works as long as you're consistent.
Average Bounce Rate by Industry
The best publicly available benchmark dataset comes from Contentsquare's 2024 Digital Experience Benchmark, referenced by EMARKETER, which analyzed 43+ billion anonymized sessions across 3,590+ websites in 10 industries (Jan 1 - Dec 31, 2023). It's not perfect - it represents Contentsquare clients, which skew toward larger enterprises - but it's the most methodologically rigorous source available.
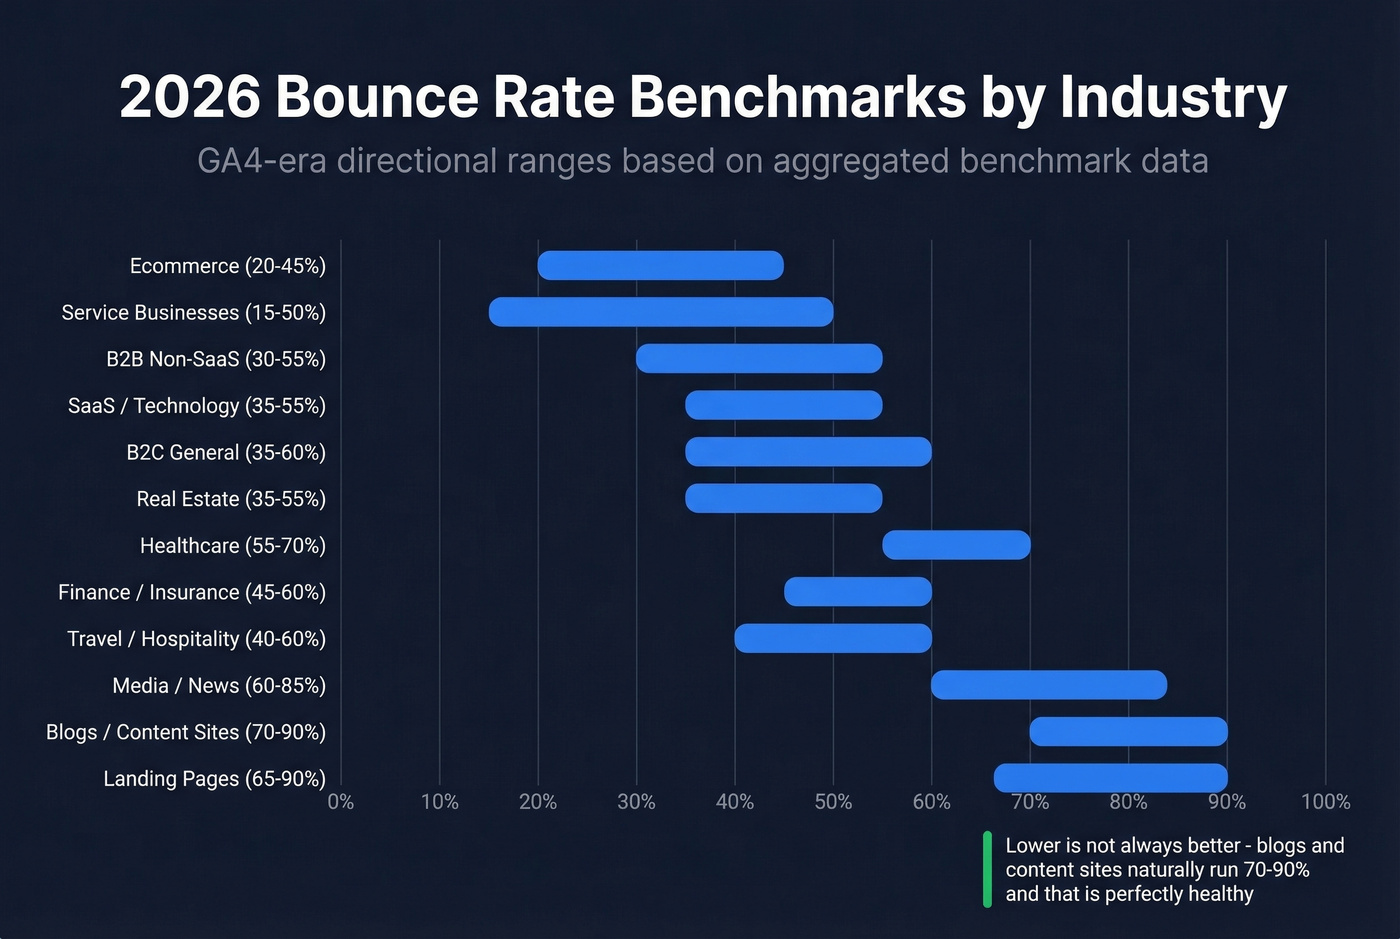
Here are directional ranges based on aggregated GA4-oriented benchmark guides plus widely used industry ranges from analytics publishers:
| Industry | Typical Bounce Rate Range |
|---|---|
| Ecommerce | 20-45% |
| Service Businesses | 15-50% |
| B2B (non-SaaS) | 30-55% |
| SaaS / Technology | 35-55% |
| B2C (general) | 35-60% |
| Real Estate | 35-55% |
| Healthcare | 55-70% |
| Finance / Insurance | 45-60% |
| Travel / Hospitality | 40-60% |
| Media / News | 60-85% |
| Blogs / Content Sites | 70-90% |
| Landing Pages | 65-90% |
Ecommerce and service businesses sit lowest because visitors are actively browsing - clicking through product pages, comparing options. Blogs and media sites sit highest because single-page satisfaction is the norm: someone reads the article and leaves. Neither pattern signals a problem.
Let's be honest: if your average deal size is under five figures and you're spending more than an hour per month analyzing bounce rate instead of conversion rate, you're optimizing the wrong metric. Bounce rate tells you something is happening. Conversion rate tells you whether it matters.
Bounce Rate by Device
In our experience, the device segmentation gap explains more "bounce rate panic" than any other single factor.
| Device | Bounce Rate Range | Traffic Share |
|---|---|---|
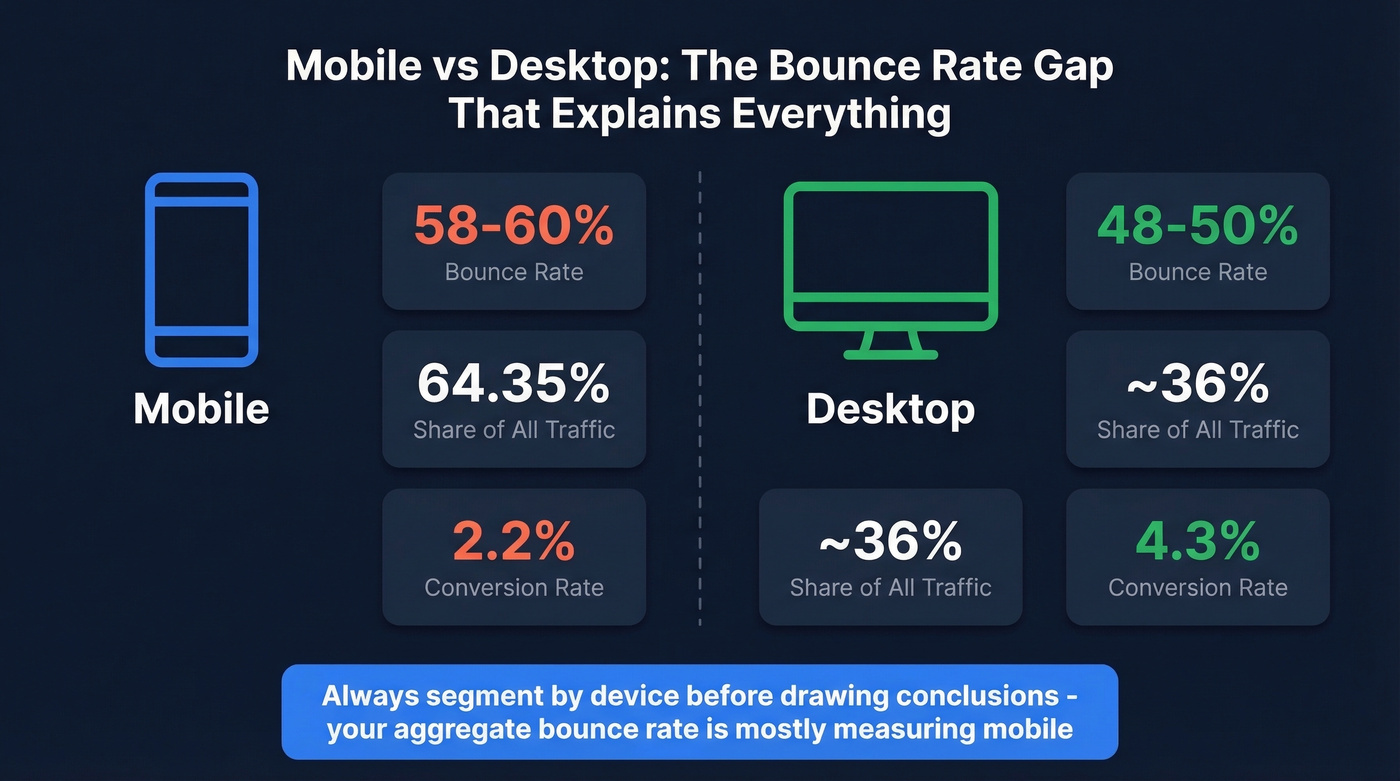
| Mobile | 58.45-60.19% | 64.35% of traffic |
| Desktop | 48.38-50.33% | ~36% of traffic |
Mobile accounts for 64.35% of global website traffic and bounces roughly 10 points higher than desktop. The gap extends beyond bounce rate - mobile converts at roughly 2.2% vs. 4.3% on desktop, making device segmentation essential for any performance analysis.
That means your site-wide bounce rate is heavily weighted toward mobile behavior. If you're only looking at aggregate numbers, you're mostly measuring your mobile experience, and a number that's completely normal for thumb-scrolling visitors on a 6-inch screen.
Always segment by device before drawing conclusions. Without that split, you can't accurately benchmark against industry averages because your aggregate number blends two very different user experiences.
You're reading about website bounce rates, but email bounce rates destroy your domain reputation faster. Teams using bad B2B data see 35-40% email bounce rates. Prospeo's 5-step verification and 7-day data refresh deliver 98% email accuracy - dropping bounce rates to under 4%.
Stop benchmarking. Start sending emails that actually land.
Bounce Rate by Traffic Channel
PPC practitioners on r/PPC consistently ask for channel-specific bounce targets - especially to show clients that a high bounce rate from display ads is a landing-page reality, not automatically a campaign failure. Here's a practical channel breakdown:
| Channel | Typical Bounce Range | Notes |
|---|---|---|
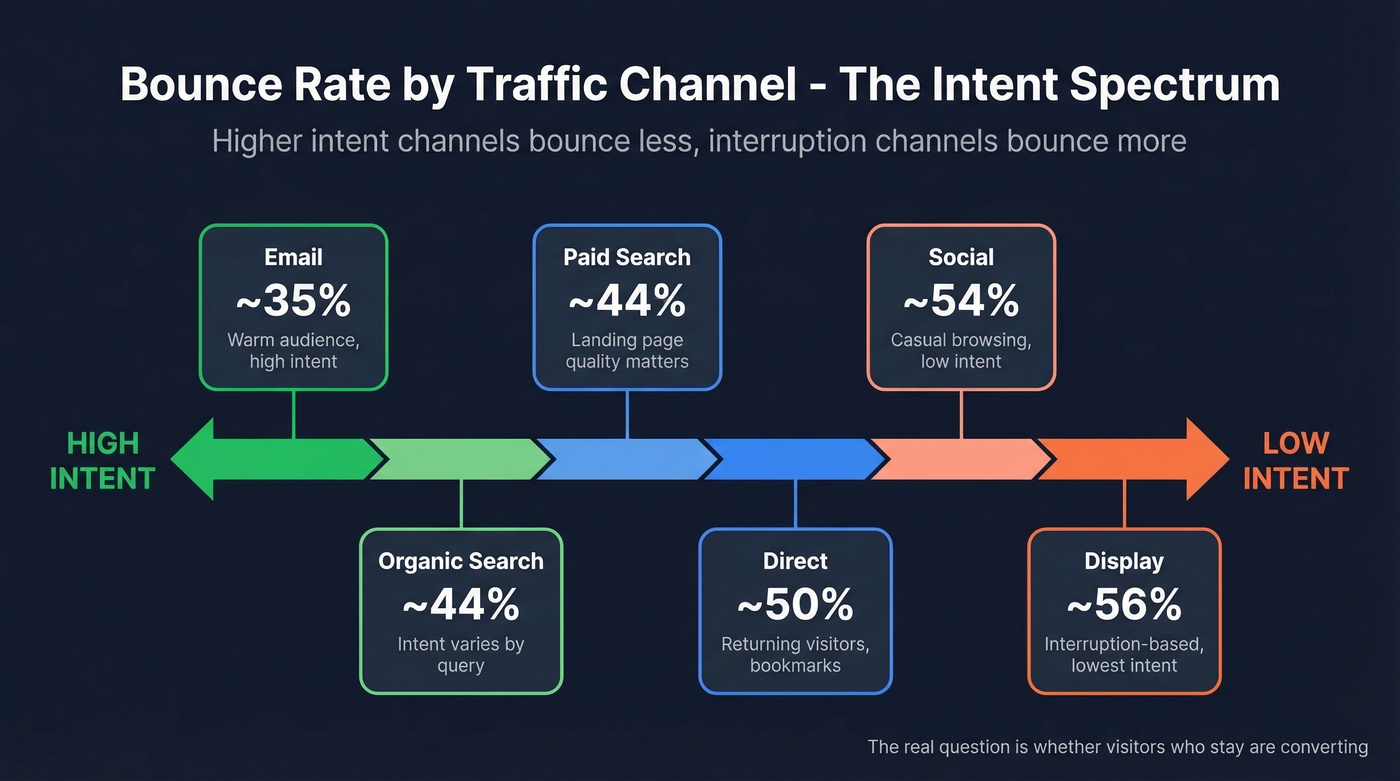
| ~35% | High intent, warm audience | |
| Direct | ~50% | Returning visitors, bookmarks |
| Organic Search | ~44% | Intent varies by query |
| Paid Search | ~44% | Landing page quality matters |
| Social | ~54% | Casual browsing, low intent |
| Display | ~56% | Interruption-based, lowest intent |
The pattern is intuitive: channels with higher user intent bounce less, interruption-based channels bounce more. If your paid social campaigns show high bounce rates, that's not a crisis - it's the channel. The real question is whether the visitors who stay are converting.
When High Bounce Is Fine
Bounce rate is a diagnostic metric, not a success metric. A visitor who spends 20 minutes reading your definitive guide on pricing strategy and then leaves? That's a win. GA4 won't count it as a bounce if they stayed past 10 seconds, but even in UA, that session delivered value.
We've seen B2B SaaS companies with 55% bounce rates that convert at 4x their industry average. The bounce rate looked "bad" on paper; the business was thriving. Comparing your numbers against an industry average only tells part of the story - context around page type, intent, and conversion performance matters far more.
Bounce rate is most meaningful on navigation pages: your homepage, category pages, pricing page. These are pages where you want the visitor to click deeper. A 70% bounce on your homepage is a problem. A 70% bounce on a blog post that answers a specific question? Totally fine. There's also a tracking blind spot worth knowing about: PDF downloads don't trigger analytics events unless you've set up custom tracking. A visitor who downloads your whitepaper and leaves looks like a bounce. Set up event tracking before you trust the numbers.
How to Lower Your Bounce Rate
If your bounce rate genuinely needs work on high-intent pages, here's what to fix first - roughly in order of impact:
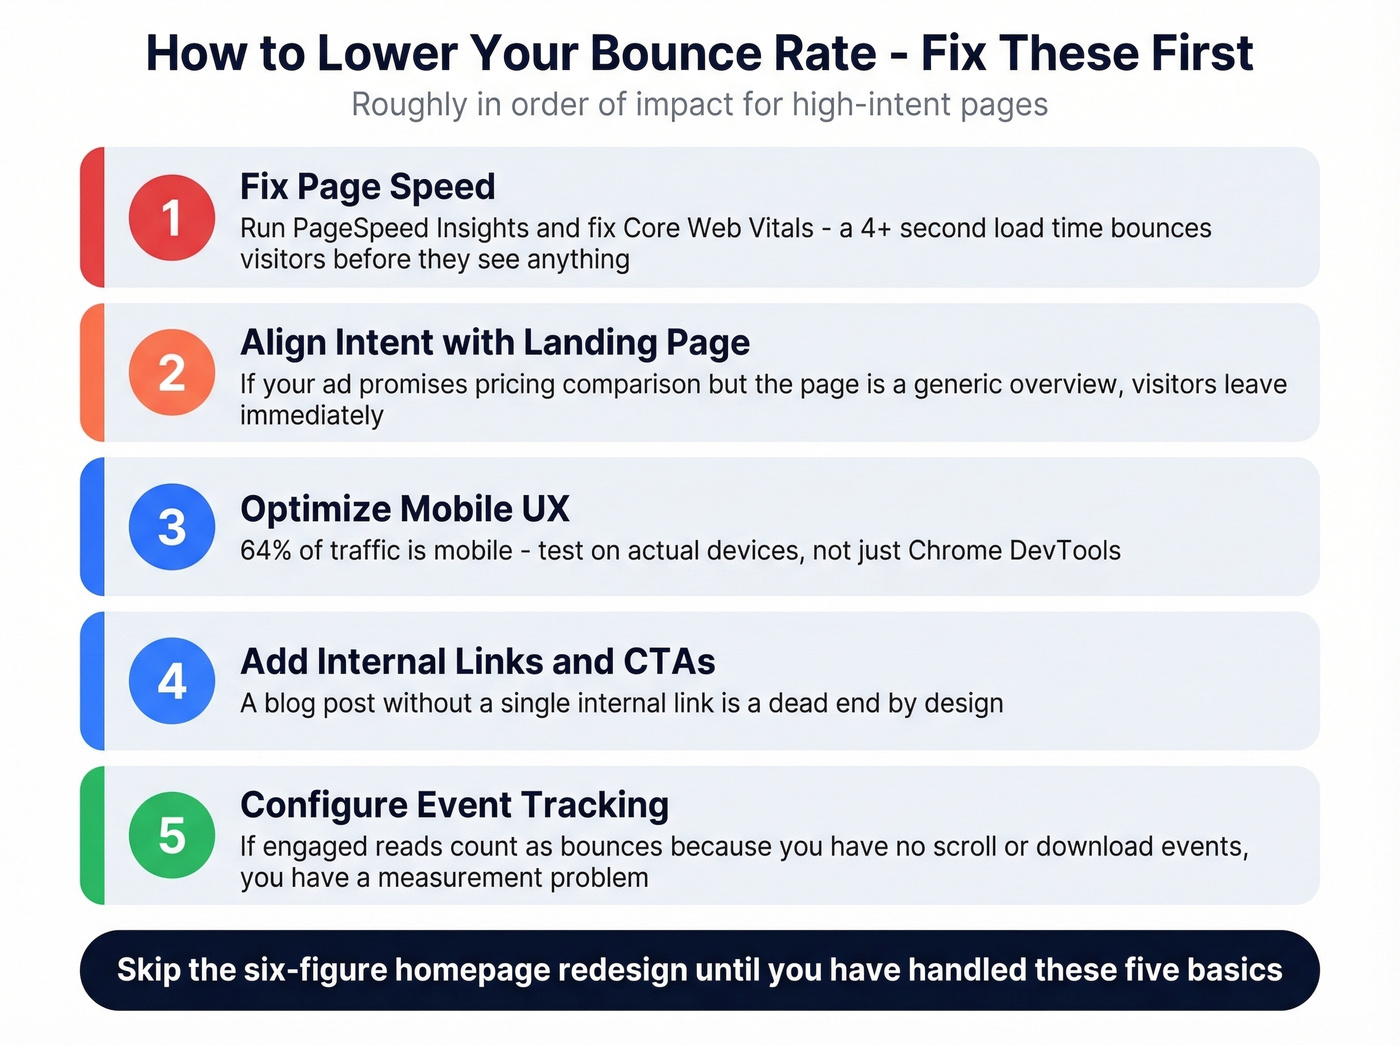
Fix page speed. Run Google PageSpeed Insights and address Core Web Vitals failures. A 4+ second load time bounces visitors before they see your content.
Align intent with landing page. If your ad promises "pricing comparison" and the landing page is a generic product overview, visitors leave. This is the single most common cause of high paid search bounce rates, and it's a content problem, not a traffic problem.
Optimize mobile UX. With 64.35% of traffic on mobile, a desktop-first design guarantees high bounce rates. Test on actual devices, not just Chrome DevTools.
Add internal links and CTAs. A blog post without a single internal link is a dead end by design. Give readers somewhere to go next.
Configure event tracking. If engaged reads count as bounces because you haven't set up scroll depth or download events, you have a measurement problem, not a bounce problem. Google's own GA4 documentation on events walks through the setup.
Skip the "above the fold" redesign projects until you've handled these five. I've seen teams spend six figures on homepage redesigns when the real issue was a 5-second load time from uncompressed images.
Website Bounce Rate vs. Email Bounce Rate
A lot of people searching for bounce rate benchmarks end up on articles about email bounce rate. They're completely different metrics.
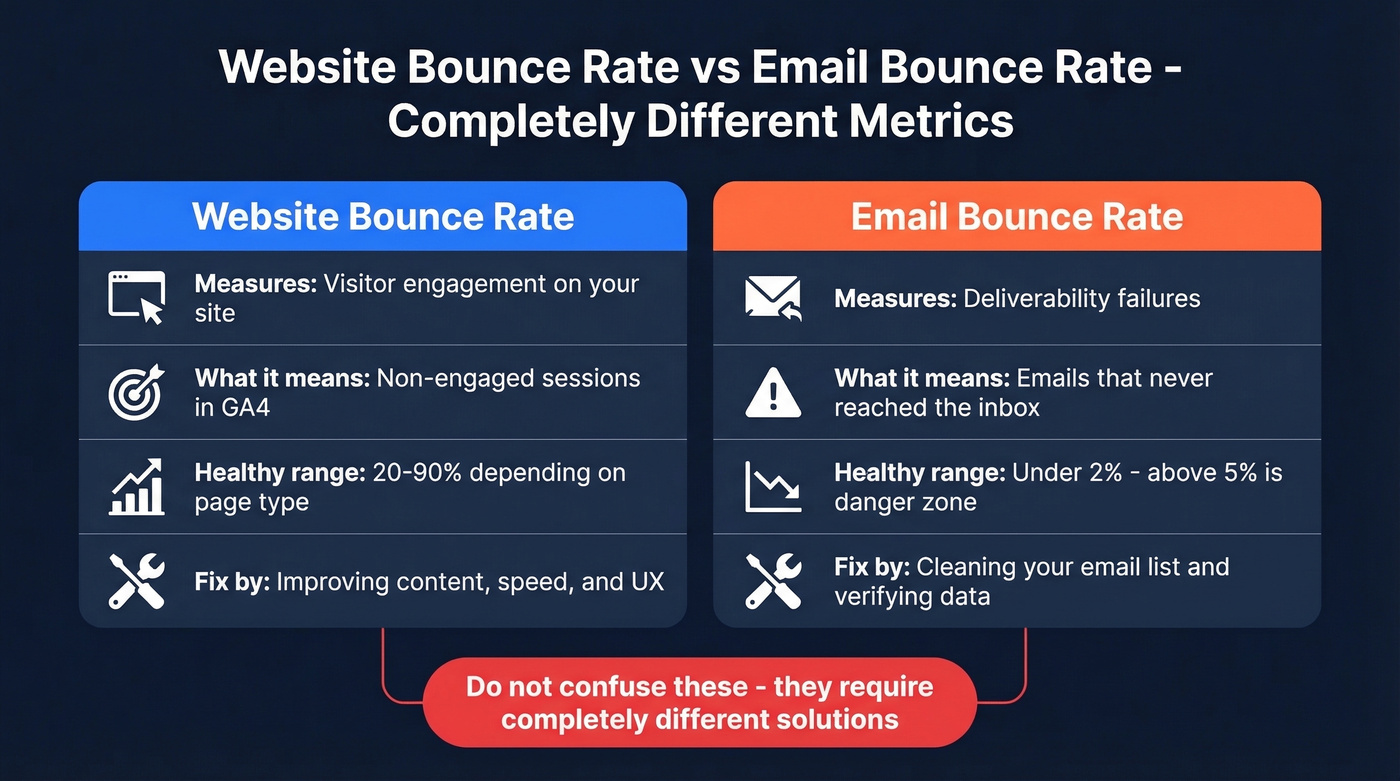
Website bounce rate measures visitor engagement. Email bounce rate measures deliverability failures: hard bounces from invalid addresses, soft bounces from full inboxes or temporary server issues. A healthy email bounce rate sits below 2%. Anything above 5% and you're risking domain reputation damage - Mailchimp's deliverability guide puts the danger zone at the same threshold.
If email bounces are your actual problem, it's a data quality issue, not a content issue. Prospeo's 5-step email verification catches invalid addresses, spam traps, and honeypots before you hit send, with data refreshed every 7 days. Snyk's sales team of 50 AEs dropped their bounce rate from 35-40% to under 5% after switching - that's the difference clean data makes for deliverability.
If you're building outbound as a system (not a one-off campaign), it helps to map bounce rate to the rest of your email deliverability stack and sending limits like email velocity.
Bounce rate is diagnostic, not a success metric - you said it yourself. What matters is reaching real buyers. Prospeo gives you 300M+ verified profiles, 125M+ mobile numbers, and intent data across 15,000 topics so the traffic you drive actually converts.
Reach decision-makers directly for $0.01 per verified email.
FAQ
What's a good bounce rate for my website?
For ecommerce product pages, aim for 20-45%. B2B SaaS homepages typically see 35-55%. Blog content runs 70-90% and that's healthy. Always compare against your own historical data segmented by device and channel - page type matters more than industry vertical.
Is bounce rate a Google ranking factor?
No. Google has confirmed bounce rate isn't a direct ranking factor and doesn't use GA4 data in its ranking algorithms. It's a UX diagnostic useful for improving your site, but it won't move your search rankings on its own.
What's the difference between bounce rate and exit rate?
Bounce rate measures single-page, non-engaged sessions - visitors who arrived and left without meaningful interaction. Exit rate measures the percentage of exits from a specific page, regardless of how many pages the visitor viewed before. Every bounce is an exit, but not every exit is a bounce.
How do I fix a high email bounce rate?
Keep your email bounce rate under 2% by verifying addresses before sending. Tools like Prospeo and NeverBounce catch invalid addresses before they damage your sender reputation. Above 5% bounce, most ESPs start throttling your deliverability.