Bounce Rate: The Practitioner's Guide to Diagnosing and Fixing It
Your CMO pings you on Slack: "Our bounce rate is 68%. That seems bad. Can you look into it?" You pull up GA4, and sure enough - 68% site-wide. But here's what the CMO doesn't see: blog posts are running 82% (normal), the pricing page is at 71% (not normal), and organic traffic bounces 20 points lower than paid social. Site-wide bounce rate is noise. Segmented data is the signal.
Let's break this down properly.
Quick Version
If you're short on time:
- What it is: In GA4, bounce rate is the percentage of sessions that weren't engaged - meaning the visitor spent 10 seconds or less active on the page, viewed only one page/screen, and didn't trigger a key event.
- What's normal: The overall average is around 37%. Blogs typically run 70-90%. Ecommerce sits at 20-45%. SaaS lands between 35-55%.
- What to do: Don't stare at your site-wide number. Segment by page type, traffic source, and device - then fix the outliers.
What Is Bounce Rate?
Bounce rate measures the percentage of sessions where a visitor arrived, didn't engage meaningfully, and left. The formula is straightforward:
Bounce Rate = (Single-page unengaged sessions / Total sessions) x 100
Say your homepage had 1,000 sessions yesterday. Of those, 370 visitors left without being active on the page for more than 10 seconds, viewing another page, or completing any key event. Your homepage bounce rate is 37%.
Simple enough. But the definition of "unengaged" is where things get interesting - and where most people's confusion starts.
How GA4 Calculates It
GA4 flips the calculation. Instead of measuring bounces directly, it measures engagement first, then derives the inverse.
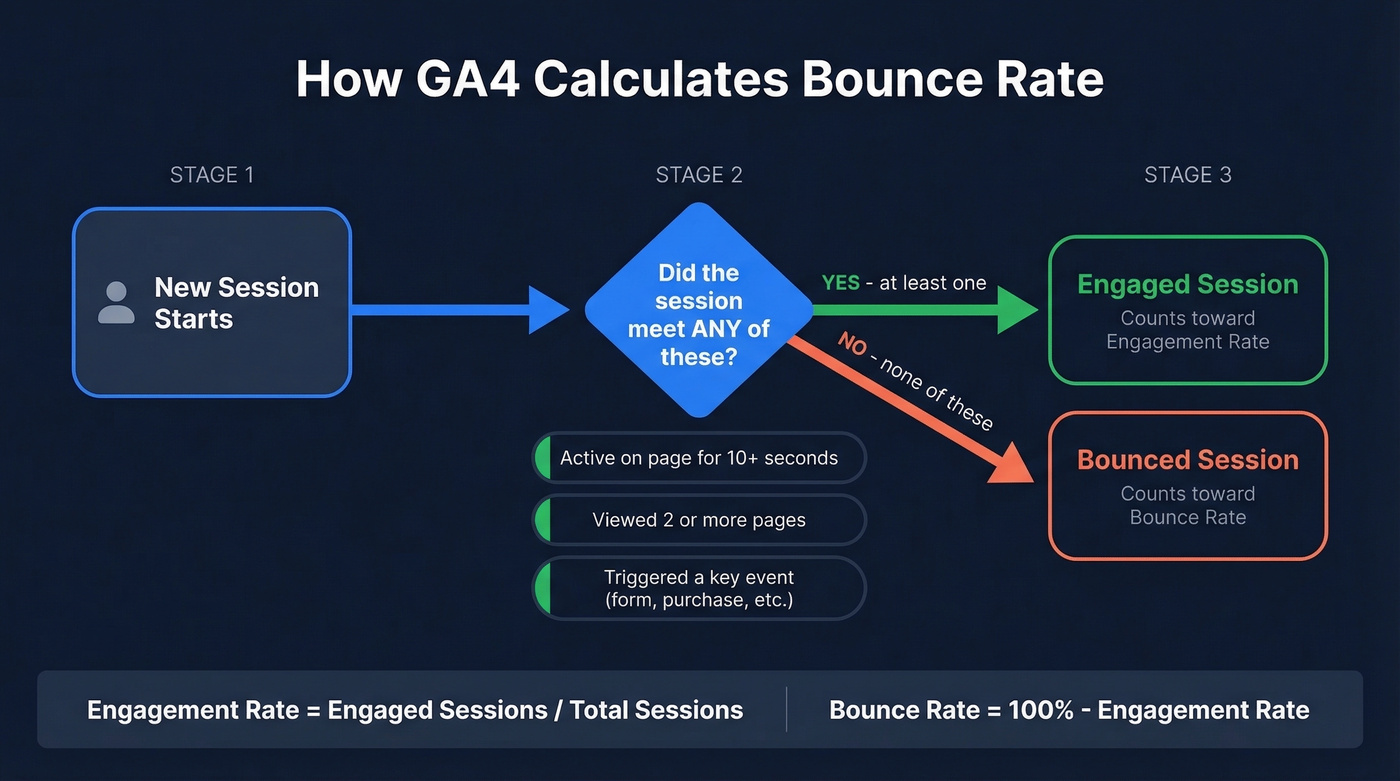
An engaged session in GA4 meets any one of three criteria: the visitor was active on the page for at least 10 seconds, they viewed two or more pages/screens, or they triggered a key event like a form submission or purchase. Hit any one of those, and the session counts as engaged.
Engagement rate = engaged sessions / total sessions. Bounce rate = 100% - engagement rate.
So if your engagement rate is 63%, your bounce rate is 37%. They're mathematical opposites.
One common reporting mistake: engagement rate is a session-level metric. It applies cleanly to landing pages and traffic sources - not to "this page someone visited third has X engagement rate." If you're attributing engagement rate to a page mid-journey, you're reading the data wrong.
One more detail most guides skip: that 10-second threshold is customizable in GA4's Data Streams settings, up to 60 seconds. Most teams leave it at the default, and that's fine. But if you're running a content-heavy site where meaningful engagement takes longer, the option exists.
GA4 vs Universal Analytics
Here's the thing: if your bounce rate "dropped" after migrating to GA4, nothing changed about your site. Universal Analytics counted any single-page session as a bounce - even if someone spent 8 minutes reading your entire blog post. GA4 doesn't. A visitor who lands on one page, reads for 45 seconds, and leaves is a bounce in UA but an engaged session in GA4. The measurement got smarter. Do not compare UA bounce rates to GA4 bounce rates. They're measuring fundamentally different things.
Bounce Rate vs Exit Rate vs Engagement Rate
These three metrics get confused constantly. Here's how they differ:
| Metric | What It Measures | Formula | High = Bad | High = Fine |
|---|---|---|---|---|
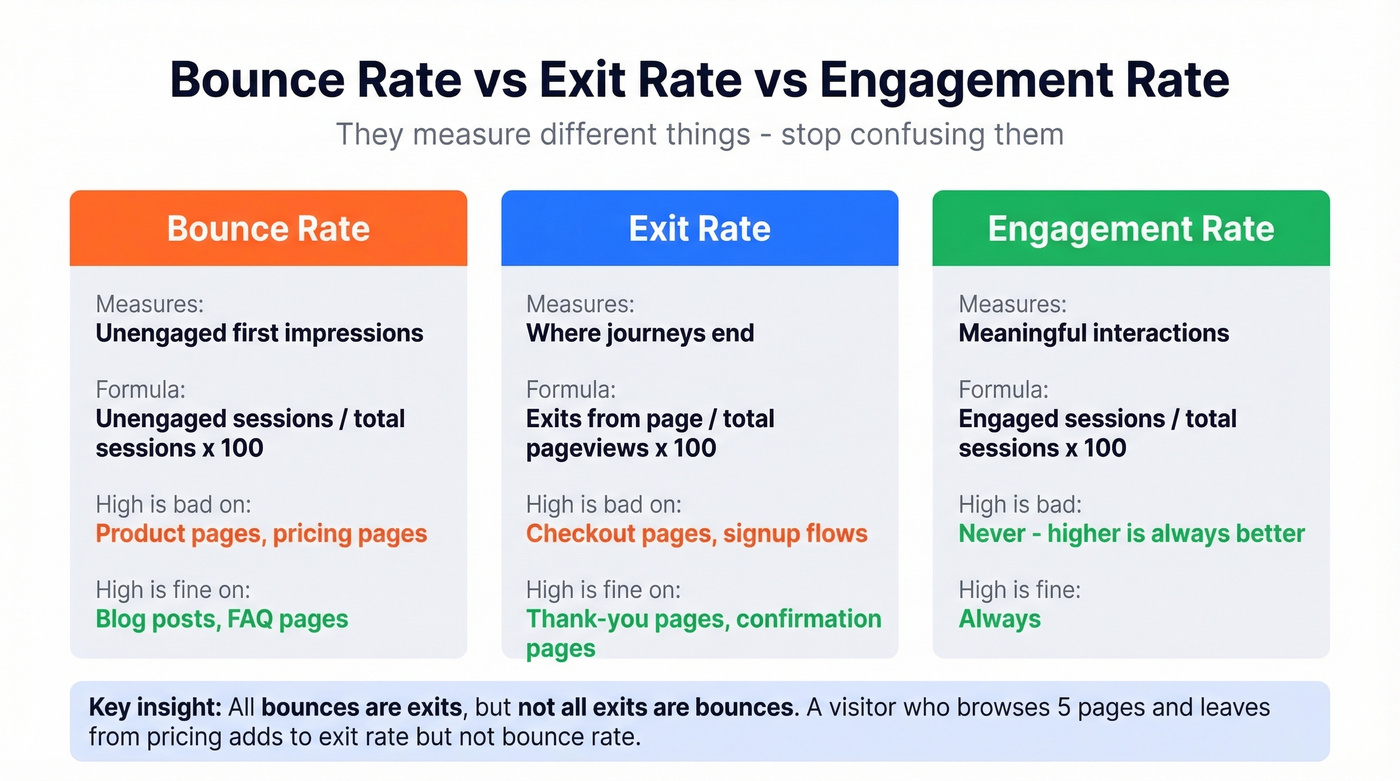
| Bounce rate | Unengaged first impressions | Unengaged sessions / total sessions x 100 | Product pages, pricing pages | Blog posts, FAQ pages |
| Exit rate | Where journeys end | Exits from page / total pageviews x 100 | Checkout pages, signup flows | Thank-you pages, confirmation pages |
| Engagement rate | Meaningful interactions | Engaged sessions / total sessions x 100 | Never (higher is always better) | Always fine |
Not all exits are bounces, but all bounces are exits. A visitor who browses five pages and leaves from your pricing page contributes to that page's exit rate but not its bounce rate. A visitor who lands directly on your pricing page and leaves without engaging contributes to both.
Here's the practical example that makes this click. Your post-purchase thank-you page has a 94% exit rate - perfectly healthy, since people completed their purchase and left. But if that same page has a 60% bounce rate, something's off. It means people are landing directly on the confirmation page, likely from a broken link or email, and leaving immediately. That's a tracking or linking issue, not a content problem.
Numbers tell you what happened; session replay tells you why.
What's a Good Bounce Rate?
HubSpot reports an overall average of 37%. It's a useful anchor, but it's also a blunt instrument. A blog-heavy site and an ecommerce store have completely different baselines.
Benchmarks by Industry and Device
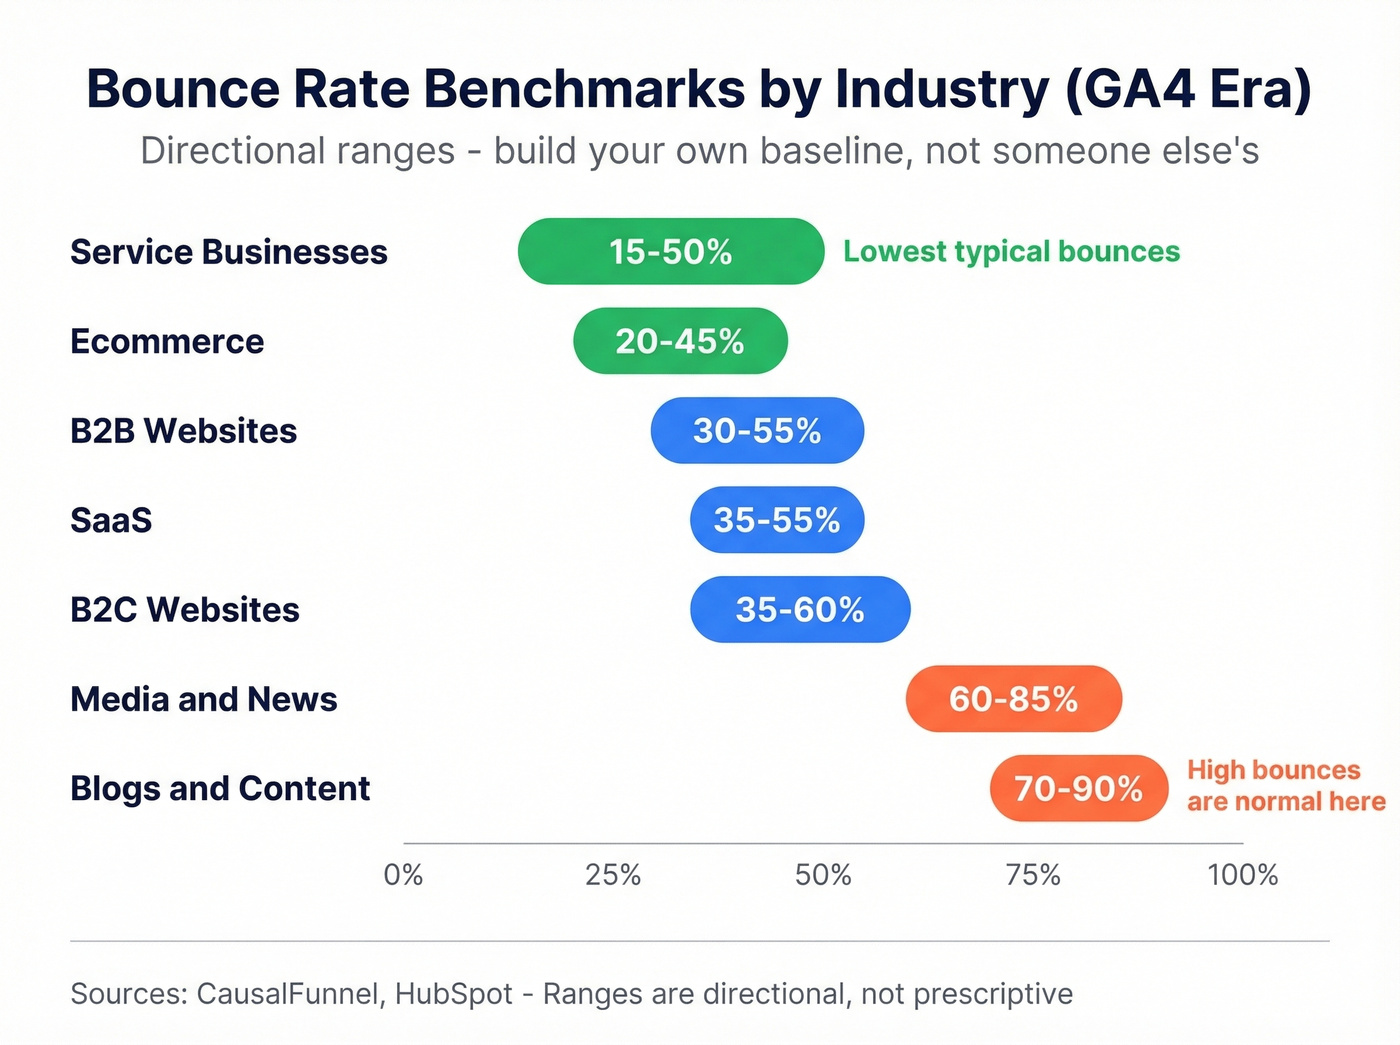
Here are directional ranges from CausalFunnel's benchmarks:
| Industry | Bounce Rate Range |
|---|---|
| Ecommerce | 20-45% |
| SaaS | 35-55% |
| Blogs / Content | 70-90% |
| Media / News | 60-85% |
| B2B Websites | 30-55% |
| B2C Websites | 35-60% |
| Service Businesses | 15-50% |
Device matters too. Tooltester's analysis of over 4 billion web visits breaks down like this:
| Device | Average Bounce Rate |
|---|---|
| Mobile | 56.8% |
| Tablet | 51.6% |
| Desktop | 50.0% |
Mobile bounces higher - smaller screens, slower connections, and more casual browsing intent all contribute.
Build Your Own Baseline
Industry benchmarks are directional, not diagnostic. A 45% rate is excellent for a blog and mediocre for an ecommerce product page. Comparing your SaaS site to an "average" derived from a survey of 336 people isn't analysis - it's astrology.
We've found that teams who track their own 90-day rolling baseline make faster progress than those chasing industry averages. Establish that baseline per page type and traffic source. Track your pricing pages separately from your blog. Track organic separately from paid. Then measure improvement against yourself. If your pricing page dropped from 62% to 48% over a quarter, that's meaningful progress regardless of what some industry report says the "average" should be.
Most teams would be better off deleting their site-wide bounce rate widget entirely. It averages your best pages with your worst, your highest-intent traffic with your lowest, and produces a number that tells you nothing actionable. Kill the vanity metric. Segment or ignore.
You're diagnosing website bounce rates - but what about your email bounce rate? Bad contact data inflates bounces past 5% and torches your sender reputation. Prospeo's 5-step verification and 7-day data refresh keep email bounce rates under 4%, backed by 98% accuracy across 143M+ verified addresses.
Stop fixing landing pages while your outbound emails are bouncing at 35%.
When High Bounce Rates Are Normal
Not every elevated number is a problem. Some pages are designed to answer a question and let the visitor leave. That's a success, not a failure.
Pages where high bounce is expected and healthy:
- FAQ pages - visitor got their answer, left satisfied
- Contact pages - they grabbed your phone number or address
- Policy and legal pages - nobody browses from a privacy policy to your product tour
- Single-purpose landing pages - store hours, directions, a specific phone number
- Blog posts answering a specific question - "what time does your store close" -> answer -> gone
If someone Googled "what time does your store close," landed on your hours page, got the answer, and left in 6 seconds - GA4 calls that a bounce. Your customer calls that great service. Context matters more than the number.
What Causes High Bounce Rates?
When the metric is genuinely too high on pages that should retain visitors, one of these five causes is almost always responsible.
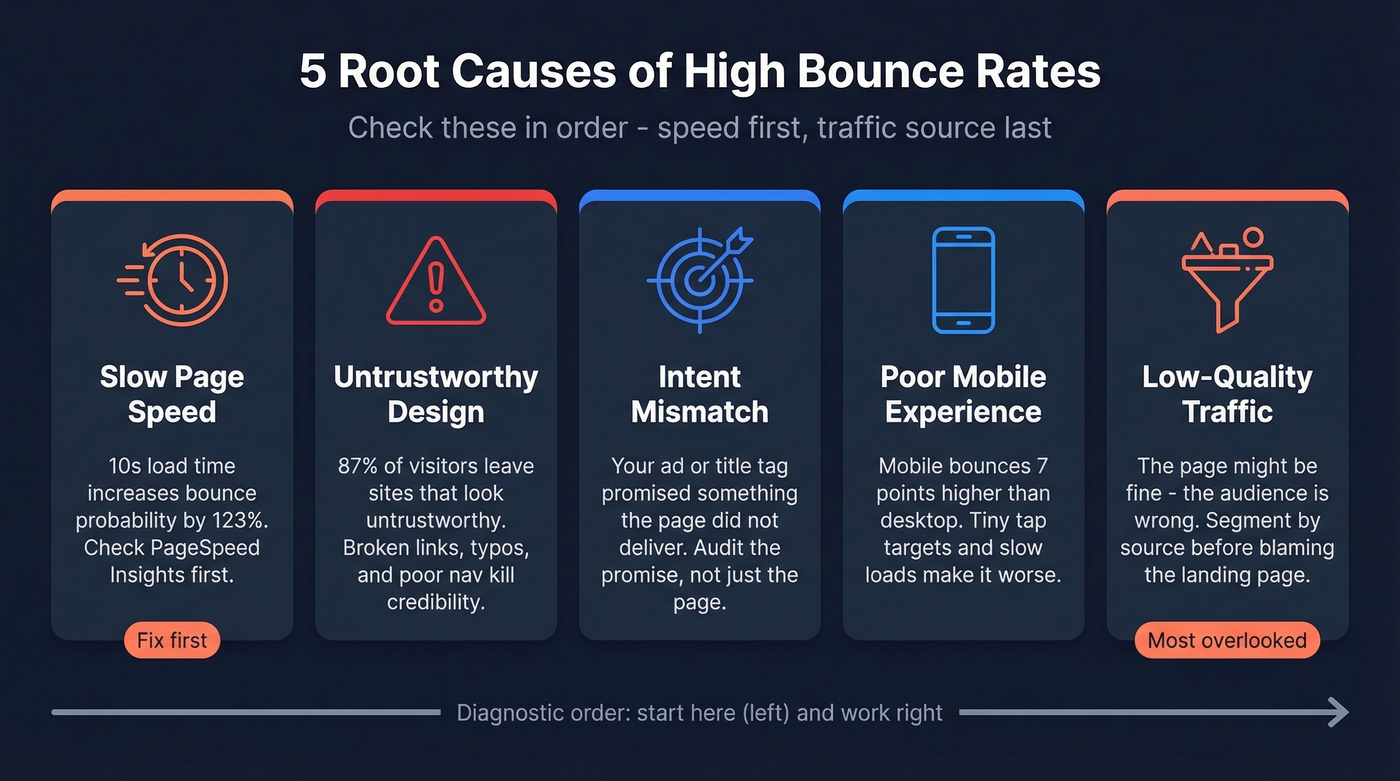
Slow Page Speed
A 10-second mobile load time increases bounce probability by 123% compared to a 1-second load. 53% of mobile visitors leave if a page takes more than 3 seconds. And the average mobile page still loads in 8.6 seconds - nearly three times the abandonment threshold.
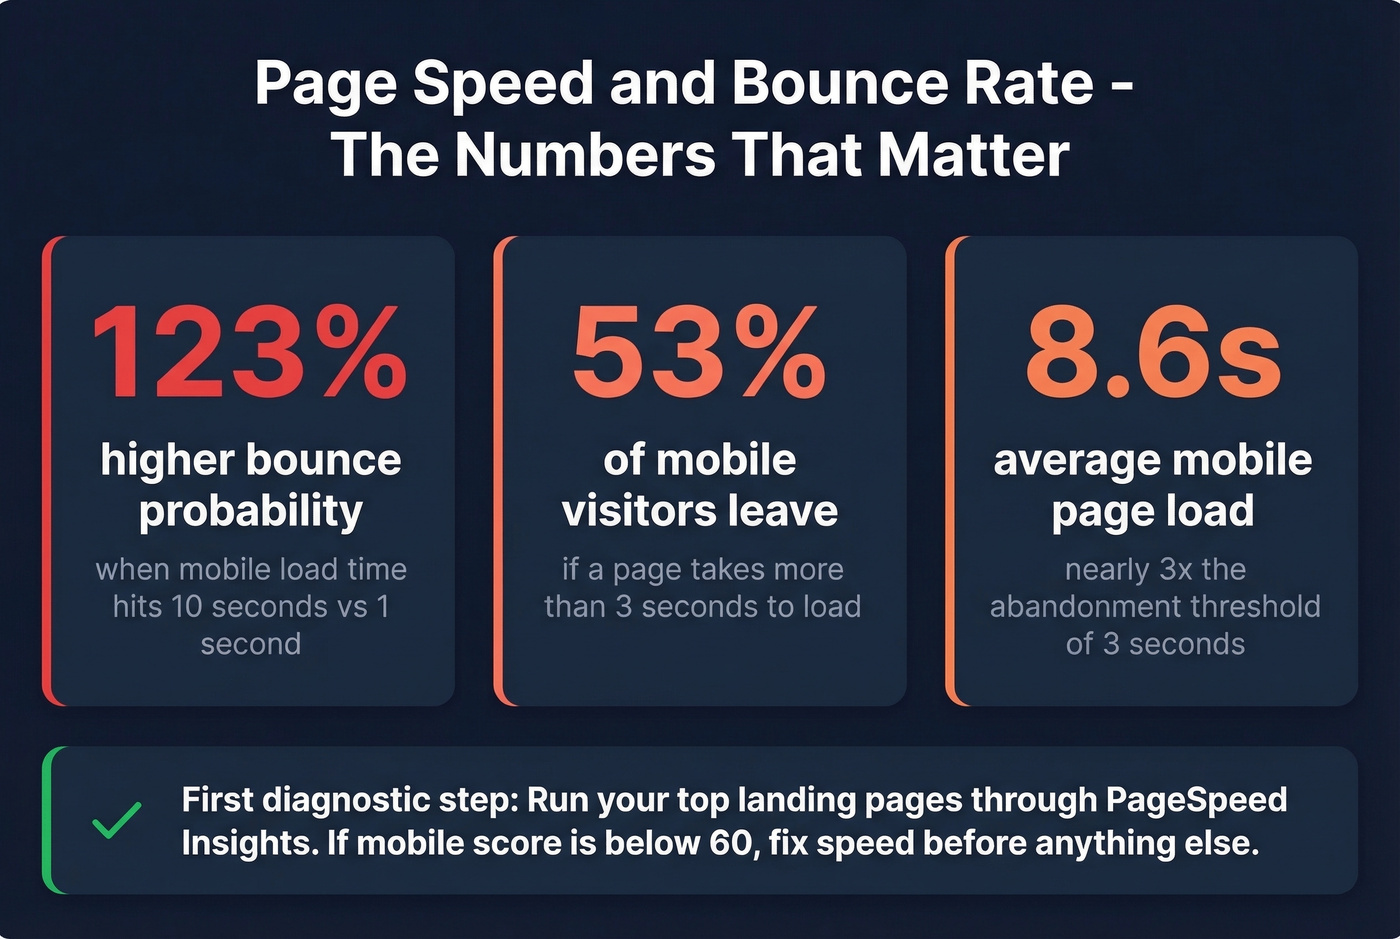
In our experience, speed is the first thing to check because it's the most measurable and most fixable. Run your top landing pages through PageSpeed Insights. If your mobile score is below 60, you've found your problem before looking at anything else.
Untrustworthy Design
87% of consumers say they've left a website immediately because it looked untrustworthy. 83% of shoppers judge a site's credibility in under 20 seconds. That's not enough time to read your copy - they're judging your design.
The specific trust killers: broken links and 404 errors (46% see them as a red flag), typos and placeholder text (65% lose trust), and poor navigation (49% distrust). And 80% will leave a site they don't like even if they want the product. Design isn't decoration. It's your first credibility check.
Intent Mismatch
Picture this: your paid campaign has a 4.2% click-through rate. Great. But the landing page bounces at 82%. The ad copy wrote a check the landing page couldn't cash.
This shows up whenever the page doesn't deliver what the title tag or ad copy promised. Misleading metadata, clickbait headlines, and keyword stuffing that ranks for the wrong queries all create intent mismatch. The fix isn't on the page - it's in the promise you made to get the click. Audit your title tags and ad copy against what the landing page actually delivers.
Poor Mobile Experience
One PPC advertiser on Reddit shared a story that captures this perfectly: roughly 20% of their ad traffic was bouncing before the page even finished loading on mobile - a PageSpeed score of 55 on mobile versus 80 on desktop. The page wasn't bad. It was just too slow for the device most people were using.
Mobile sessions bounce about 7 percentage points higher than desktop, and the gap widens on poorly optimized sites. Unresponsive layouts, tiny tap targets, intrusive interstitials, and horizontal scrolling all drive visitors away.
Low-Quality Traffic Sources
This is the overlooked cause, and it's the one most teams misdiagnose as a landing page problem.
When outbound email campaigns, cold outreach, or poorly targeted ads send the wrong people to your site, they bounce immediately. The page is fine. The list isn't. One SaaS founder on Reddit reported a 70% site-wide number - but when segmented, paid social was at 80% while organic sat at 57%. The site wasn't broken; the traffic source was.
The fix starts before the click - with the data powering your outreach. If your email lists contain unverified or stale contacts, you're driving visitors who were never a fit. Prospeo's real-time email verification with 98% accuracy and a 7-day data refresh cycle fixes this upstream, ensuring your outreach reaches decision-makers who actually match your ICP. Snyk reduced email bounce rate from 35-40% to under 5% after switching, and Stack Optimize maintains under 3% bounce across all clients.
How to Diagnose Your Bounce Rate
Before you fix anything, you need to know what's actually broken.
Segment Before You Diagnose
Stop obsessing over site-wide numbers. Here's the three-step framework we use:
Step 1: Break by traffic source. In GA4, go to Reports > Acquisition > Traffic Acquisition. Compare organic, paid, social, direct, and email. If paid social bounces at 78% while organic sits at 42%, you don't have a website problem - you have a targeting problem.
Step 2: Break by device. Add a secondary dimension for device category. If mobile bounces 20 points higher than desktop on the same pages, your mobile experience needs work.
Step 3: Break by landing page. Go to Reports > Engagement > Landing Pages. Sort by bounce rate and filter for pages with meaningful traffic - ignore pages with 12 sessions. The outliers are your diagnostic targets.
Use Session Replay
Once you've identified high-bounce pages, watching what users actually do beats guessing every time. Hotjar offers a free tier with session recordings that show exactly where visitors rage-click, hesitate, or bail. FullStory provides similar capabilities with 30,000 free monthly sessions. Pick one, install it on your top 5 highest-bounce landing pages, and watch 20-30 sessions. Patterns emerge fast.
SPA Tracking Pitfalls
This section could save you weeks of wasted optimization.
If your site runs on React, Angular, Vue, or a similar framework, your analytics data might be lying to you. GA4's Enhanced Measurement tracks history-based page changes by default, but single-page applications can still produce "(not set)" landing pages and inflated bounce rates.
The common culprits: missing initial page_view events, timing and race conditions where the tag fires before content loads, incorrect History API usage, and URL fragments (#) that GA4 doesn't track as new pageviews. SPAs often require custom GA4 implementation - manual page_view firing, correct History API usage, and tag timing adjustments. We've seen teams spend weeks optimizing content for high-bounce pages only to discover the tracking was broken. If your SPA shows abnormally high rates, audit your implementation before blaming your content.
How to Reduce Bounce Rate
Fix page speed first. It's the highest-impact, most measurable change you can make, and it doesn't require rewriting a single word of copy.
Fix page speed. Target under 3 seconds on mobile. Use PageSpeed Insights to identify bottlenecks, compress images, defer non-critical JavaScript, and consider a CDN if you're serving global traffic.
Match content to search intent. Audit your top landing pages. Does the H1 deliver what the title tag promised? Does the first paragraph answer the query? If someone searching "bounce rate benchmarks" lands on a page that spends 400 words on definitions before showing a single number, they're gone. For deeper ranges, see our bounce rate benchmarks.
Optimize mobile UX. Responsive design, readable font sizes at 16px minimum for body text, tap-friendly buttons at 44x44px minimum, and no intrusive interstitials. Test on actual devices, not just Chrome DevTools.
Add trust signals. Fix broken links, remove placeholder text, add social proof above the fold, and display security badges on transactional pages. 80% of visitors will leave a site they don't trust even if they want the product.
Improve internal linking. Give visitors a clear next step. Related content blocks, contextual CTAs, and logical navigation paths all reduce single-page sessions by creating a reason to stay. Every page should answer "what should I do next?" If you want a tighter measurement framework, use a B2B marketing measurement scorecard.
Fix your traffic sources. If paid or outbound traffic bounces disproportionately, the problem is upstream. Better targeting, better data, better ad-to-page alignment. No amount of landing page optimization fixes a bad list - start with ICP alignment.
Audit your GA4 setup. A 0% bounce rate means your tracking is broken - likely duplicate tags or misconfigured events. Under 20%? Audit before celebrating. Accurate measurement is the prerequisite for everything else on this list. If you need a step-by-step, follow our bounce rate analysis guide.
Skip steps 2-5 if your PageSpeed mobile score is below 50. Nothing else matters until the page loads.
Segmenting bounce data only works when you're reaching the right people in the first place. Prospeo gives you 30+ filters - buyer intent, technographics, job changes, funding - so every visitor and every email lands with purpose. Teams using Prospeo cut email bounce rates from 35% to under 4%.
Target better prospects and watch every bounce metric drop.
Common Myths Debunked
Myth: Bounce rate is a Google ranking factor. It isn't. Google has said it doesn't use Google Analytics data for ranking. The myth persists because pages with poor content tend to have both high bounce rates and low rankings - but correlation isn't causation. Pogo-sticking (returning to search results quickly) is a different behavior entirely, and even that isn't a confirmed ranking factor.
Myth: Lower is always better. Not for content sites, FAQ pages, or single-purpose landing pages. A blog post with a 75% bounce rate might be performing beautifully - readers got the answer and left satisfied. Optimizing for lower numbers on these pages often means adding unnecessary friction. Low rates are the goal for transactional and product pages, but for informational content, 70%+ can be perfectly fine.
Myth: A 0% bounce rate means perfection. It means your tracking is broken. A 0% rate - or anything under ~20% - almost always indicates duplicate GA4 tags, misconfigured events, or tag manager errors firing extra page_view events. Audit your implementation immediately.
FAQ
What is bounce rate in GA4?
It's the inverse of engagement rate - the percentage of sessions where a visitor didn't stay active for 10+ seconds, didn't view a second page, and didn't trigger a key event. This definition changed significantly from Universal Analytics, which counted any single-page session as a bounce regardless of time spent.
What's a good bounce rate for a website?
The overall average is around 37%, but "good" depends entirely on page type. Ecommerce sites typically see 20-45%, blogs run 70-90%, and SaaS sites land between 35-55%. Your own 90-day rolling average segmented by page type and traffic source is more useful than any generic industry benchmark.
Is bounce rate a Google ranking factor?
No. Google has never confirmed it as a direct ranking signal, and has stated it doesn't use Google Analytics data for rankings. Pages with poor content tend to have both high bounce rates and low rankings, but that's correlation - not causation. Focus on user experience and content quality instead.
Why did my bounce rate drop after switching to GA4?
GA4 defines bounces differently than Universal Analytics. A session isn't a bounce in GA4 if the user stays active for 10+ seconds, views two or more pages, or triggers a key event. UA counted every single-page session as a bounce. Your site didn't change - the measurement did.
How do I reduce bounce rate from outbound campaigns?
Start with data quality upstream. Verify emails in real time before sending - tools like Prospeo deliver 98% email accuracy with a 7-day refresh cycle, which keeps stale contacts out of your lists. Then ensure your targeting matches your ICP so visitors actually engage when they arrive. Snyk cut email bounce from 35-40% to under 5% this way.