B2B Marketing Measurement Is Broken - Here's How to Fix It
Only 30% of B2B companies believe they can measure how brand impacts demand or sales. Meanwhile, roughly 37% of marketing budgets get wasted due to poor targeting and measurement gaps. Your dashboards are full of numbers. The problem with b2b marketing measurement isn't data - it's that most of those numbers don't connect to revenue, and everyone in the room knows it.
Ask any RevOps lead and they'll tell you the same thing: last-touch over-credits branded search, "direct" is a black hole that swallows half your attribution, and the reporting is as much political as it is analytical. We've watched teams spend months building dashboards nobody looks at while the CFO quietly loses faith in marketing's ability to justify its own budget.
Here's the framework that actually works:
- Track five metrics that matter: pipeline sourced, pipeline influenced, CAC, LTV:CAC ratio, and pipeline velocity. Everything else is supporting evidence.
- Start with U-shaped attribution (40/40/20 split across first touch, last touch, and middle). Graduate to W-shaped once your lifecycle stages are clean.
- Fix your data quality first. Attribution models built on a CRM full of stale contacts and duplicate records don't measure conversion - they measure database rot.
The Dark Funnel Problem
Most of your buyer's journey is invisible. The dark funnel - Slack DMs, podcast mentions, G2 research, private communities, word-of-mouth at conferences - drives decisions but leaves no cookie trail.
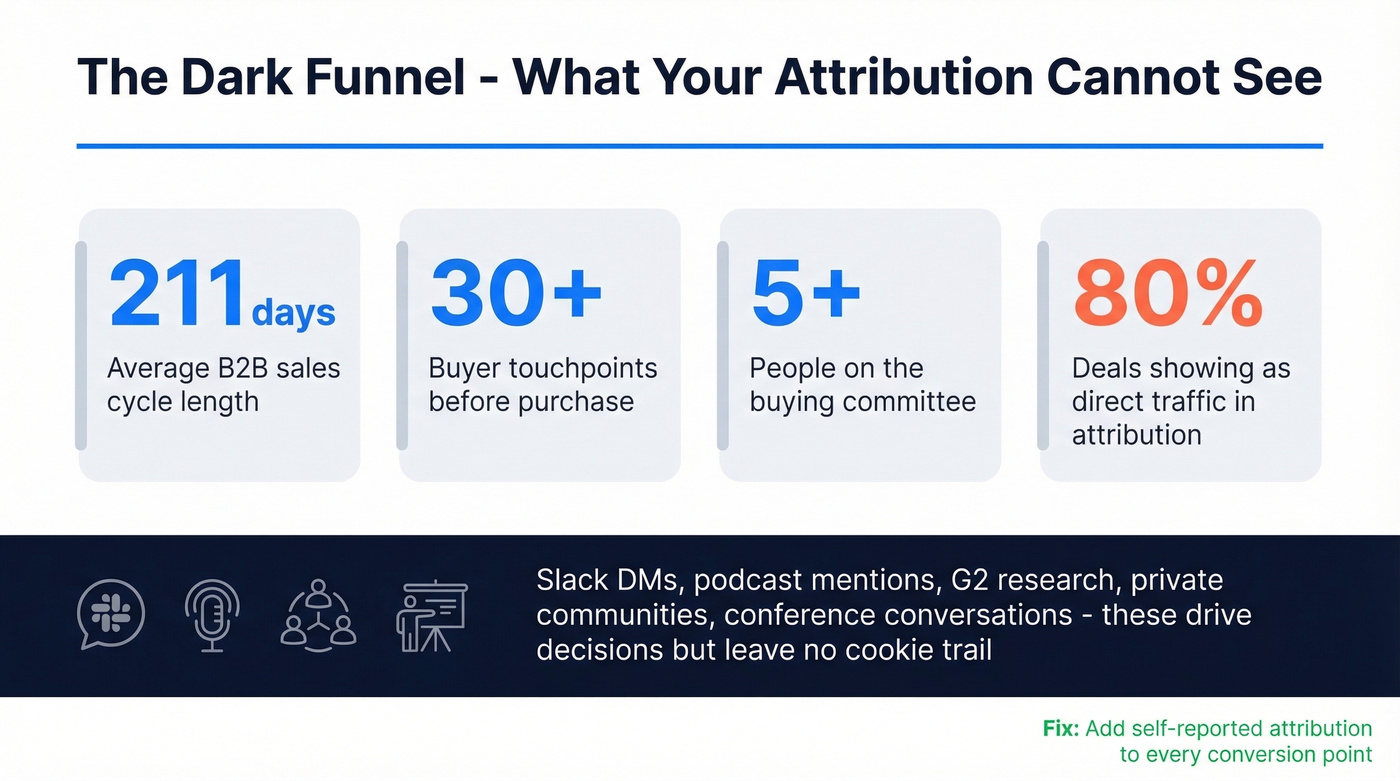
The symptom is familiar: attribution reports showing 80% of deals as "direct traffic." That's not because your brand is so strong everyone types your URL from memory. It's because your tools can't see where the buyer actually started.
The average B2B sales cycle runs 211 days. Buyers engage 30+ times before purchase. Buying committees involve 5+ people. A 90-day attribution window misses most of the early research that shaped the deal - the research your marketing budget funded. This is why accurate campaign performance measurement requires looking far beyond the last click.
Performance Metrics That Matter
Most marketing teams track too many things. The fix isn't more dashboards - it's a tiered framework that separates signal from noise. The sourcing vs. influence distinction is the right starting point: sourcing measures deals marketing originated directly, while influence captures every deal marketing touched along the way. You need both.
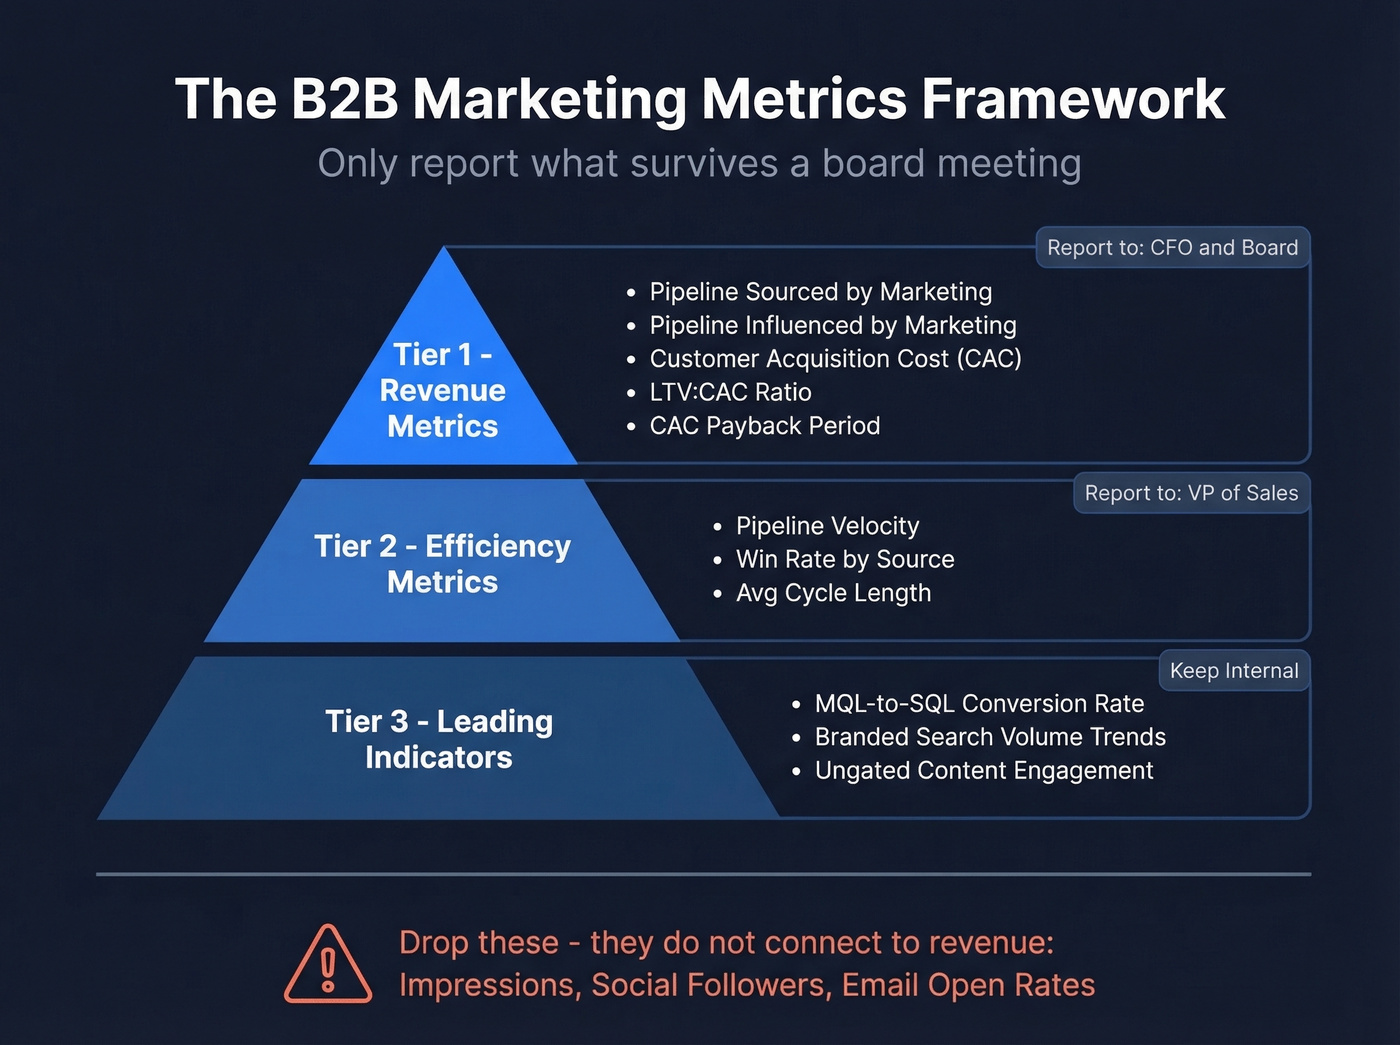
Tier 1 - Revenue metrics (report these to the CFO): pipeline sourced by marketing, pipeline influenced by marketing, customer acquisition cost, LTV:CAC ratio, and CAC payback period. These are the only numbers that survive a board meeting.
Tier 2 - Efficiency metrics (report these to the VP of Sales): pipeline velocity, win rate by source, and average cycle length. These tell you whether marketing generates pipeline that actually closes.
Tier 3 - Leading indicators (keep these internal): MQL-to-SQL conversion rate, branded search volume trends, and content engagement on ungated assets. Useful for diagnosing problems, but don't lead with these in exec reviews.
Running ABM? Swap MQL-to-SQL for account engagement depth and account-level pipeline velocity. The framework stays the same - the unit of analysis shifts from lead to account.
Impressions, social followers, email open rates - these don't connect to revenue. Stick to 3-5 KPIs per campaign. If you can't explain why a metric matters to pipeline, drop it.
Benchmarks for 2026
Numbers without context are useless. Here's what healthy B2B SaaS funnels look like:
| Metric | Benchmark |
|---|---|
| Lead-to-customer | 2-5% |
| MQL to SQL | 15-21% |
| Win rate | 20-30% |
| Median sales cycle | 84 days |
| Pipeline velocity | $743-$2,456/day |
The MQL-to-SQL conversion is where most funnels break. Below 15%, the problem is usually lead quality or misaligned definitions between marketing and sales - not volume. One stat that puts this in sharper relief: SEO leads convert MQL-to-SQL at 51% vs. 26% for PPC, which is why SEO's lower CAC is even more impressive than it looks.
| Channel | Avg CAC |
|---|---|
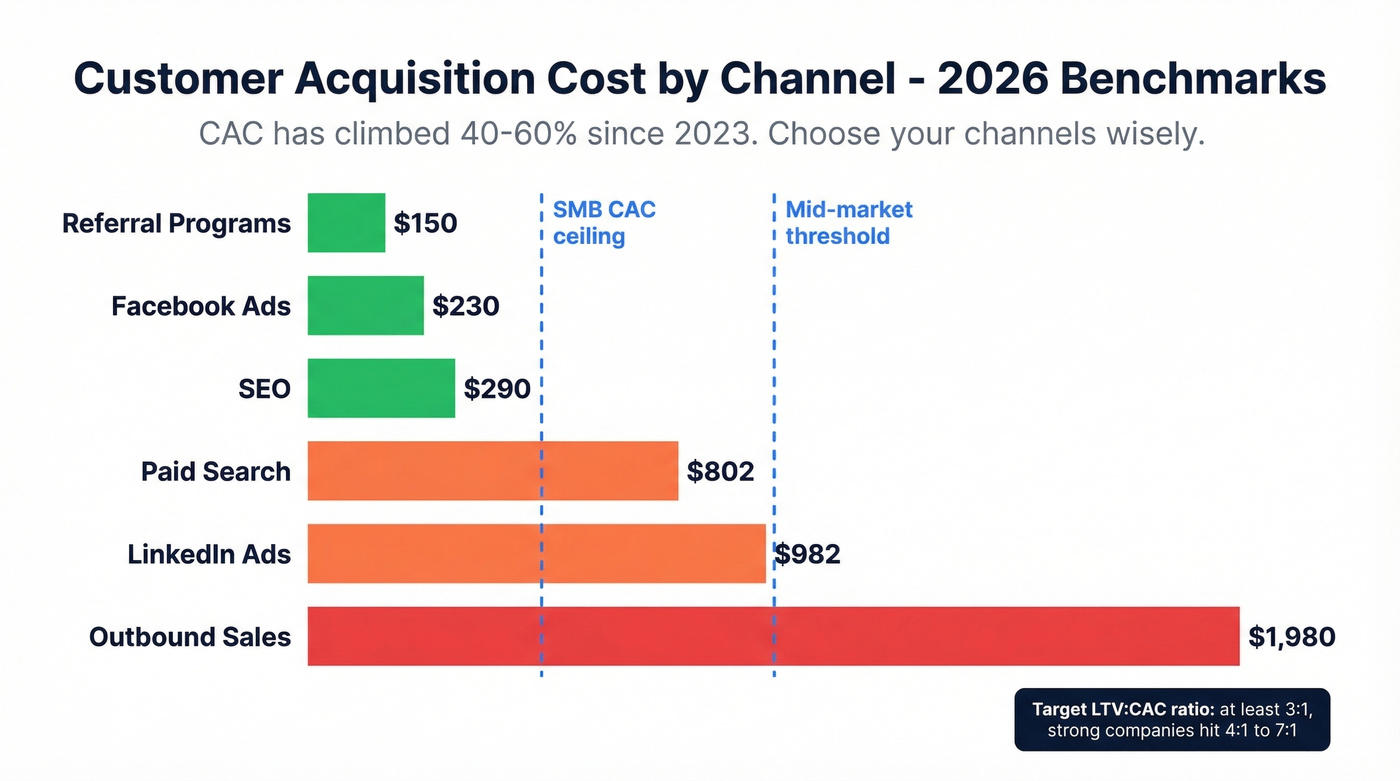
| SEO | $290 |
| Facebook Ads | $230 |
| Referral programs | $150 |
| Paid search | $802 |
| LinkedIn Ads | $982 |
| Outbound sales | $1,980 |
CAC has climbed 40-60% since 2023. By segment: $100-$400 for SMB, $400-$800 for mid-market, $800+ for enterprise. The target LTV:CAC ratio is at least 3:1, with strong SaaS companies hitting 4:1 to 7:1. Below 3:1, you're buying growth you can't sustain.
Attribution Models Compared
| Model | Weight Split | Best For | Blind Spot | Recommended? |
|---|---|---|---|---|
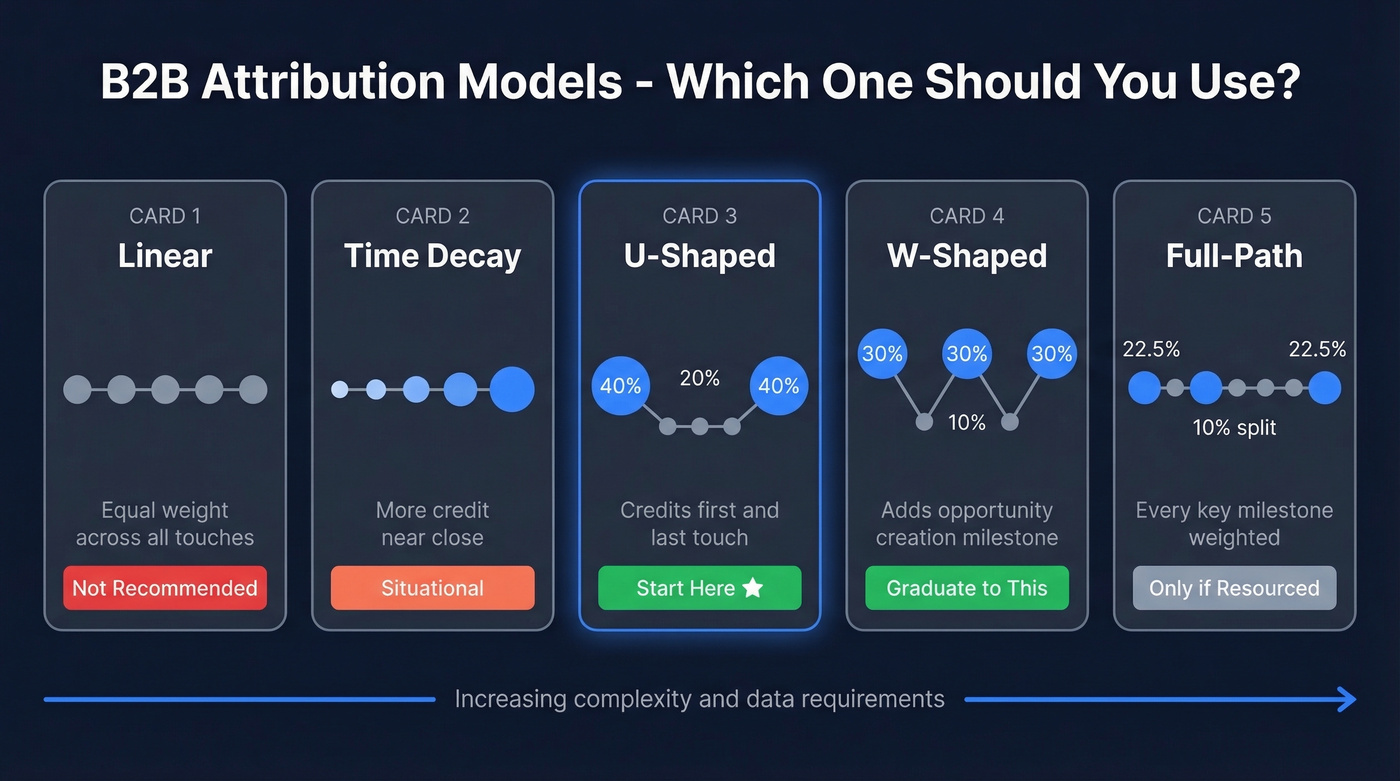
| Linear | Equal across all | Starting point | Treats all touches equally | No |
| Time Decay | More near close | Late-stage focus | Undervalues TOFU | Situational |
| U-shaped | 40/40/20 | Most B2B teams | Misses mid-funnel | Yes - start here |
| W-shaped | 30/30/30/10 | Mature ops teams | Needs clean data | Yes - graduate to this |
| Full-path | 22.5% each key milestone + 10% rest | Full journey | Complex to maintain | Only if resourced |
Google retired first click, linear, time decay, and position-based models in Google Ads back in 2023. That's a signal: don't let your attribution strategy live inside a platform setting.
Start with U-shaped. It gives proper credit to the first touch (what introduced the buyer) and the last touch (what converted them) while acknowledging the middle. Once your lifecycle stages are clean and your CRM data is reliable, graduate to W-shaped, which adds a milestone at opportunity creation. Layer in self-reported attribution - a simple "how did you hear about us?" field - to capture dark funnel signals no model can track.
You can't measure what you can't attribute, and you can't attribute what's built on stale CRM records. Prospeo enriches your pipeline with 50+ data points per contact at a 92% match rate - refreshed every 7 days, not every 6 weeks. Clean data in, accurate measurement out.
Stop measuring database rot. Start measuring real pipeline.
Beyond Attribution - Incrementality and MMM
Attribution alone fails because it double-counts. When Meta claims credit on a 1-day view / 28-day click window and Google claims the same conversion through last-click, your total "attributed" revenue exceeds actual revenue. Every platform is biased toward itself.
Three methods cut through this. True experiments - geo tests or audience holdouts - measure causal lift and remain the gold standard, though they're operationally heavy. Natural experiments use historical spend variation to estimate impact without a formal test. Platform lift tests from Meta, Google, and LinkedIn are useful but graded on their own curve; treat them as directional, not definitive.
Marketing mix modeling (MMM) is making a comeback, driven by privacy restrictions that killed user-level tracking. One retail case study showed a 26% budget cut that produced a 53% ROI increase after MMM-driven reallocation. But MMM success is less about the math and more about stakeholder trust - you'll need weekly media spend by channel, weekly revenue data, and external factors like seasonality and pricing changes. Plan for biannual model refreshes with quarterly checkpoints. The practical threshold: MMM suits organizations spending $1M+ annually with enough historical data and channel variation to build a reliable model.
Mid-market attribution platforms like Dreamdata and HockeyStack typically run $1,000-$5,000/month. Enterprise tools like Marketo Measure and CaliberMind are often five figures+/year. Factor this into your measurement stack budget before committing.
Brand - The Biggest Blind Spot
Only 31% of B2B companies run an annual brand tracker. Fewer than 4% measure marketing impact beyond six months.
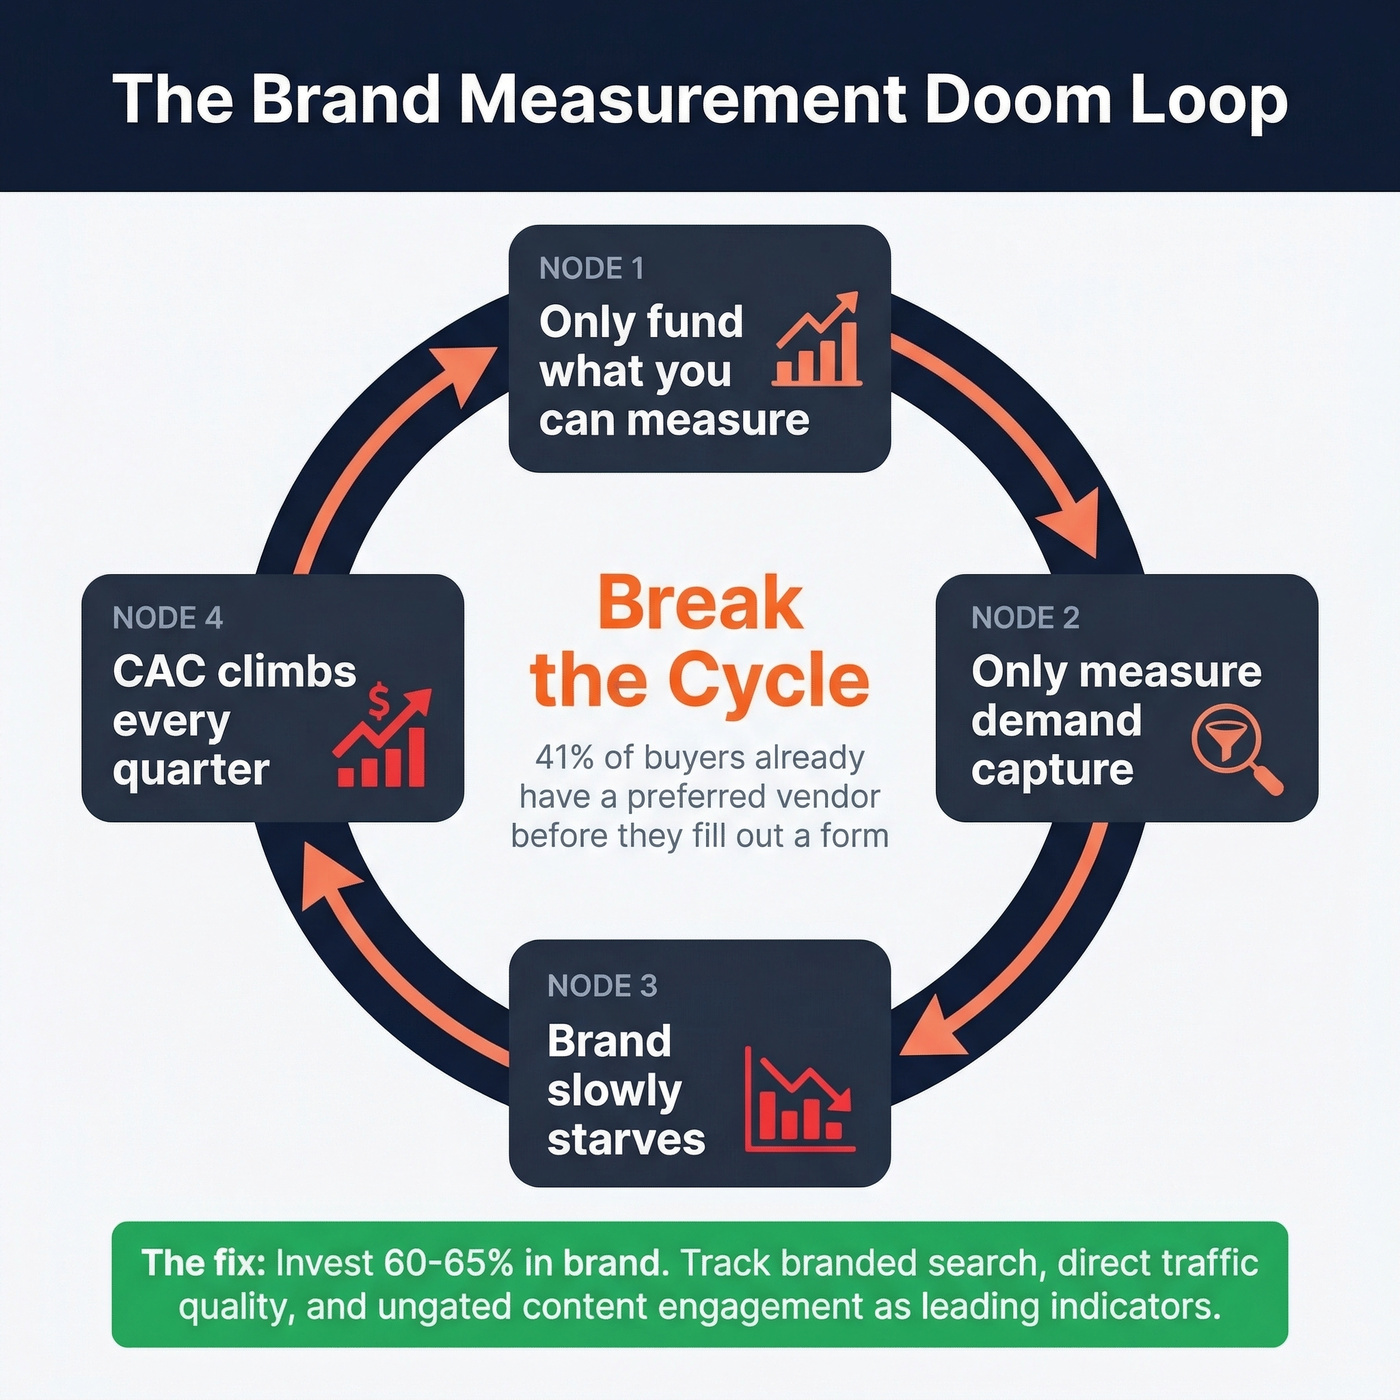
And yet 41% of B2B buyers start with a single preferred vendor already in mind - 90%+ have a shortlist before they ever fill out a form. If you're not on that shortlist, your demand capture campaigns are fighting over scraps.
Here's the thing: the recommended split is 60-65% of spend on brand, but almost nobody does it because brand is hard to measure and easy to cut. This is exactly why most B2B companies are stuck in a measurement doom loop - they only fund what they can measure, which means they only measure demand capture, which means brand slowly starves, which means the shortlist shrinks, which means demand capture gets more expensive. Break the cycle or watch your CAC climb every quarter.
The early indicators that brand is working: branded search volume trending up, direct traffic quality improving, and ungated content engagement growing. These won't satisfy a CFO alone, but they're the leading signals that pipeline will grow 6-12 months from now. The CEO skepticism is real - 66% say marketers focus too much on tactical analytics. Brand measurement bridges that gap.
Seven Mistakes Costing You Budget
1. Tracking vanity metrics. Report only metrics that connect to pipeline or revenue. If it doesn't tie to dollars, it doesn't get a slide.
2. Using only last-touch attribution. This frustration shows up constantly in B2B marketing communities - threads on r/sales and r/marketing asking "what metrics do you actually report?" consistently surface the same pain. Last-touch gives all credit to the final click, which usually means branded search gets a trophy it didn't earn. Implement multi-touch, starting with U-shaped.
3. Ignoring the dark funnel. Add self-reported attribution fields to every conversion point. It's low-tech and surprisingly accurate.
4. Not aligning definitions with sales and finance. In our experience, the MQL-to-SQL handoff is where most measurement systems fall apart - not because the data is wrong, but because marketing and sales define "qualified" differently. Agree on what "MQL," "SQL," and "opportunity" mean before building dashboards. Locking down these definitions is the first step in any credible reporting framework.
5. Measuring too many things. Cap at 3-5 KPIs per campaign. If it's not on the list, it doesn't get reported.
6. Ignoring data quality. Bad data costs organizations an estimated $12.9 million annually. Your funnel metrics are only as accurate as the data in your CRM. If too many of your contact records have invalid emails, your MQL-to-SQL rate measures data decay, not conversion. Tools like Prospeo, which refresh contact data every 7 days vs. the industry's 6-week average, help keep pipeline metrics grounded in actual buyer behavior.
7. Reporting instead of deciding. Every dashboard should answer "what should we change?" not just "what happened?" If your weekly meeting reviews numbers without producing a single action item, you have a reporting habit, not a measurement system.
How to Fix Your Measurement Stack
Let's break this down into five steps you can start this week.
- Align on 3-5 KPIs with sales and finance. Get agreement before building anything. If the CFO doesn't recognize the metric, it won't protect your budget.
- Audit data quality. Run enrichment and verification on your CRM contacts before trusting your metrics. We've seen teams discover 25%+ of their records are stale - which means a quarter of their funnel reporting is fiction. (If you need options, start with data enrichment.)
- Implement multi-touch attribution. Start with U-shaped. Directional attribution beats last-touch every time.
- Add self-reported attribution. A simple "how did you hear about us?" field captures dark funnel signals no tracking pixel can see.
- Review quarterly, not weekly. B2B sales cycles are long. Weekly reporting creates noise and encourages reactive decisions that hurt programs designed to compound.
Skip step 2 at your peril. I've seen a team celebrate a 22% MQL-to-SQL rate for three months before discovering that a third of their "MQLs" were bouncing on first email send. The rate was actually closer to 14%.
Solid b2b marketing measurement starts with clean data and ends with decisions. If your framework doesn't produce action items, it's decoration.
MQL-to-SQL conversion below 15%? The problem isn't your attribution model - it's lead quality. Prospeo's 300M+ profiles with 98% verified emails and 30+ intent filters mean marketing sources pipeline that sales actually closes. At $0.01 per email, fixing your funnel costs less than one bad dashboard.
Better data quality drives every metric on this page.
FAQ
What's the difference between sourcing and influence?
Sourcing measures deals marketing originated directly - first touch created the lead. Influence captures every deal marketing touched at any point in the buyer journey. You need both: sourcing for accountability, influence for budget justification. Most mature teams weight sourcing at 60% and influence at 40% in exec reporting.
How often should I review marketing metrics?
Monthly for pipeline and CAC. Quarterly for attribution model accuracy and strategic KPIs. Weekly check-ins should focus only on campaign-level tactical adjustments - never strategic pivots. B2B sales cycles averaging 84+ days make weekly strategic reviews counterproductive.
What's a good LTV:CAC benchmark for B2B SaaS?
Target an LTV:CAC ratio of at least 3:1, ideally 4:1 to 7:1. Average B2B SaaS CAC is $536, ranging from $290 for SEO to $1,980 for outbound. Below 3:1, focus on reducing acquisition cost before scaling spend.
How does data quality affect marketing measurement?
Stale CRM data inflates bounce rates, deflates conversion metrics, and corrupts attribution models. If 20%+ of your contact records have invalid emails, your MQL-to-SQL rate reflects database decay - not funnel performance. Regular enrichment and verification keep your metrics honest, which is why a short data refresh cycle matters more than most teams realize.