CAC Ratio Explained: The Metric Half the Internet Gets Wrong
Ask five SaaS finance people what "CAC ratio" means and you'll get three different formulas. That's not an exaggeration - the industry splits between LTV:CAC, the Magic Number, and the cost-of-ARR metric that most boards actually care about. The CAC ratio deserves a clear, definitive breakdown, so let's fix the confusion.
What Your Board Actually Means
When your VP of Sales asks you to "pull the CAC ratio for the board deck," they almost certainly mean the cost-of-ARR metric:
CAC Ratio = Total S&M Expenses / New Customer ARR
The 2026 median sits around $2.00 of S&M spend per $1 of new customer ARR, based on Benchmarkit's dataset of 800+ companies. If you're looking for the CLV-to-CAC ratio, we cover that below - but it's a different metric answering a different question.
What Is the CAC Ratio?
Throughout this article, "CAC ratio" means cost of ARR: sales and marketing efficiency at the dollar-of-ARR level, not the customer level.
A 1.0x ratio means you spent $1 to generate $1 of new ARR - that's healthy territory by common benchmarks. A 3.0x means you're spending $3 for every $1 of recurring revenue you add, which is usually a problem unless you're intentionally buying growth.
Three variants matter:
- Blended includes both new customer and expansion ARR in the denominator.
- New customer isolates net-new logos only.
- Expansion captures upsell and cross-sell efficiency separately.
Most board decks use the new customer version. Expansion ARR is fundamentally cheaper, and mixing the two flatters the number - sometimes dramatically.
You'll also see a gross-margin-adjusted version where the numerator is bookings multiplied by subscription gross margin. It's a different lens that mixes acquisition efficiency with delivery efficiency, so be consistent about which version you're reporting.
How to Calculate the CAC Ratio
Use committed ARR (bookings) in the denominator, not recognized revenue. Revenue gets spread over the subscription term under ASC 606, which distorts timing. Billings depend on invoicing schedules and are equally misleading.
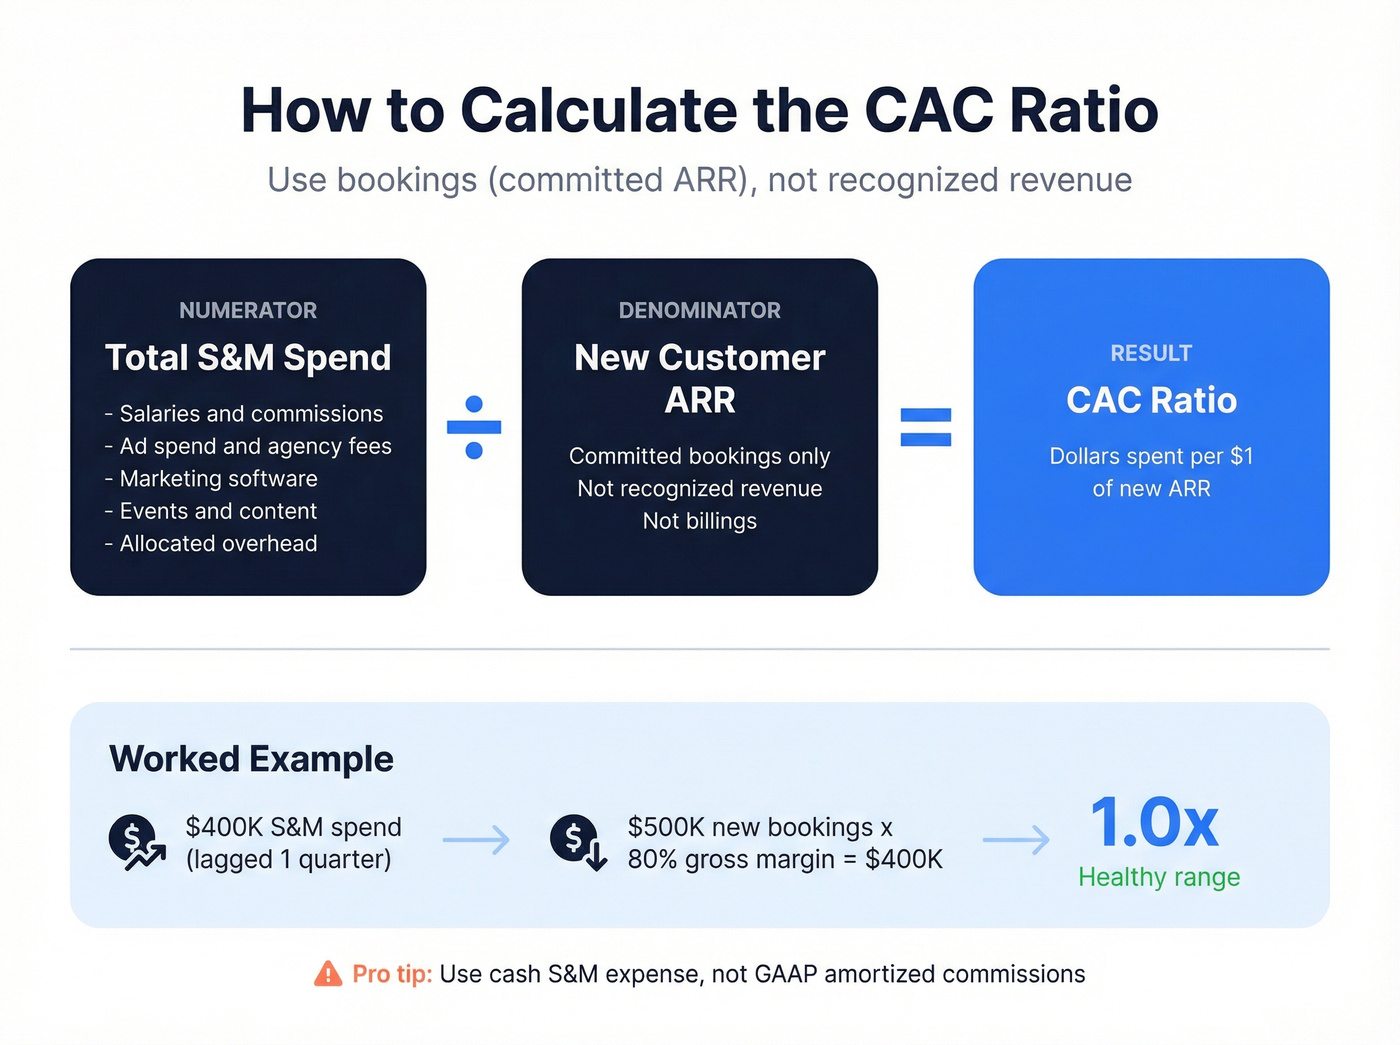
For the numerator, include everything: salaries, commissions, bonuses, benefits, ad spend, marketing software, agency fees, events, content production, and allocated overhead. KellBlog makes a good point here - excluding PR or "brand" spend is a slippery slope that lets teams cherry-pick their way to a flattering number.
One accounting note: if your commissions are amortized under ASC 340-40, use cash S&M expense, not GAAP. Amortization hides the true acquisition spend.
Worked example: $500K in new bookings, 80% subscription gross margin, $400K in S&M last quarter (lagged one quarter). ($500K x 0.80) / $400K = 1.0x.
Match your measurement period to your sales cycle length. For volatile months, use rolling 3- or 6-month averages to smooth things out.
Every bounced email inflates your CAC ratio. Prospeo delivers 98% email accuracy with a 7-day refresh cycle, so your S&M dollars reach real buyers - not dead inboxes. Snyk's 50 AEs dropped bounce rates from 35% to under 5% and grew AE-sourced pipeline 180%.
Stop spending $2 per $1 of ARR on bad data.
2026 Benchmarks Worth Knowing
Here's where the industry stands, based on Benchmarkit's most recent data:
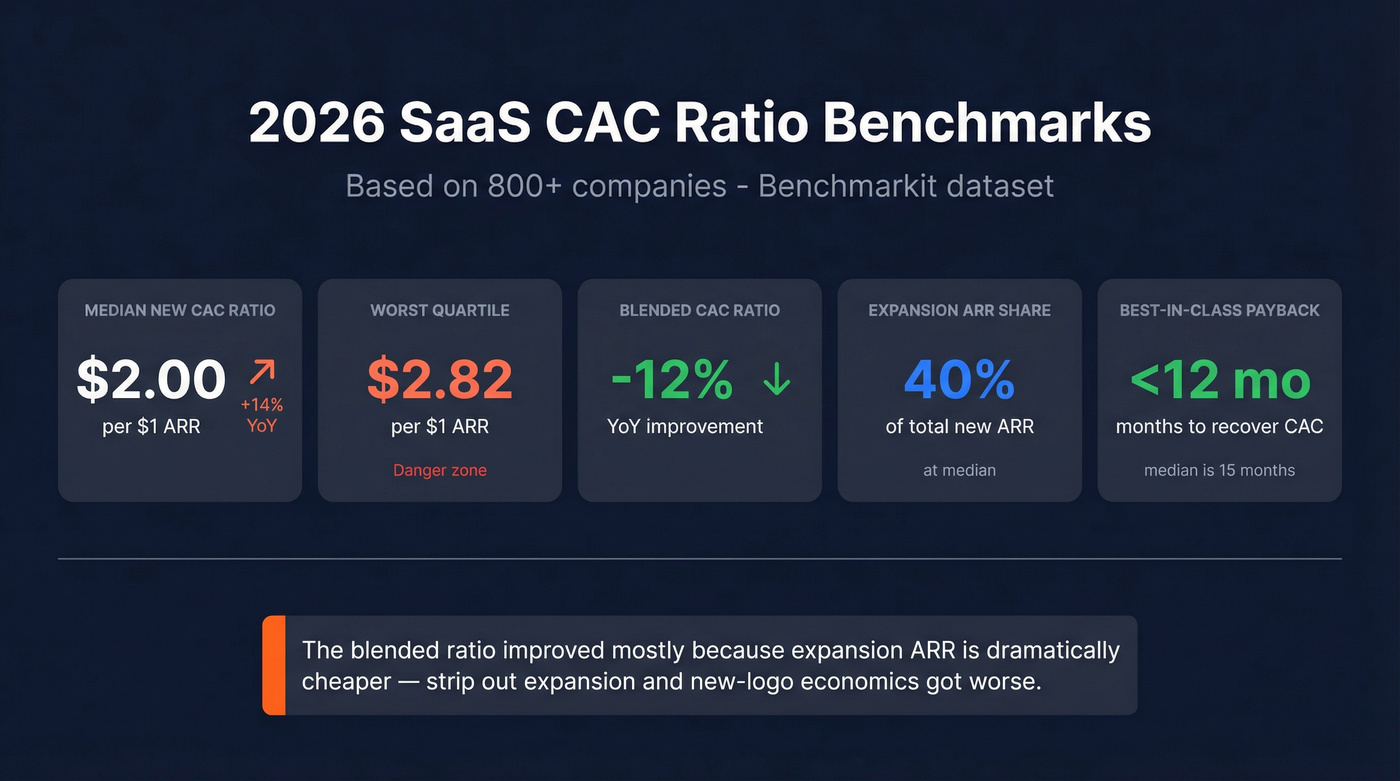
| Metric | Value |
|---|---|
| Median New CAC Ratio | $2.00 per $1 ARR |
| YoY Change | +14% |
| 4th Quartile (worst) | $2.82 per $1 ARR |
| Blended CAC Ratio Change | -12% YoY |
| Expansion ARR Share | 40% of Total New ARR |
That $2.00 median isn't aspirational - it's a warning. The blended ratio improved 12% largely because expansion ARR (40% of total new ARR at the median) is dramatically cheaper to generate. Strip out expansion, and new-logo economics got worse. LTV-to-CAC benchmarks by industry vary significantly too - a vertical SaaS company selling to healthcare will have a wildly different cost structure than a horizontal PLG tool targeting SMBs.
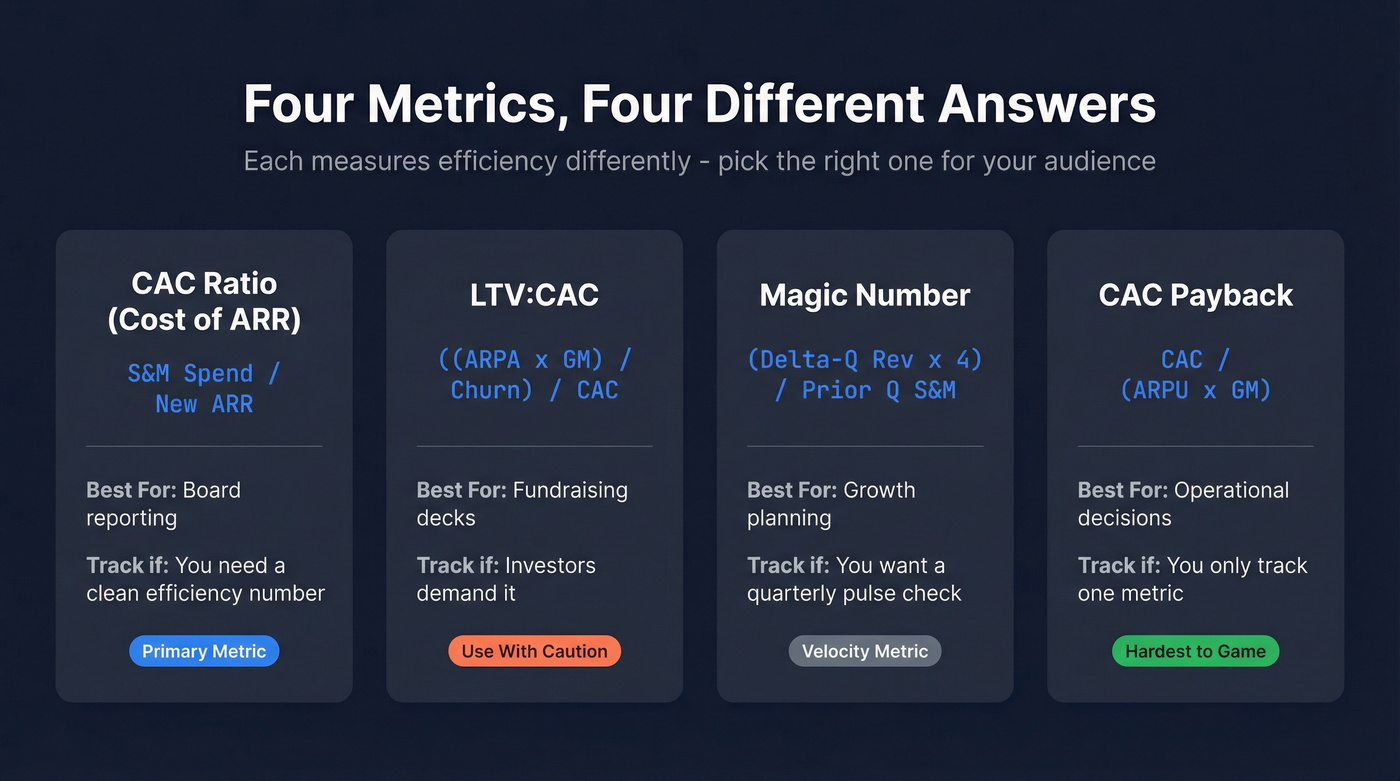
Four Metrics, Four Different Answers
| Metric | Formula | Best For | Track This If... |
|---|---|---|---|
| CAC Ratio (Cost of ARR) | S&M / New ARR | Board reporting | You need a clean efficiency number |
| LTV:CAC | ((ARPA x GM) / Churn) / CAC | Fundraising | Investors demand it |
| Magic Number | (Delta-Q Recurring Rev x 4) / Prior Q S&M | Growth planning | You want a quarterly pulse check |
| CAC Payback | CAC / (ARPU x GM) | Operational decisions | You only track one metric |
Here's the thing about LTV:CAC - it's the metric everyone quotes and nobody should trust. There's a classic example from r/analytics that keeps resurfacing: $40 ARPU, 10% churn, modeled LTV of $400, but realized customer spend averaged $160 before they churned. A 2.5x gap between theory and reality. We've seen this pattern repeatedly in board decks where a beautiful 4:1 ratio masked a 20-month payback period that was quietly bleeding the company dry.
Use the cost-of-ARR metric for board reporting. Use CAC Payback for operational decisions. Include LTV:CAC in fundraising decks because investors expect it, but treat it as the weakest of the three.
CAC Payback Benchmarks
Optifai's benchmark study (N=939 B2B SaaS, Q1-Q3 2025) gives the clearest segmented view:
| Segment | ACV Range | Payback (Months) |
|---|---|---|
| SMB | < $15K | 8-12 |
| Mid-Market | $15K-$100K | 14-18 |
| Enterprise | > $100K | 18-24 |
| Median (all) | - | 15 |
Best-in-class is under 12 months. Anything beyond 24 is critical territory. If you only track one metric, make it CAC Payback - it's the hardest to game and the easiest to act on.
How to Improve Your CAC Ratio
The new customer acquisition cost ratio rose 14% year-over-year. Every CFO we've talked to in the past year has the same complaint: "We're spending more and closing the same number of logos." Here are the levers that actually move the needle.
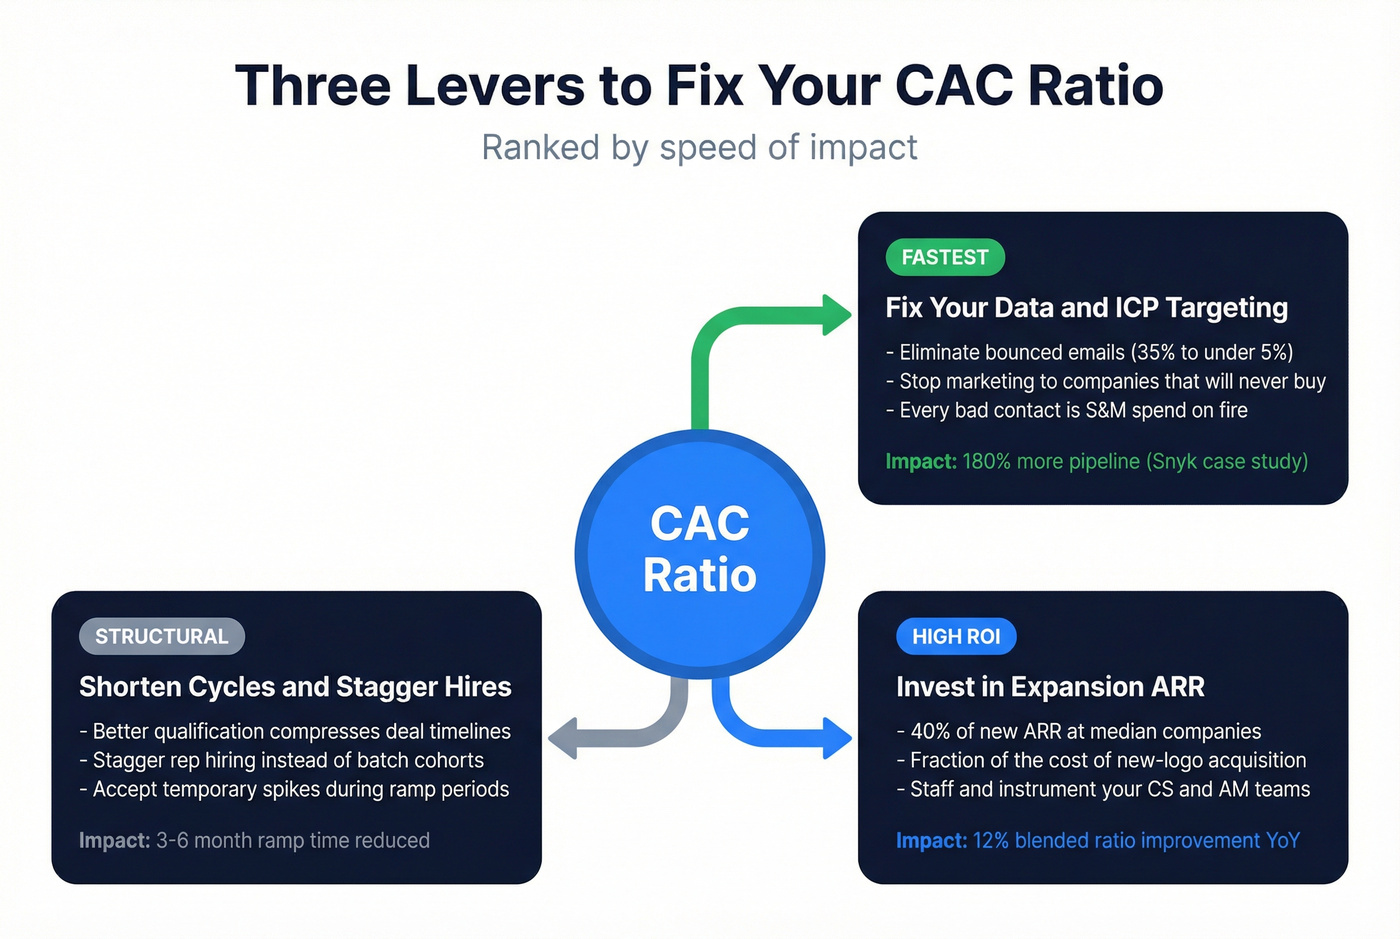
Tighten ICP Targeting and Fix Your Data
These two are inseparable. Every dollar spent marketing to companies that'll never buy is pure waste, and every bounced email is S&M spend you lit on fire. This is the fastest acquisition-efficiency lever most teams ignore - and it's frustrating how many companies skip it in favor of flashier tactics.
Snyk's team of 50 AEs was prospecting 4-6 hours per week with a 35-40% bounce rate before they switched to Prospeo's verified email data. Bounce rates dropped to under 5%, and AE-sourced pipeline jumped 180%. That's not a marginal improvement; that's a structural fix to their CAC ratio.

Invest in Expansion ARR
At 40% of total new ARR at the median company, expansion is the cheapest recurring revenue you'll ever generate. Your customer account management team's cost per dollar of expansion ARR is a fraction of new-logo acquisition. If your expansion motion isn't well-staffed and well-instrumented, you're leaving the easiest efficiency gains on the table.
Shorten Cycles and Stagger Hires
Better qualification and tighter handoffs compress time between spend and bookings. New reps take 3-6 months to ramp - stagger hires instead of batch-hiring a cohort, or accept a temporary efficiency spike every time you expand the team. For teams that run outbound at scale, skip this advice if your pipeline coverage is already 4x or above; the bottleneck is probably conversion, not volume.
Tighter ICP targeting is the fastest lever to fix your CAC ratio. Prospeo's 30+ search filters - buyer intent, technographics, headcount growth, funding - let you eliminate wasted spend before it hits your S&M line. At $0.01 per email, the math is obvious.
Cut acquisition costs by reaching only the accounts that will actually close.
FAQ
What is a good CAC ratio for SaaS?
A 1.0x ratio is healthy - spending $1 in S&M per $1 of new ARR. Below 0.5x signals underinvestment; above 2.0x means acquisition economics need work. The industry median sits at $2.00, though blended ratios that include expansion are improving.
Is CAC ratio the same as LTV:CAC?
No. The CAC ratio measures S&M cost per dollar of ARR acquired - it's backward-looking and grounded in actual spend. LTV:CAC relies on churn assumptions that often don't hold in practice. Different metrics, different questions, different reliability.
How can I lower my CAC ratio quickly?
Eliminate wasted spend first. Fix bad contact data to cut bounce rates, tighten ICP targeting so reps only work qualified accounts, and invest in expansion revenue - it costs a fraction of new-logo acquisition per ARR dollar.
What's the difference between CAC ratio and Magic Number?
The Magic Number uses quarter-over-quarter revenue growth annualized, divided by prior-quarter S&M spend - it's a velocity metric. The CAC ratio divides total S&M by new ARR bookings directly. Magic Number captures momentum; the cost-of-ARR ratio captures absolute efficiency. Most finance teams track both.