LTV to CAC Ratio: What It Really Means (and Why Your Number Is Probably Wrong)
You just pulled your LTV to CAC ratio for the board deck. It says 4.2:1. Looks healthy. But the LTV formula assumes your customers stick around for 10 years, and your company's been selling for three. Your CAC doesn't include the two SDRs you hired in Q2 or the $14k/month you're spending on tools. The real ratio? Closer to 2:1 - and that changes every decision downstream.
What the Ratio Actually Tells You
The LTV to CAC ratio measures how much revenue a customer generates over their lifetime relative to what it cost to acquire them. Divide customer lifetime value by customer acquisition cost, and you get a multiplier that shows whether your go-to-market engine is building value or burning cash.
Operators use it to gauge channel efficiency and justify spend. Investors use it to assess whether a business model is fundamentally viable. A ratio of 3:1 means you're generating $3 in customer value for every $1 spent on acquisition - the textbook "good" number.
But textbooks don't run companies. The metric forces a conversation between two sides of the business that rarely sit in the same room: revenue (how much do customers pay and for how long?) and growth (how much does it cost to get them in the door?). When those two numbers are honest, the ratio is genuinely useful. When they're not - and they usually aren't - the ratio becomes a comfortable lie.
The Short Version
- The 3:1 benchmark is a starting point, not a target. Pre-product-market-fit, 2:1 is fine. Post-PMF, aim for 3-4:1. Above 5:1, you're under-investing.
- Most companies overstate LTV and understate CAC. The standard formula can overestimate real customer value by 2-3x. If your CAC doesn't include salaries, tools, and overhead, it's 30-50% too low.
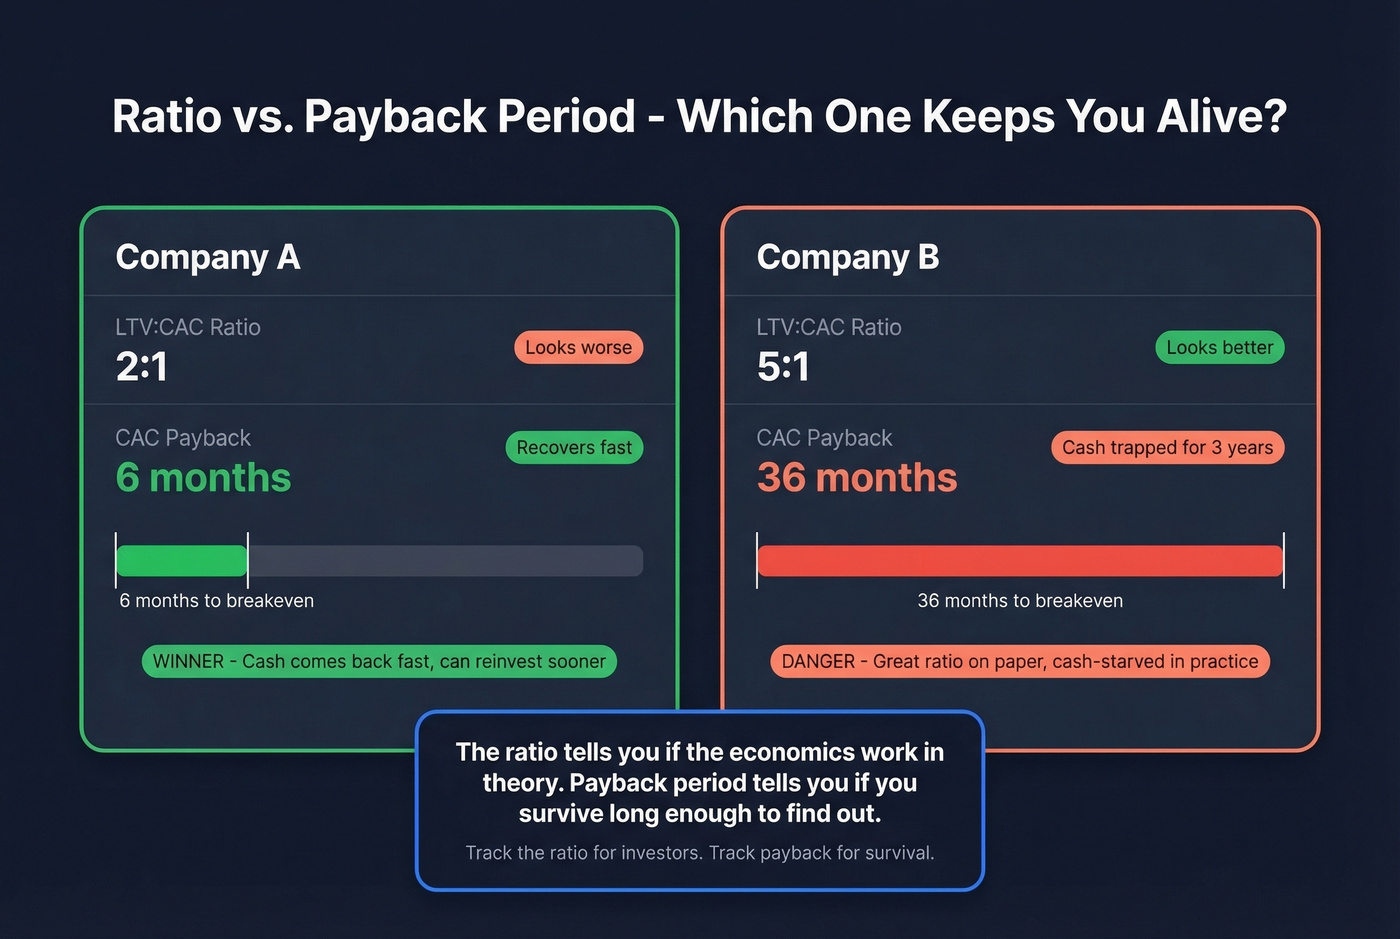
- Track the ratio for investors. Track CAC payback period for survival. A 2:1 ratio with 6-month payback beats a 5:1 ratio with 36-month payback every time.
How to Calculate LTV
The simple formula everyone starts with:
LTV = ARPU / Monthly Churn Rate
If your average revenue per user is $50/month and your monthly churn rate is 5%, your LTV is $1,000. Clean, elegant, and almost certainly wrong.
The gross-margin-adjusted version is more honest:
LTV = (ARPU x Gross Margin) / Monthly Churn Rate
Same example: $50 ARPU, 75% gross margin, 5% churn. That gives you $750 - already 25% lower. Most companies skip the gross margin adjustment, which means they're making acquisition decisions based on revenue they don't actually keep.
A quick worked example. B2B SaaS company with $200/month ARPU, 80% gross margin, and 3% monthly churn:
- Simple LTV: $200 / 0.03 = $6,667
- Margin-adjusted LTV: ($200 x 0.80) / 0.03 = $5,333
Here's what most guides skip: the 1/churn calculation implies a customer lifetime of 33 months. If your company has only existed for 18 months, you're projecting a lifetime you've never observed. That's not calculating - it's forecasting with a confidence you haven't earned.
Net Churn vs. Gross Churn
This distinction matters more than most teams realize.
Gross churn measures revenue lost from downgrades and cancellations, excluding expansion. It's useful when you want to isolate retention and contraction problems. Net churn factors expansion and contraction into the same number. In land-and-expand models where net revenue retention is above 100%, net churn goes negative - and net-churn-based LTV models blow up to infinity. Mathematically correct. Practically useless. When that happens, teams usually cap customer lifetime at a fixed 3-5 year window to keep the model grounded.
Build Cohort LTV Instead
The ARPU/churn shortcut treats all customers as identical. They aren't.
A better approach: build cohort-based LTV from three fields in your CRM - Customer ID, First Transaction Date, and Transaction Amount. Group customers by the month they signed up, build a retention grid showing what percentage of each cohort is still paying in months 1, 2, 3, and so on, then forecast the curve's tail using a flattening function (LOGEST in Excel works). This gives you an LTV grounded in observed behavior, not theoretical assumptions.
If you want to go deeper on retention math, start with a proper churn analysis and align on what is churn across teams.
How to Calculate CAC
The basic formula:
CAC = Total Sales & Marketing Spend / New Customers Acquired
The hard part is defining "total sales & marketing spend." The costs are scattered across departments, tools, and budget lines that nobody thinks of as "acquisition costs."
If you need a full breakdown of what belongs in the numerator, see our guide to cost to acquire customer.
Three Versions of CAC
You should track three distinct CAC numbers:
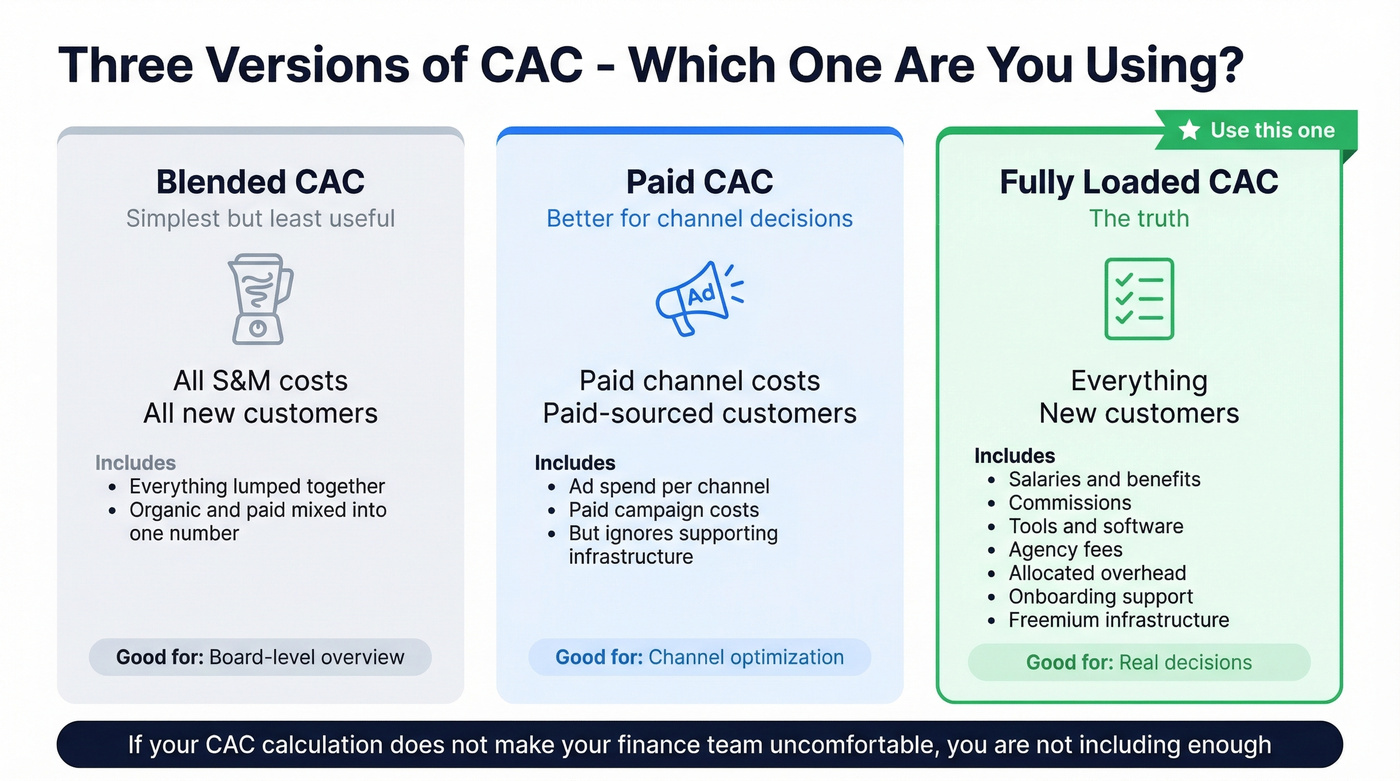
Blended CAC divides all sales and marketing costs by all new customers. Simplest, least useful for optimization - it mixes organic and paid channels into one number.
Paid CAC isolates paid-channel costs against paid-sourced customers. Tells you whether your ad spend works, but ignores the infrastructure supporting those campaigns.
Fully-loaded CAC includes everything: salaries, benefits, commissions, tools, agency fees, allocated overhead, onboarding support, even freemium infrastructure. This is the number that tells you the truth - and the one that makes your ratio meaningful.
The Full Cost Checklist
What belongs in fully-loaded CAC that most companies leave out:
- Marketing - ad spend, content production, software subscriptions (marketing automation, analytics, ABM platforms), agency and consultant fees
- Sales - base salaries, benefits, commissions, CRM licenses, sales engagement tools, travel, trade shows
- Overhead - onboarding-related support costs, freemium infrastructure, marketing spend aimed at converting free users to paid
One SaaS-focused breakdown pegs average reported CAC around $702. That average hides enormous variance. We've seen teams discover their fully-loaded CAC was 40% higher than their blended number once they added SDR salaries and tool costs. Here's the thing: if your CAC calculation doesn't make your finance team uncomfortable, you're not including enough.
The Complete Formula Walkthrough
Let's put both calculations together with a single example.
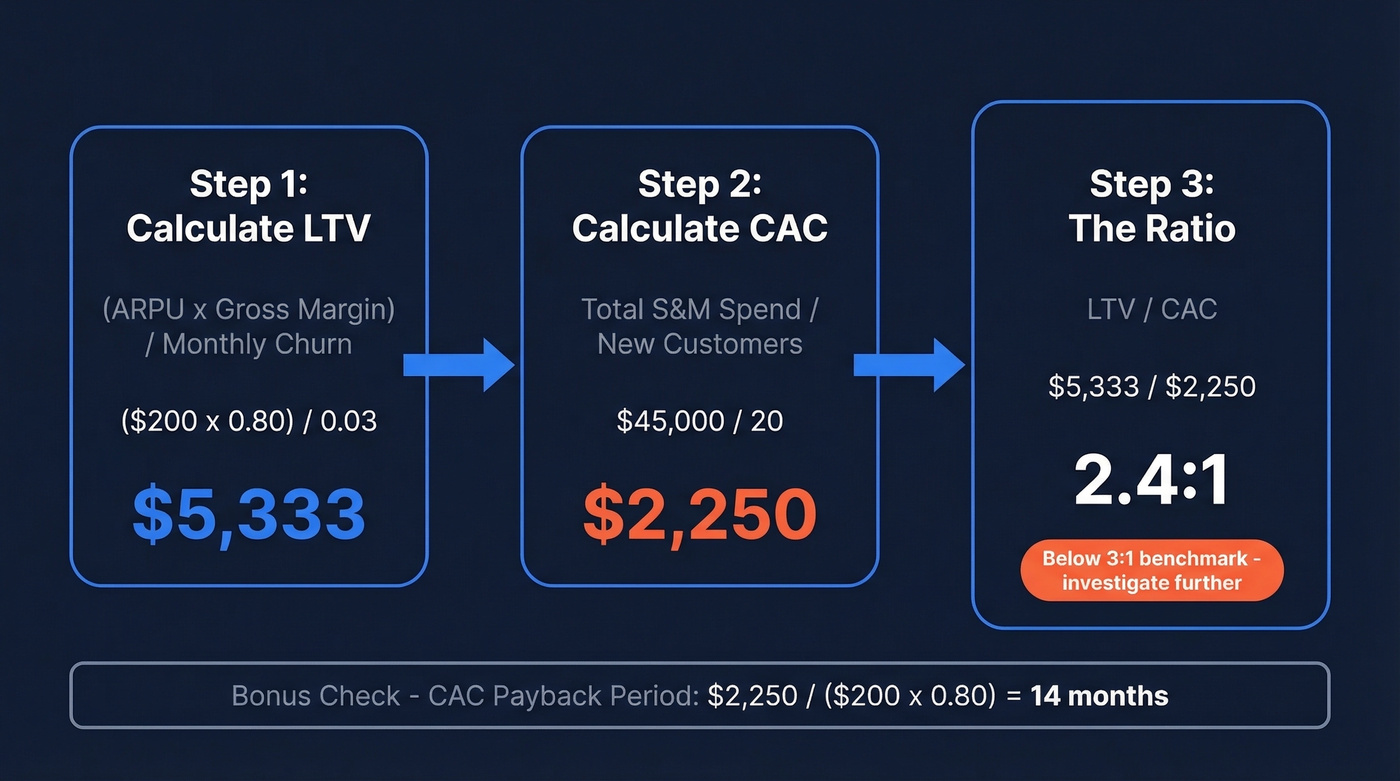
The inputs:
- ARPU: $200/month | Gross margin: 80% | Monthly churn: 3%
- Monthly S&M spend: $45,000 | New customers per month: 20
Step 1 - LTV: ($200 x 0.80) / 0.03 = $5,333
Step 2 - CAC: $45,000 / 20 = $2,250
Step 3 - Ratio: $5,333 / $2,250 = 2.4:1
That's below the 3:1 benchmark. But check the payback period before you panic: $2,250 / ($200 x 0.80) = 14 months. Not great, but not catastrophic for a growth-stage company. The ratio alone doesn't tell you whether to worry - the payback period tells you how urgently.
Your LTV to CAC ratio improves from both sides. Prospeo cuts acquisition costs by giving your SDRs 98% accurate emails and 125M+ verified mobile numbers - so reps connect faster, pipelines fill sooner, and CAC payback shrinks. Teams using Prospeo book 26% more meetings than ZoomInfo users at 90% lower cost per lead.
Fix the CAC side of your ratio for $0.01 per verified email.
What's a Good Ratio?
The 3:1 Baseline
The 3:1 benchmark is the most widely cited target in SaaS. Below 2:1, you're overspending or churning too fast. Above 5:1, you're under-investing in growth.
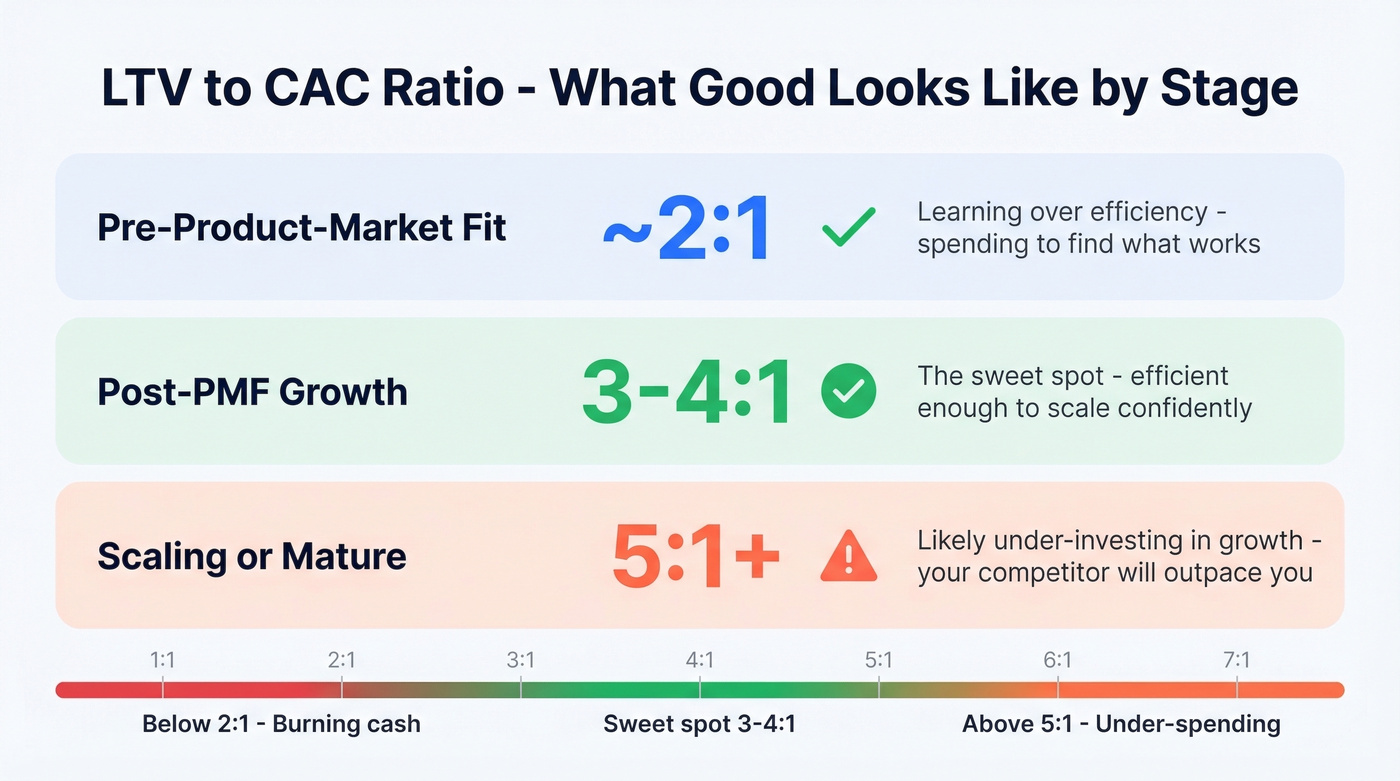
But the "right" ratio depends on your stage. A practitioner breakdown from r/SaaS frames it well:
| Stage | Target Ratio | Why |
|---|---|---|
| Pre-PMF | ~2:1 | Learning over efficiency |
| Post-PMF growth | 3-4:1 | Sweet spot for scaling |
| Scaling/mature | Rarely above 5:1 | Likely under-investing |
A Series A company at 2.5:1 with strong retention trends is healthier than a bootstrapped company at 6:1 that's afraid to spend on growth.
Industry Benchmarks
First Page Sage compiled LTV, CAC, and ratio benchmarks across 29 industries with data spanning 2019-2024. Their dataset skews toward midsized and larger companies with 68% organic channels and 74% B2B, so earlier-stage businesses should expect lower ratios.
| Industry | Avg LTV | Avg CAC | Ratio |
|---|---|---|---|
| B2B SaaS | $956 | $239 | 4:1 |
| B2C SaaS | $583 | $233 | 2.5:1 |
| eCommerce | $255 | $84 | 3:1 |
| Cybersecurity | $1,712 | $429 | 4:1 |
| Commercial Insurance | $2,975 | $595 | 5:1 |
The takeaway isn't "hit 4:1 because that's the B2B SaaS average." Your ratio varies dramatically by vertical, and comparing your SaaS startup to an insurance company's unit economics is meaningless. Find your industry, find your stage, and benchmark against peers.
Why the Standard Formula Lies
The $400 vs. $160 Problem
A company on r/analytics ran the standard LTV formula: $40 ARPU, 10% monthly churn. The math says LTV = $400.
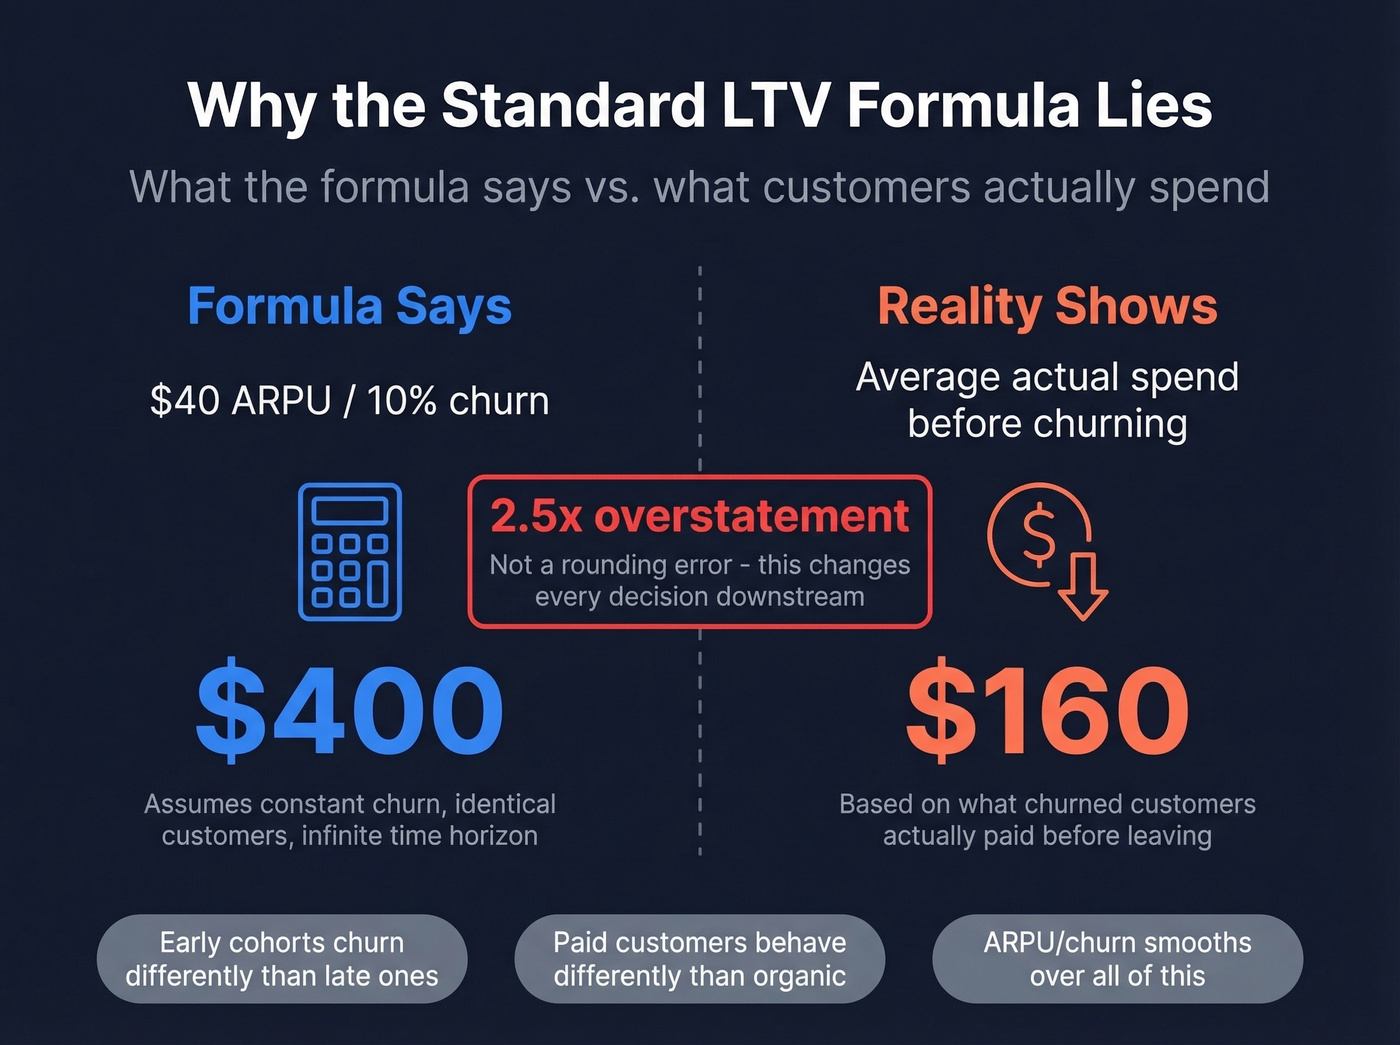
Then they looked at what churned customers actually spent before leaving. The average was $160. The formula overstated real customer value by 2.5x - that's not a rounding error. It's the difference between a profitable channel and a money pit.
The formula assumes churn is constant and customers behave identically. Neither is true. Early cohorts churn differently than late cohorts. Customers acquired through paid channels behave differently than organic signups. The ARPU/churn shortcut smooths over all of this and hands you a number that feels precise but isn't.
The Compound Metric Trap
This ratio is a compound metric built on interdependent inputs. Raising ARPU can increase churn - customers paying more expect more and leave faster when disappointed. Pushing growth harder raises CAC. Expanding into new segments changes both simultaneously.
As OnlyCFO puts it, the ratio is like a mini-DCF: theoretically elegant, practically easy to misuse. If your company is three years old and your formula assumes a 15-year customer lifetime, you're not calculating - you're fantasizing.
Companies run out of money all the time with theoretically good ratios. The ratio doesn't pay your bills. Cash does.
When a High Ratio Is a Red Flag
A 7:1 ratio sounds like a dream. One SaaS founder described exactly this on Reddit: their client had a "perfect" 7:1 number that was actually killing growth. A competitor running at ~3:1 scaled faster and raised a Series B.
The math is simple. If you're generating $7 for every $1 spent on acquisition, you could spend $2 or $3 more per customer and still have excellent unit economics - while growing twice as fast. A sky-high ratio often signals timidity, not efficiency. Skip the self-congratulation and invest.
Ratio vs. Payback Period
The LTV to CAC ratio tells you whether the economics work in theory. The CAC payback period tells you whether you'll survive long enough to find out.
CAC Payback Period = CAC / (Monthly MRR per Customer x Gross Margin)
Using our earlier example: $2,250 / ($200 x 0.80) = 14 months. That means it takes over a year to recoup the cost of acquiring each customer. For cash-constrained teams, that's a problem regardless of what your ratio says.
| Metric | Best For | Benchmark |
|---|---|---|
| LTV:CAC ratio | Investor decks, viability | 3:1+ |
| CAC Payback | Cash planning, survival | 12 months or less |
| Elite Payback | Top-tier SaaS per Bessemer | 5-7 months |
A thread on r/SaaS nails the distinction: a 2:1 ratio with 6-month payback beats a 5:1 ratio with 36-month payback, because the 36-month payback ties up cash you don't have. Track the ratio for your board deck. Track payback period for your bank account.
If you're operationalizing this, it helps to map LTV:CAC and payback into broader funnel metrics and ongoing sales operations metrics.
How to Improve Your Ratio
Two levers: spend less to acquire customers, or make customers worth more.
Cut Your CAC
The fastest CAC reduction doesn't come from renegotiating ad rates. It comes from eliminating waste - and the biggest source of waste in outbound sales is bad data.
We've seen this play out across dozens of outbound teams: a team runs 10,000 emails through a sequence, bounce rates spike to 25%, deliverability tanks, and the domain gets flagged. Every subsequent campaign performs worse, and the effective CAC for every customer acquired through email climbs. The data vendor didn't charge more, but the cost of acquisition skyrocketed anyway.
Prospeo fixes this at the source - 98% email accuracy, a 7-day data refresh cycle, and 5-step verification that catches spam traps and honeypots. Snyk ran 50 AEs through Prospeo's data and watched their bounce rate drop from 35-40% to under 5% while AE-sourced pipeline grew 180%. Same team, same budget, dramatically more customers acquired. That's a direct CAC reduction.
If you're seeing bounces climb, start with email bounce rate and a full email deliverability guide before you scale volume.
Beyond data quality, track fully-loaded CAC by channel, not just blended. You might discover that your "expensive" paid channels are actually cheaper per acquired customer than your "free" content marketing once you factor in the content team's salaries.
Grow Your LTV
Reducing churn is the highest-leverage LTV improvement. A 5% improvement in retention can boost profits 25-95%. Focus on onboarding - the first 30 days predict most churn - and proactive customer success for accounts showing usage decline.
Expansion revenue is the other lever. Upsells and cross-sells increase ARPU without increasing CAC. If your net revenue retention is above 110%, your existing customers are effectively doing your growth team's job.
If you want a clearer framework for expansion motions, see cross-selling vs up-selling.
Here's why cohort segmentation matters more than blended averages. Imagine two customer segments: Early Adopters bring $300 ARPU with 2% monthly churn, implying an LTV of $15,000. Scale Cohort customers pay $150 with 8% monthly churn - an implied LTV of just $1,875. Blended together at average ARPU of $225 and average churn of 5%, you'd calculate an LTV of $4,500. That number understates your best customers and overstates your worst ones. If you're spending the same CAC to acquire both segments, you're subsidizing unprofitable customers with profitable ones. Segment your LTV by cohort, then allocate acquisition spend accordingly.
Fully-loaded CAC includes every tool your sales team touches. Prospeo replaces expensive data vendors at $0.01/email with 98% accuracy - no contracts, no sales calls. One platform covers emails, direct dials, intent data, and CRM enrichment. Fewer tools, lower overhead, better ratio.
Stop inflating CAC with overpriced data tools you don't need.
FAQ
What's a good LTV to CAC ratio for SaaS?
The standard benchmark is 3:1 - you generate $3 in customer value for every $1 spent on acquisition. Pre-product-market-fit, ~2:1 is acceptable while you're still learning. Post-PMF, aim for 3-4:1. Above 5:1 typically signals you're under-investing in growth and leaving market share on the table.
How do you calculate the ratio?
Divide customer lifetime value by customer acquisition cost. LTV = (ARPU x gross margin) / monthly churn rate. CAC = total sales and marketing spend / new customers acquired. Always use fully-loaded CAC - including salaries, tools, and overhead - for the most accurate result.
Why is my ratio misleading?
The standard LTV formula often overstates real customer value by 2-3x because it assumes constant churn and identical customer behavior across segments. A high ratio with a 36-month payback period can still kill your cash flow. Always pair it with CAC payback period for a complete picture.
How does data quality affect CAC?
Bounced emails and outdated contacts inflate your acquisition cost without adding customers. A 25% bounce rate means a quarter of your outbound budget is wasted. Cleaning up your data pipeline - whether through better verification, fresher records, or both - directly reduces effective CAC and improves your ratio without touching the LTV side of the equation.