What Is Churn? Definition, Formulas & Benchmarks (2026)
Churn is the rate at which customers stop doing business with a company over a given period. If you've ever wondered why every SaaS board obsesses over it, the answer is simple: it's the single metric that determines whether growth compounds or collapses.
In subscription businesses, churn rate is calculated by dividing the number of customers lost during a period by the total number at the start, then multiplying by 100. Lose 50 customers out of 1,000 in a month and you're looking at 5% monthly churn.
Customer attrition costs U.S. businesses $168 billion per year. That's the cumulative cost of customers walking out the door while companies spend six times more replacing them than it would've cost to keep them - and most teams measuring this metric are using the wrong formula. There are over 40 variants. Pick the wrong one and everything downstream gets distorted.
Three things to know right now:
- A 5% decrease in churn can boost revenue by 25-95%. Retention compounds.
- New customers spend 67% less than returning ones. Losing customers doesn't just shrink your count - it replaces high-value buyers with low-value ones.
- Most churn advice is useless because it's not segmented by unit economics. A 15% monthly rate can be fine or fatal depending on your ACV and payback period.
Need the formula? Jump to How to Calculate Churn Rate. Want to know if your number is normal? Jump to Churn Rate Benchmarks.
Churn Definition in Business
At its simplest, churn measures how many customers you're losing. The term applies anywhere there's a recurring relationship - SaaS, telecom, banking, retail subscriptions, streaming, insurance. If someone was paying you and then stopped, that's churn.
In finance, "churning" also refers to illegal excessive trading in a brokerage account - a different concept entirely, but one that shares the same root word. The business meaning always comes back to customer loss and its downstream impact on revenue.
Here's the thing: for any business to grow, its growth rate must exceed its attrition rate. Sounds obvious. It's the constraint most growth plans ignore.
Why Does Customer Churn Matter?
Acquiring a new customer costs six times more than retaining an existing one. Returning customers spend more. Every churned customer gets replaced by someone who buys less.
That 25-95% revenue boost from a 5% churn reduction isn't theoretical - it's the compounding effect of keeping customers who already trust you and already have a higher propensity to expand. Retention revenue is the cheapest revenue you'll ever earn.
The flip side is equally real. If customers leave before you recoup acquisition cost, your CAC payback period stretches toward infinity. We've seen teams celebrate "record new bookings" while net revenue flatlines because the back door is wide open. Growth without retention is just expensive attrition.
Types of Churn
Before you can fix the problem, you need to know which flavor you're dealing with.
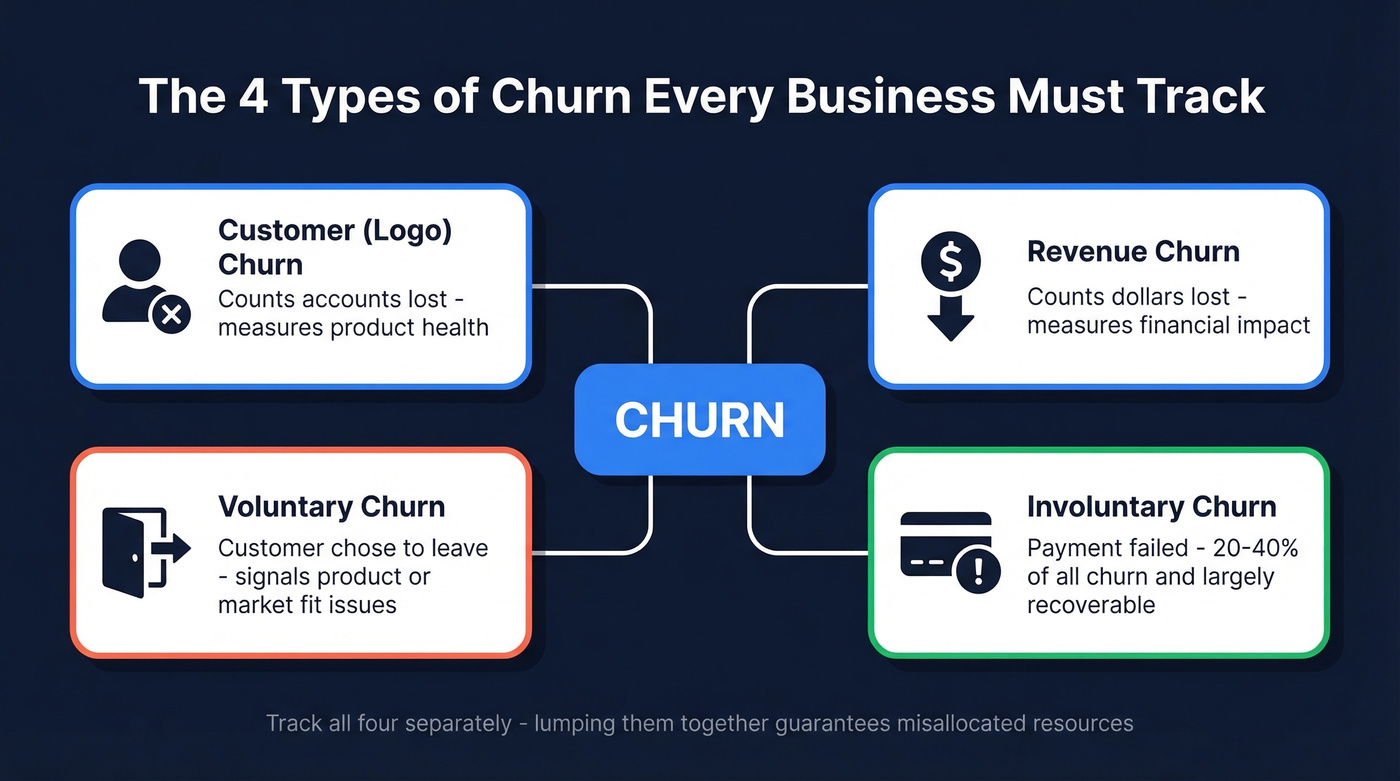
| Type | What It Measures | When to Use It |
|---|---|---|
| Customer (logo) | Accounts lost | Product health |
| Revenue | Dollars lost | Financial impact |
| Voluntary | Customer chose to leave | Product/market fit |
| Involuntary | Payment failure | Billing recovery |
Customer Churn vs Revenue Churn
Logo churn counts heads. Revenue churn counts dollars.
A company can lose 50 small accounts in a month - ugly logo churn - while revenue stays flat because three enterprise accounts expanded. Conversely, losing one whale can tank revenue churn while logo churn looks fine. You need both metrics: one tells you about product satisfaction, the other about financial health.
Voluntary vs Involuntary Churn
Involuntary churn accounts for 20-40% of total churn and is largely recoverable. These are customers whose card expired or whose payment hit a soft decline - they didn't choose to leave.
Voluntary churn means the customer decided to go: price, competition, bad experience, or they simply outgrew you. The fix for each is completely different, which is why lumping them together in a single metric guarantees you'll misallocate resources.
Gross vs Net Revenue Churn
Start with $500K MRR. End the month at $425K MRR, and existing customers upgraded by $100K during the same period.
Gross revenue churn = ($500K - $425K) / $500K = 15%. That's the revenue you lost, excluding expansion.
Net revenue churn = ($500K - $425K - $100K) / $500K = -5%. That negative sign is the gold standard in SaaS - expansion from existing customers exceeded losses. Every SaaS company should aspire to negative net churn and track net revenue retention alongside it.
Which Metric Goes in the Board Deck?
MRR churn tracks the monthly recurring revenue impact. Logo churn tracks the raw count of accounts lost. For investor reporting, revenue churn dominates - it drives valuation multiples. For product teams, logo churn is the canary. A spike in logo churn among a specific cohort tells you something product-level is broken, even if revenue churn looks fine.
In our experience, the best operators report both side by side and refuse to let one mask the other.
How to Calculate Churn Rate
Three formulas cover 90% of use cases.
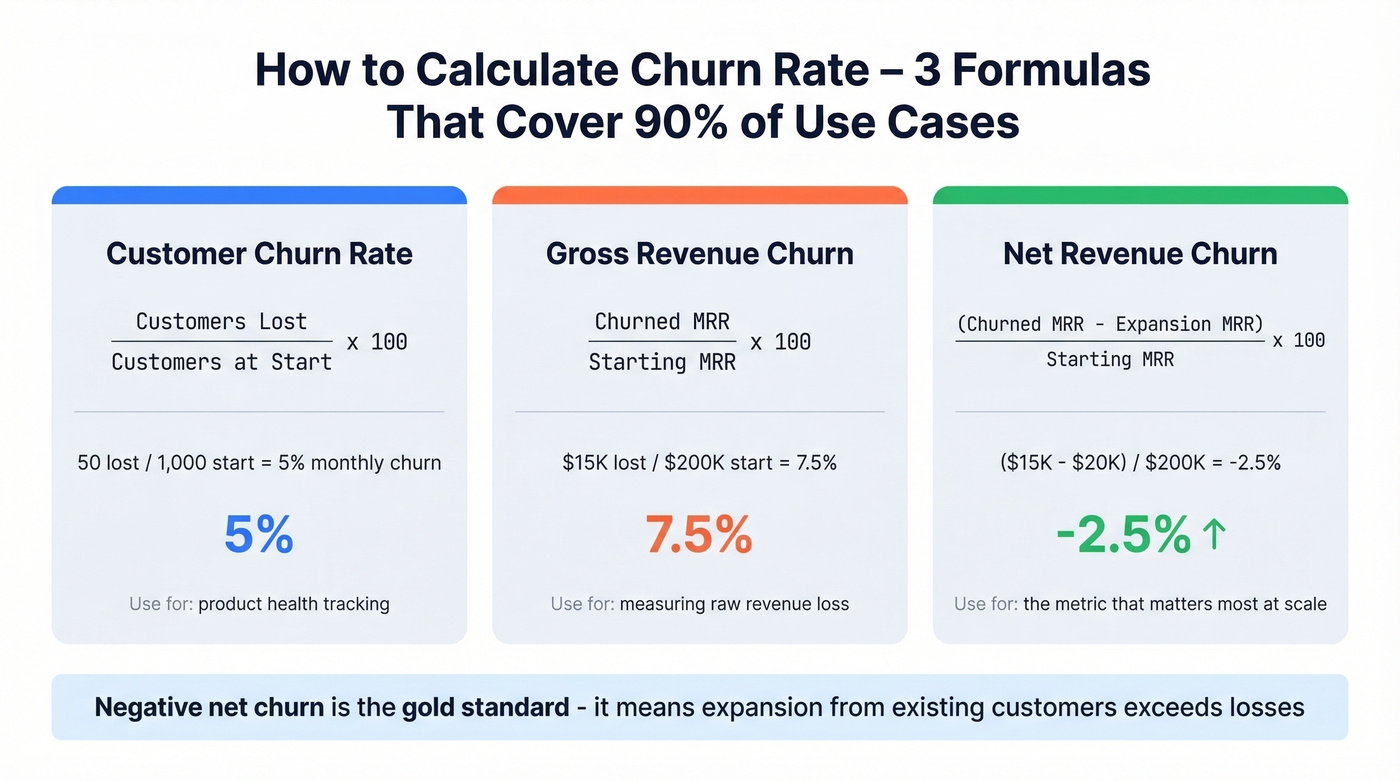
| Metric | Formula | Example |
|---|---|---|
| Customer churn | Lost / Start x 100 | 50 / 1,000 = 5% |
| Gross revenue churn | Churned MRR / Start MRR x 100 | $15K / $200K = 7.5% |
| Net revenue churn | (Churned - Expansion) / Start MRR x 100 | ($15K - $20K) / $200K = -2.5% |
Customer churn rate: You started January with 1,000 customers and lost 50 by month's end. That's 5% monthly customer churn.
Gross revenue churn rate: Your beginning MRR was $200K. Cancellations and downgrades accounted for $15K in lost MRR. That's 7.5%.
Net revenue churn rate: Same $15K in losses, but existing customers expanded by $20K through upsells and seat additions. Net churn = -2.5%. You're growing from within. This is the formula that matters most for SaaS businesses at scale because it captures losses, contractions, and expansions in a single number. (If you want a deeper walkthrough, see churn rate formula and how to calculate churn.)
Replacing churned customers costs 6x more than keeping them - and it costs even more when your prospecting data bounces. Prospeo delivers 98% verified email accuracy on a 7-day refresh cycle, so every dollar you spend acquiring replacements actually lands.
Stop refilling a leaky bucket with bad data.
Churn Rate Benchmarks
By Industry
Attrition rates vary wildly by sector. What's catastrophic in healthcare is Tuesday in hospitality.
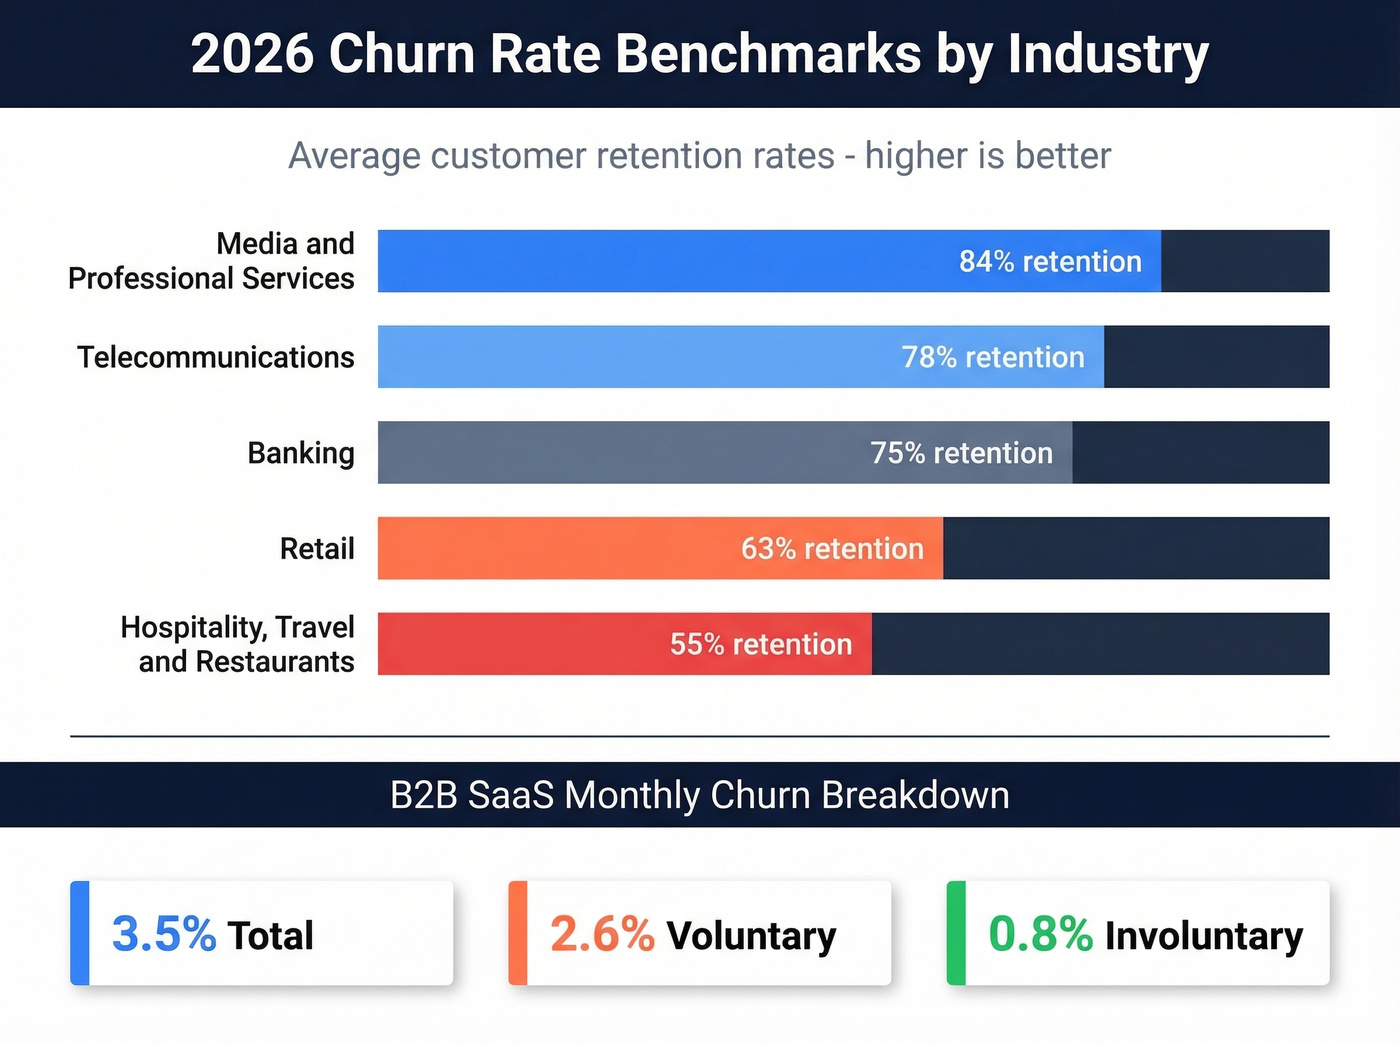
| Industry | Avg Retention |
|---|---|
| Media & professional services | 84% |
| Telecommunications | 78% |
| Banking | 75% |
| Retail | 63% |
| Hospitality / travel / restaurants | 55% |
For B2B SaaS specifically, the average monthly churn rate is 3.5% - split between around 2.6% voluntary and 0.8% involuntary. We've found that teams obsessing over a single number without segmenting by ARPU are always surprised when they dig deeper:
| ARPU Tier | User Churn | Revenue Churn |
|---|---|---|
| Under $10 | 6.2% | 6.7% |
| $25-$50 | 7.3% | 8.6% |
| Over $250 | 5.0% | 6.5% |
If you want more segment-level context, compare against SaaS churn rate benchmarks and what is a good churn rate.
Is High Churn Always Bad?
A Reddit founder posted about running 15% monthly churn while staying profitable with 25% month-over-month growth. The math: $50 CAC, $400 LTV, average customer stays 8 months. The unit economics worked despite attrition that would make most SaaS advisors faint.
If your deal size is under $5K and your payback period is under 60 days, churn rate is the wrong metric to lose sleep over. Focus on net revenue retention instead. Attrition targets without unit economics context are meaningless.
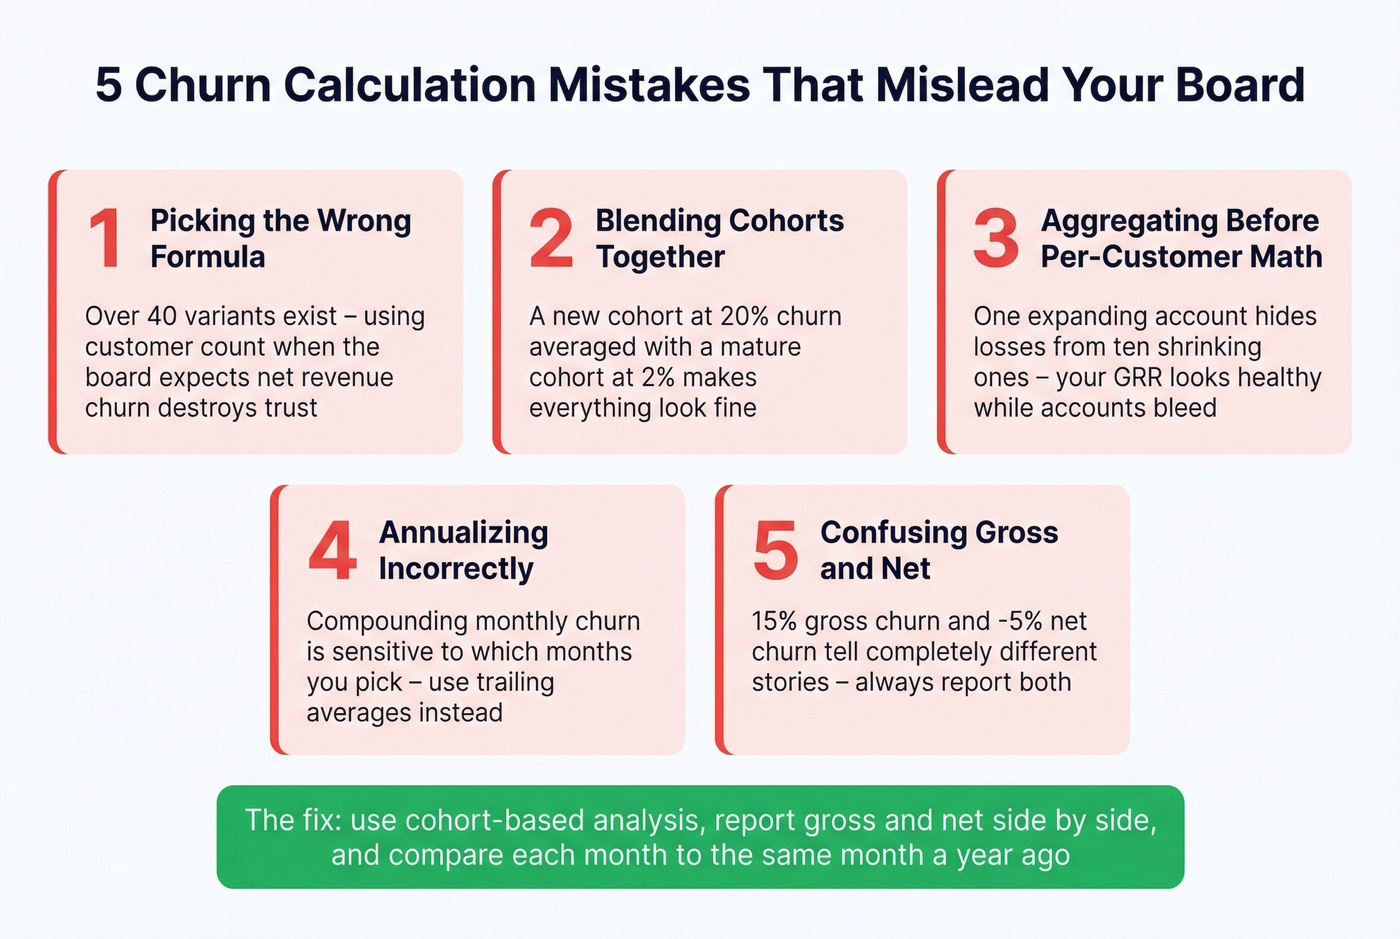
Churn Calculation Mistakes
Your deck says 3% monthly. Your investors calculate 31% annual. The room goes quiet.
Here's how that happens.
Picking the wrong formula. With over 40 calculation variants, using customer count churn when your board expects net revenue churn creates a math dispute that erodes trust fast.
Blending cohorts. A new cohort churning at 20% gets averaged with a mature cohort at 2%, and the blended number looks "fine." In our experience, the cohort-versus-blended mistake is the one that burns teams most often. Use cohort-based analysis or you're flying blind.
Aggregating before per-customer math. You need to calculate retention per customer before summing. Aggregating first lets expansion from one account cover up losses from another - your GRR looks healthy while individual accounts bleed out. SaaS Capital has a detailed breakdown of why this misleads.
Annualizing incorrectly. Compounding monthly churn to get annual churn is extremely sensitive to which months you pick. Compare each month's revenue to the same month a year ago, and use 3-, 6-, and 12-month trailing averages to smooth volatility. (If you're reporting to a board, it helps to standardize on an annual churn rate definition.)
Confusing gross and net. Gross revenue churn of 15% and net revenue churn of -5% tell completely different stories. Report both. Showing only net hides raw attrition; showing only gross ignores the expansion keeping the business healthy.
What Causes Churn?
Price is the biggest trigger. 71% of businesses cite price increases as the number-one reason for customer loss, and 72% of customers will switch to a competitor after a single bad experience. Those two stats alone explain most voluntary churn.
But there are subtler causes. Poor onboarding leaves customers confused about value. Product-market misfit means you acquired someone who was never going to stick. And one limitation of churn as a metric: it doesn't tell you which customers are leaving - new versus long-term - which makes diagnosis harder without cohort analysis.
Then there's the silent churn accelerator most teams never trace back to its source: bad data. Your SDR team sends 5,000 emails, 800 bounce, your domain reputation tanks, and suddenly your re-engagement campaigns land in spam. That's attrition you'll never attribute correctly because it happened upstream, in your contact data. Tools like Prospeo exist specifically to prevent this cascade - 98% email accuracy and a 7-day data refresh cycle catch stale records before they enter your system.
How to Reduce Churn
Voluntary Prevention
The most effective reduction tactic isn't a better cancellation flow - it's refusing to acquire bad-fit customers in the first place.
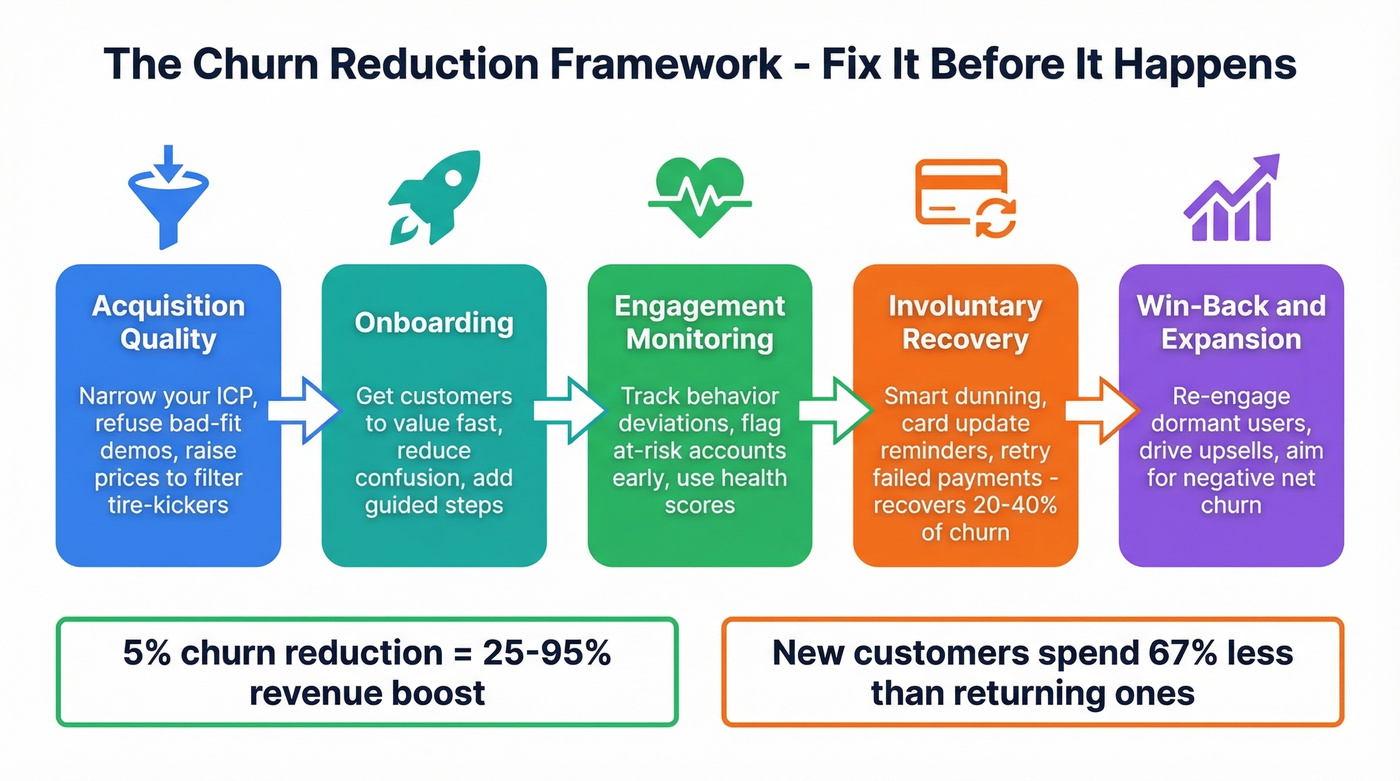
A SaaS operator on r/SaaS shared six tactics that drove their lowest-ever monthly churn: narrowing ICP messaging, refusing demos for non-fit prospects, adding onboarding steps, and - counterintuitively - raising prices to filter out customers who'd leave in month one. The consensus in that thread was clear: acquisition quality drives retention quality.
Box operationalized this at enterprise scale across their 115,000 customers. Their CS team monitors behavior pattern deviations as early warning signals, treats executive turnover as a major risk factor, and standardizes risk into T-shirt sizes so every account team speaks the same language. Churn reduction at scale requires systematized risk detection, not heroic saves.
Recover Involuntary Churn
Involuntary churn is 20-40% of total attrition, and it's the easiest win most companies ignore.
Payment failures cause about 25% of lapsed subscriptions. Distinguish soft declines from hard declines, automate the recovery flow with dunning sequences, and stop leaving revenue on the table. Recurly's ML-based approach drives a 55.4% reduction in involuntary churn. If you're not running automated payment retries with smart timing, you're burning money.
Fix Your Data
Contact data degrades constantly - people change jobs, emails go stale, phone numbers rotate. When your outreach bounces, your domain reputation drops. When your domain reputation drops, even your retention emails stop landing.
Fix your data before you optimize your cancellation flow. A clean contact database with verified emails and a fast refresh cycle catches stale records before they cause damage. Fixing involuntary churn alone can lift revenue by 8.6% in year one. If bounces are part of your churn story, it’s worth reviewing email authentication and email reputation services.
Negative net churn requires expansion from existing accounts - but it also requires a pipeline that keeps filling with real buyers. Prospeo gives you 300M+ verified profiles with 30+ filters including buyer intent and headcount growth, at $0.01 per email.
Build pipeline that outpaces attrition for a fraction of ZoomInfo's cost.
Churn Prediction
The global customer churn software market sits at $15B and is projected to reach $45B by 2033.
The most common models in production: logistic regression for fast, interpretable baselines; random forests for non-linear patterns; gradient boosting (XGBoost, LightGBM) as the accuracy winner in most benchmarks; and deep learning for the highest ceiling - one banking study achieved 91% recall. The features that matter most are login frequency, feature usage depth, support ticket volume, transaction recency, contract renewal dates, and NPS/CSAT scores. Behavioral signals consistently outperform demographic ones.
Real talk: you don't need a custom ML model to start. Most churn analysis platforms offer built-in prediction scores. Match the sophistication to your scale - skip the custom model if you have fewer than 5,000 customers and limited data science resources.
FAQ
What is a good churn rate?
B2B SaaS averages 3.5% monthly; consumer SaaS runs 6.5-8%. Enterprise SaaS with annual contracts often targets low single-digit annual logo churn and 100%+ net revenue retention. Always segment by ARPU and contract type before comparing to any benchmark.
What is negative churn?
Negative net revenue churn means expansion revenue from existing customers exceeds lost revenue from churned ones. Companies achieving it typically have strong upsell paths, usage-based pricing, or seat expansion built into their product. It's the gold standard for SaaS unit economics.
How is churn different from retention?
They're inverses. If monthly retention is 95%, monthly churn is 5%. But with mixed contract lengths and varying revenue per account, the math isn't always a clean mirror. Track both - gross retention and net retention tell different stories about business health.
What's the fastest way to reduce churn?
Fix involuntary churn first - it's 20-40% of total attrition and largely recoverable through dunning sequences and smart payment retries. Then make sure your contact data is accurate so re-engagement emails actually land. These two moves require no product changes and show results within weeks.