Net Revenue Retention: The Metric Everyone Tracks and Almost Nobody Calculates Correctly
A RevOps lead we know presented 118% NRR to the board last quarter. Everyone celebrated. Then someone pulled out the single enterprise account that expanded from $50k to $300k, and the number dropped to 95%. The board stopped celebrating.
That gap between the headline number and reality is where most SaaS companies live - and it's why net revenue retention deserves more scrutiny than it typically gets.
What Is NRR?
Net revenue retention (NRR) - also called net dollar retention (NDR) - measures how much recurring revenue you keep and grow from your existing customer base over a given period. It captures expansion revenue from upsells, cross-sells, and seat additions, minus contraction from downgrades, minus churn from lost customers. New logos don't count.
That's the clean version. The messy version is that every company defines "existing customer," "expansion," and even "revenue" slightly differently. The formula is simple. The implementation is a disaster.
The Short Version
The formula is straightforward, but cohort definitions, reactivation rules, and usage-based pricing all create edge cases that change your number materially. Get the methodology right before you obsess over the output.
Stop benchmarking against IPO-era numbers. Median public SaaS NDR is 108% as of early 2026, not 125%. Snowflake's 158% NDR was from 2020. It's not your target.
A single blended NRR is almost useless. Segment by ACV, report median alongside average, and track organic NRR excluding price increases separately. One number hides more than it reveals.
How to Calculate NRR
The standard formula uses monthly recurring revenue (MRR) components:
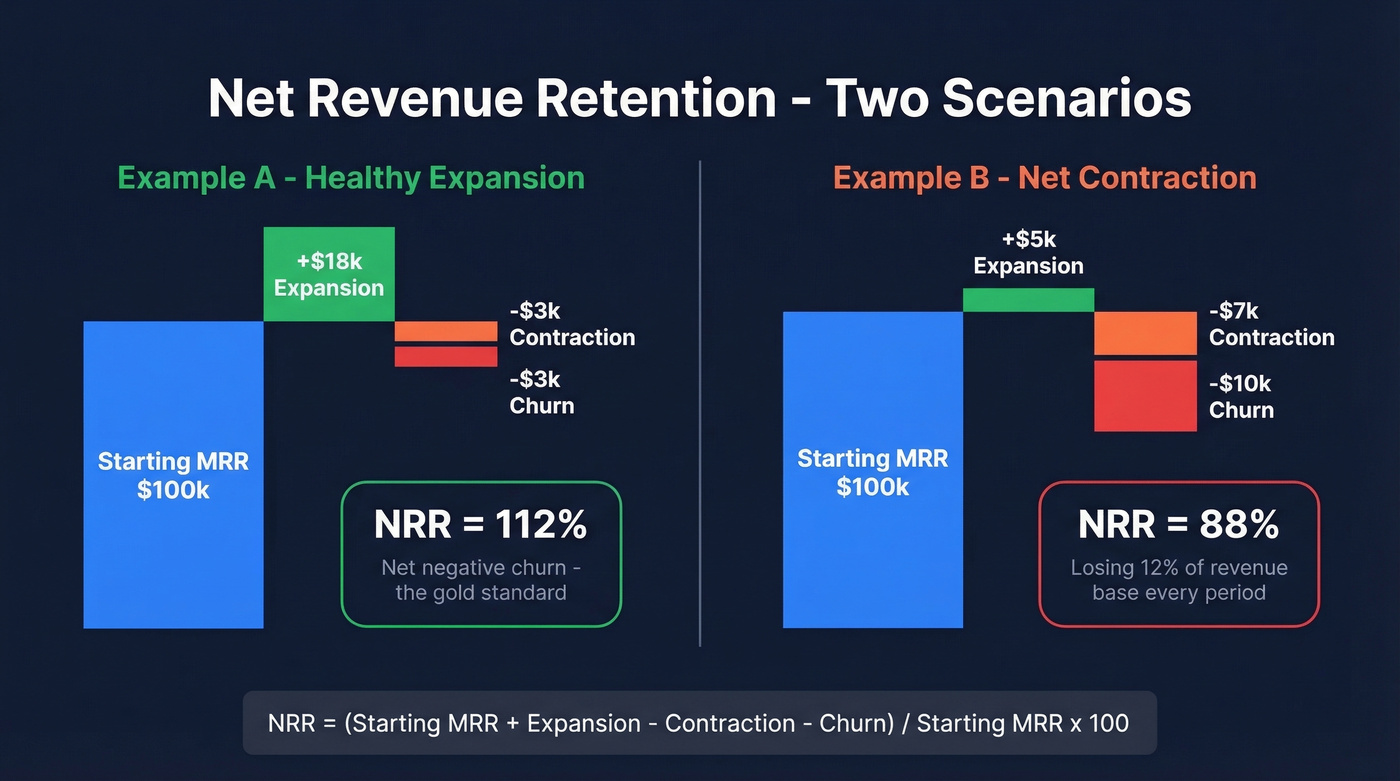
NRR = (Starting MRR + Expansion - Contraction - Churn) / Starting MRR x 100
Two worked examples make the math concrete.
Example A - Healthy expansion (NRR = 112%)
Starting MRR: $100,000. Expansion from upsells and seat additions: $18,000. Contraction from downgrades: $3,000. Churned MRR: $3,000.
NRR = ($100,000 + $18,000 - $3,000 - $3,000) / $100,000 x 100 = 112%
Your existing customers are generating 12% more revenue than they were at the start of the period. That's net negative churn - the gold standard.
Example B - Net contraction (NRR = 88%)
Starting MRR: $100,000. Expansion: $5,000. Contraction: $7,000. Churned MRR: $10,000.
NRR = ($100,000 + $5,000 - $7,000 - $10,000) / $100,000 x 100 = 88%
You're losing 12% of your revenue base every period before new sales even touch the number. Your sales team is running just to stand still.
2026 NRR Benchmarks
The biggest mistake in NRR benchmarking is using outdated numbers. Public SaaS NDR has compressed dramatically since the 2021-2022 peak, and private company benchmarks look even more modest.
Public SaaS NDR Trendline
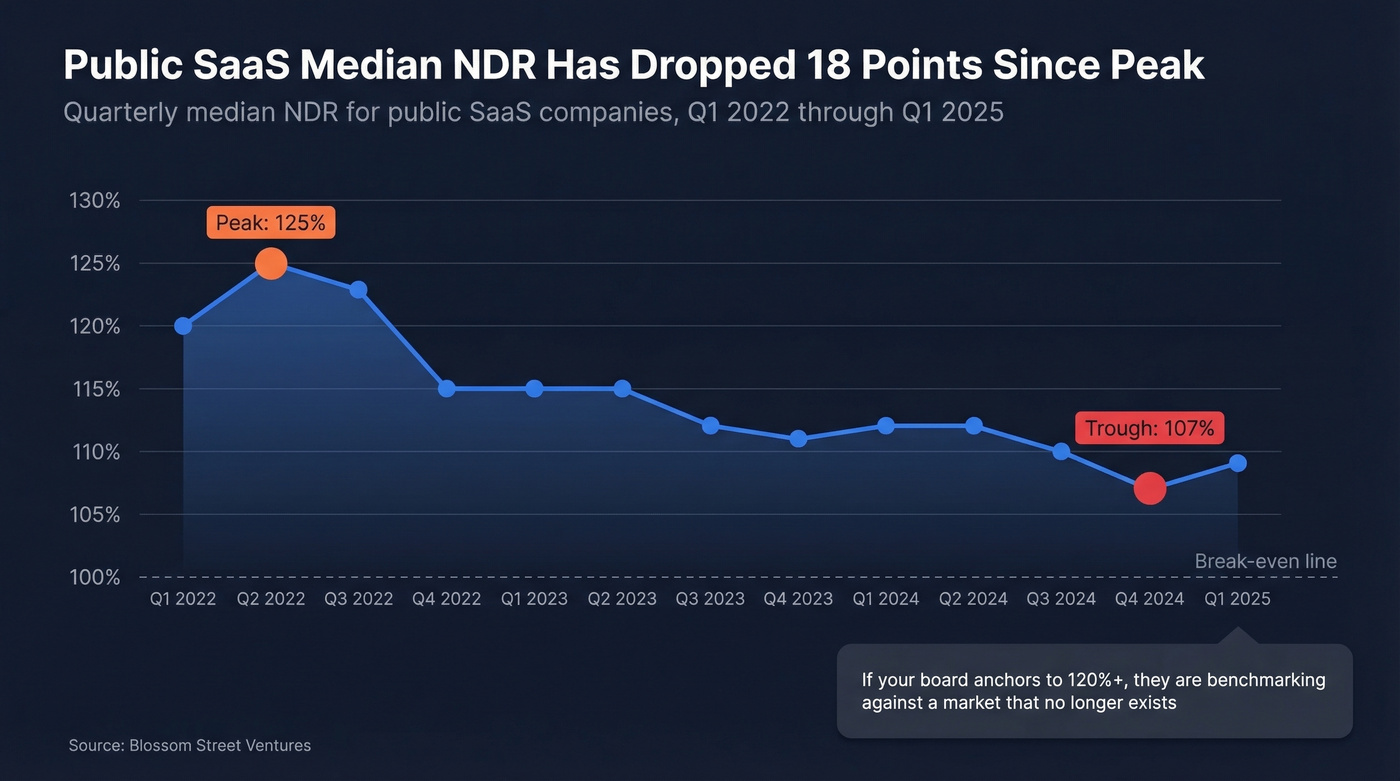
Blossom Street Ventures tracks quarterly median NDR across public SaaS companies that IPO'd since October 2017. The decline is stark:
| Quarter | Median NDR |
|---|---|
| Q1 2022 | 120% |
| Q2 2022 | 125% |
| Q3 2022 | 123% |
| Q4 2022 | 115% |
| Q1 2023 | 115% |
| Q2 2023 | 115% |
| Q3 2023 | 112% |
| Q4 2023 | 111% |
| Q1 2024 | 112% |
| Q2 2024 | 112% |
| Q3 2024 | 110% |
| Q4 2024 | 107% |
| Q1 2025 | 109% |
That's an 18-point drop from the Q2 2022 peak of 125% to Q4 2024's trough of 107%. If your board is still anchoring to 120%+ as "good," they're benchmarking against a market that no longer exists. Still, 72% of public companies that report NRR maintain rates above 100%, per the SEG SaaS Index - the metric hasn't collapsed, it's just normalized.
Private SaaS NRR by ACV
Private companies run lower, and the variance by deal size is enormous. SaaS Capital's retention survey segments by ACV - the most useful lens because similar ACVs imply similar GTM and support models.
| ACV Range | Bottom 25% | Median | Top 25% |
|---|---|---|---|
| < $1k | ~90% | ~96% | ~101% |
| $1k-$5k | ~93% | ~98% | ~104% |
| $5k-$25k | ~95% | ~100% | ~107% |
| $25k-$50k | 97% | 102% | 111% |
| $50k-$100k | ~99% | ~105% | ~114% |
| > $100k | ~102% | ~108% | ~118% |
CRV's investor analysis reinforces the ACV effect: companies with ACV above $6k show top-quartile NRR of 109.3%, with 41% of companies exceeding 100%. Drop to ARPA below $10/month, and top-quartile NRR plummets to 65.1% - only 2.7% of those companies break 100%.
Here's the thing: if you're running a PLG product with $50/month ARPA and comparing yourself to enterprise SaaS NDR benchmarks, you're measuring yourself against a completely different sport. Segment first, benchmark second.
The Valuation Gap
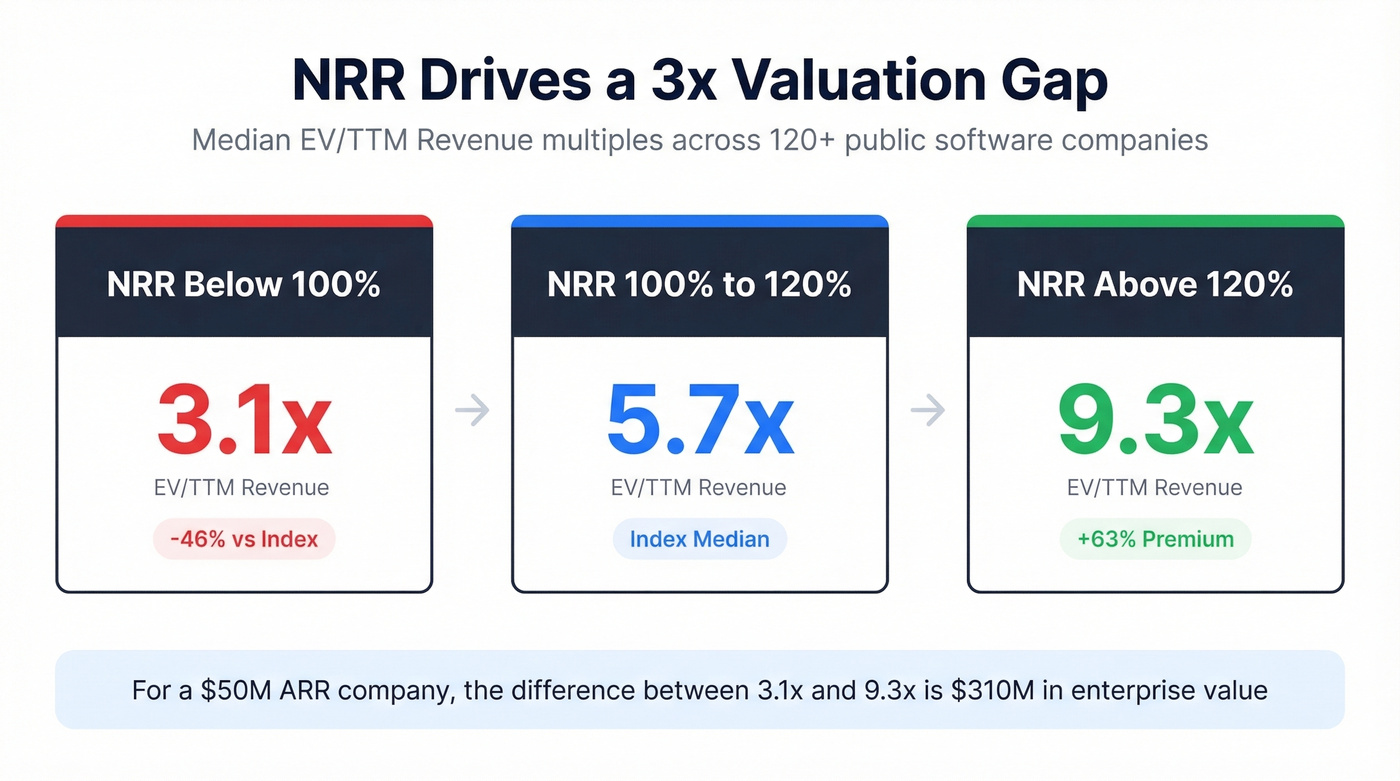
NRR isn't just an operating metric - it's a direct input to how investors value your company. The SEG SaaS Index across 120+ public software companies makes the relationship explicit:
| NRR Bracket | Median EV/TTM Rev | vs. Index Median |
|---|---|---|
| < 100% | 3.1x | -46% discount |
| 100%-120% | ~5.7x | Index median |
| > 120% | 9.3x | +63% premium |
That's a 3x valuation gap between sub-100% and above-120% NRR. For a $50M ARR company, the difference between 3.1x and 9.3x is $310M in enterprise value. At that scale, this isn't a vanity metric.
SaaS Capital's private valuation model uses NRR as one of three formal inputs alongside ARR growth rate and public market multiples. Their SCI median sits at 7.0x run-rate annualized revenue.
The macro picture makes retention even more important. For companies with $50M-$100M ARR, expansion revenue contributed 58% of total new ARR in 2024, while new customer acquisition costs rose 14%. Retention isn't just a growth lever - it's becoming the primary growth engine as CAC climbs.
Our hot take: If your average deal is under $10k, you probably don't need to obsess over NRR at all. Focus on logo retention and GRR instead. The math on expansion at low ACVs almost never works - your CS team costs more than the upsell revenue they generate. NRR becomes a meaningful lever only when your average deal is large enough to expand into.
Expansion revenue drove 58% of new ARR for mid-market SaaS in 2024. But upsell conversations only happen when your team reaches real decision-makers. Prospeo gives you 300M+ verified contacts with 98% email accuracy and 125M+ direct dials - so your CS and expansion reps connect with buyers, not bounced inboxes.
Stop losing expansion pipeline to bad contact data.
NRR vs GRR vs Logo Retention
NRR alone is a vanity metric. Here are the three metrics every SaaS board should see together:
| Metric | Includes Expansion? | Can Exceed 100%? | Measures | Prioritize When |
|---|---|---|---|---|
| NRR | Yes | Yes | Revenue health | Board reporting, fundraising |
| GRR | No | No (caps at 100%) | Base erosion | Diagnosing base health |
| Logo Retention | No | No | Customer count | Identifying SMB churn patterns |
We've seen this pattern repeatedly: a company reports 120% NRR, which looks fantastic - until you learn their GRR is 75%. They're losing a quarter of their revenue base every year and papering over it with expansion from the accounts that stay. That's a house of cards, not a growth engine.
Focusing on NRR pushes teams toward segmentation, tiered experiences, and growth-oriented customer success motions. But over-focusing creates perverse incentives - excessive custom work for large accounts, concentration risk where 40-50% of revenue sits in a handful of customers. ChurnZero flags that concentration threshold as a specific investor concern.
GRR tells you how leaky the bucket is. Logo retention tells you whether you're losing many small customers or a few big ones. Together, the three metrics paint a picture that NRR alone never can.
When NRR Lies
The Outlier Problem
Your VP of CS presents 118% NRR at the quarterly review. The number is technically correct. But one enterprise customer expanded from $50k to $300k ARR - a 6x jump driven by a single department-wide rollout. Remove that account, and NRR drops to 95%.
This isn't hypothetical. The consensus on r/SaaS is clear: report median NRR alongside average NRR. Averages are vulnerable to outliers; medians tell you what the typical customer is actually doing. Segment by customer size - a blended number across SMB and enterprise cohorts is almost meaningless.
The concentration risk is real. If that one outlier account churns next quarter, your 118% becomes 95% overnight. That's the kind of swing that kills fundraising narratives.
The Price Increase Illusion
A founder on Reddit broke down their 127% NRR into components: +8% from usage expansion, +11% from seat additions, +15% from price increases, -7% from churn. Their "organic NRR" - excluding price hikes - was 112%. Still good, but a fundamentally different story.
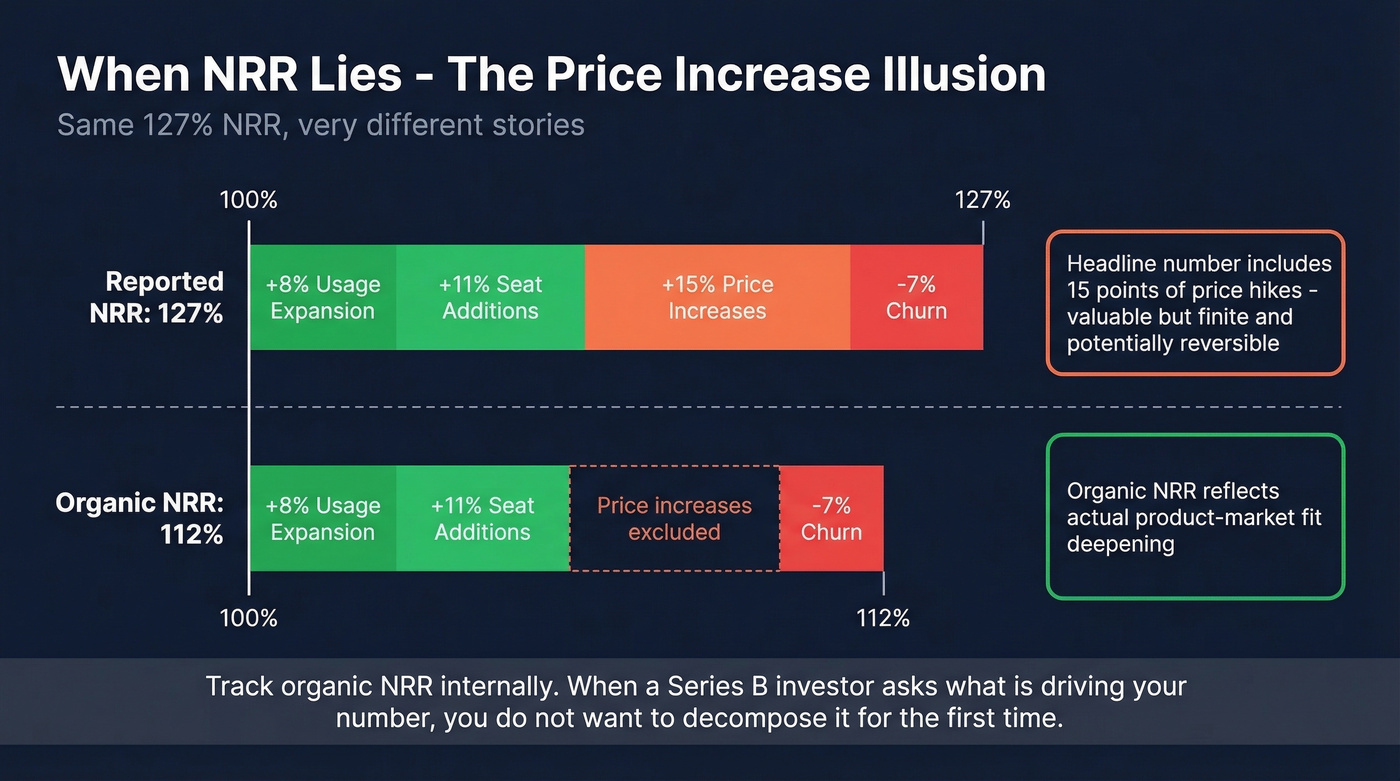
Price increases aren't expansion. A 127% NRR driven by 15 points of price hikes is a completely different animal from 127% driven by usage growth. One reflects product-market fit deepening. The other reflects pricing power - valuable, but finite and potentially reversible when customers find alternatives.
Track organic NRR internally. When a Series B investor asks what's driving your number - and they will - you don't want to be decomposing it for the first time.
Edge Cases That Break the Formula
The formula looks clean on a whiteboard. In production, it gets messy fast.
Usage-based pricing creates the most chaos. Consumption patterns are inherently volatile - a customer's monthly spend can swing based on seasonal workloads, project timelines, or budget cycles, making month-to-month comparisons meaningless noise. Ordway Labs recommends trailing-twelve-month smoothing to filter out seasonality, and many public companies with usage-based models do exactly this.
Three contract patterns complicate things further. Pay-as-you-go customers with no commitment - some companies exclude them entirely, others include them. Capacity contracts with annual minimums plus overages create a hybrid where the "base" revenue is predictable but actual revenue fluctuates. Prepaid credit models add another wrinkle around when the revenue "counts."
Real companies handle this differently. DigitalOcean includes re-engaged customers in their NRR cohort - if a customer generated revenue before, went dormant, and comes back, they're counted. Confluent excludes services and pay-as-you-go arrangements from the ARR base entirely. Toast computes monthly NRR per cohort, then reports annual NRR as a weighted average of monthly figures. Before you benchmark against anyone else's number, make sure you're measuring the same thing. Two companies both reporting 108% can represent wildly different business health.
How to Improve NRR
Three levers, one foundation.
Reduce churn. This is the defensive play. Structured onboarding that gets customers to value quickly, health scoring that flags at-risk accounts before they cancel, and proactive outreach when engagement drops. Most churn is preventable - the problem is that CS teams don't see it coming until the cancellation request hits. (If you need a deeper framework, start with a proper churn analysis.)
Drive expansion. Usage signals and upsell triggers are the offensive play. Watch for leading indicators: users hitting plan limits, attempting to access premium features, or inviting colleagues into the workspace. When a new department starts using the product, that's a cross-sell opportunity. For $50M+ ARR companies, expansion already drives 58% of new ARR - this is the primary growth motion, not a nice-to-have. (See upsell vs cross-sell in SaaS for practical plays.)
Prevent downgrades. The often-forgotten middle ground. Packaging that grows with usage, value delivery that justifies the current tier, and pricing structures that don't punish customers for scaling back temporarily.
All three levers depend on one thing: reaching the right person at the right time. When a champion leaves a customer account, your CRM doesn't update itself. When a new VP joins and starts evaluating alternatives, your CS team needs to know - and needs a way to reach them. This is where data quality becomes the silent NRR killer. Stale contacts in Salesforce from the original deal close are worse than useless; they give your team false confidence that they're "covered" on an account when they're actually flying blind. Tools like Prospeo's CRM enrichment can help here - it refreshes contact data on a 7-day cycle and returns 50+ data points per contact at 98% email accuracy, so your CS team always has current, verified emails for every stakeholder. (If you're comparing vendors, use this list of data enrichment services and a quick primer on lead enrichment.)
NRR above 120% earns a 63% valuation premium. Getting there means your team needs to identify and reach expansion buyers inside existing accounts - fast. Prospeo's intent data tracks 15,000 topics so you spot upsell signals before churn signals, and CRM enrichment returns 50+ data points per contact at a 92% match rate.
Enrich your accounts and surface expansion opportunities for $0.01 per lead.
Net Revenue Retention FAQ
What's a good NRR for SaaS?
Median private SaaS NRR for companies with ACV $25k-$50k is 102%; public SaaS median sits around 108%. Below 100% is a red flag at meaningful scale because it means your existing base is shrinking every period before new sales contribute. Benchmark against your ACV segment, not headline numbers from enterprise outliers.
Can NRR exceed 100%?
Yes - NRR above 100% means expansion revenue from existing customers exceeds the combined impact of churn and contraction. This is called net negative churn: your customer base grows in revenue even without adding a single new logo. Top-quartile companies with ACV above $100k regularly hit 118%+.
What's the difference between NRR and NDR?
Nothing. Net revenue retention and net dollar retention are identical metrics with different names. Public company filings tend to use "NDR" while operators and investors more often say "NRR." Don't let the terminology trip you up - the formula and interpretation are exactly the same.
How often should you measure NRR?
Monthly for internal tracking, quarterly for board reporting. Usage-based companies should report trailing-twelve-month averages to smooth consumption volatility. Weekly tracking is overkill unless you're debugging a specific retention problem.
How does stale CRM data hurt retention?
Retention and expansion plays fail when your team can't reach the right contacts. Missed renewal conversations and unnoticed expansion signals erode NRR silently. Keeping CRM data current - whether through automated enrichment tools, manual research, or a combination - ensures CS teams always have verified contacts for key stakeholders when it matters most.