CAC Payback Period: The Practitioner's Guide to Calculating, Benchmarking, and Reducing It
You're in the board meeting. The slide says "CAC payback: 14 months." The investor across the table says, "That should be under 12." You nod, but you're already doing the math in your head - did finance use gross margin or revenue? Did they lag S&M spend? Is that new-logo-only or fully loaded? You don't know. And neither does the investor quoting "12 months" like it's gospel.
The median CAC payback across 939 B2B SaaS companies is 15 months - not 12. That "12-month rule" is lazy shorthand that ignores ACV segment, NDR, and billing terms. This guide uses the actual data.
Quick Version
CAC payback measures how many months it takes to recover your customer acquisition cost from gross profit - not revenue. The median across that 939-company dataset is 15 months, and the number means nothing without net dollar retention context. Pair them or you're flying blind.
Most teams understate CAC by excluding renewal S&M, stock-based comp, or failing to lag spend against their actual sales cycle. The fastest lever to shorten payback isn't cutting spend. It's better targeting.
What CAC Payback Actually Means
CAC payback is a cash efficiency signal. It answers one question: how long until a new customer generates enough gross profit to cover what you spent acquiring them? It's not a profitability metric. It doesn't tell you whether the customer is ultimately worth acquiring - that's LTV:CAC's job. Payback tells you when you break even. LTV:CAC tells you how much you ultimately earn. You need both.
Here's a framing that makes the urgency click for finance teams: every month before payback, that customer is effectively debt on your balance sheet. You've spent real cash to acquire them and haven't earned it back yet. A 15-month payback means 15 months of carrying that debt per customer. Stack up a few hundred customers acquired in the same quarter and you start to see why cash planning without payback data is reckless.
How to Calculate CAC Payback Correctly
The Formula
CAC / (Monthly ARPU x Gross Margin %)
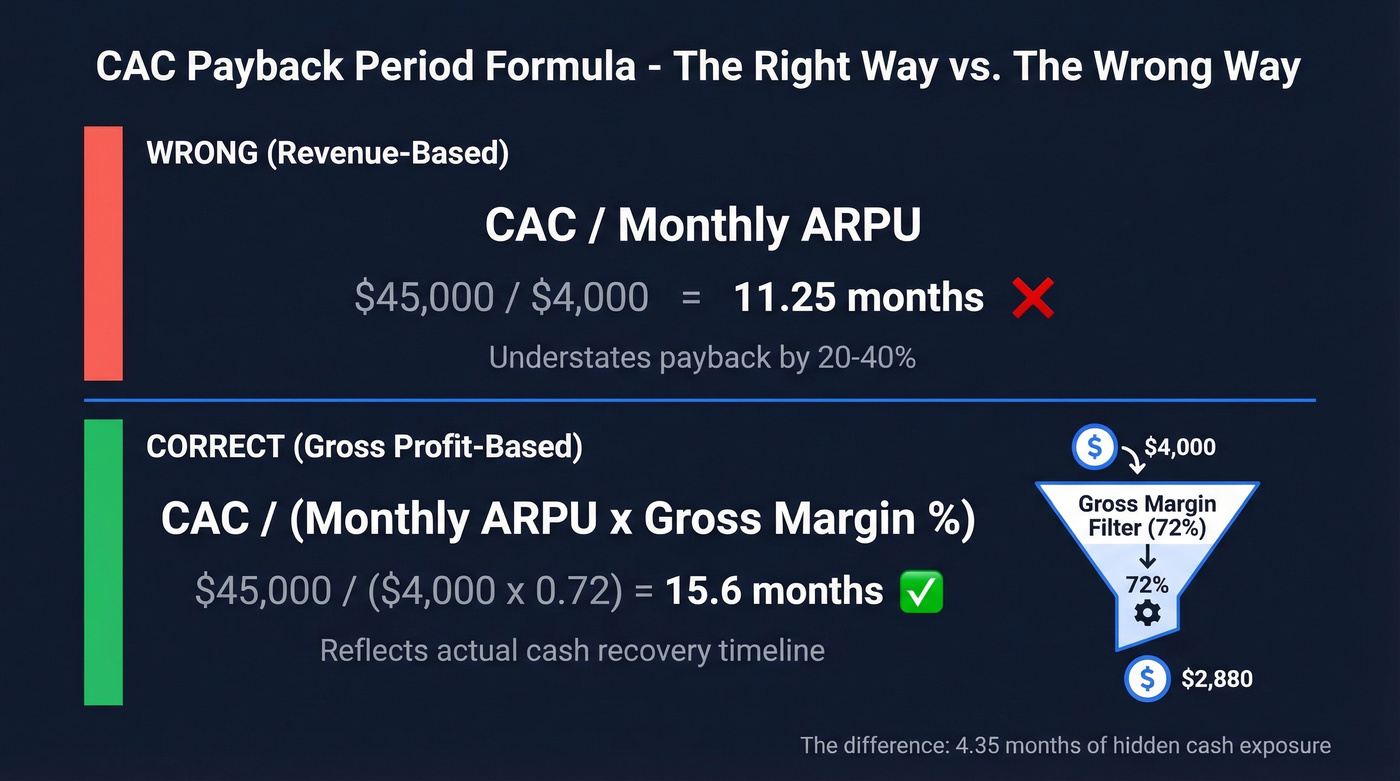
That gross margin multiplier is the part most teams get wrong. If you're dividing CAC by monthly revenue instead of monthly gross profit, you're understating payback - often by 20-40%. A customer paying $5,000/month at 72% gross margin generates $3,600/month in gross profit, not $5,000. The difference compounds fast across your entire customer base.
New-Logo-Only vs. Fully Loaded
The methodology you choose can swing your payback number by months.
| Approach | What's Included | Best For |
|---|---|---|
| New-Logo-Only | New ARR (or new MRR) + the portion of S&M attributed to landing new logos | Investor comparisons |
| Fully Loaded | Total S&M (and often CS/COGS-to-serve) measured against net new gross profit | Internal planning |
Use fully loaded for internal planning - it's honest. Use new-logo-only when benchmarking against peers or presenting to investors, because most published benchmarks measure new-logo-only. Just be consistent and label which one you're using.
What to Include in S&M Spend
This is where teams create phantom efficiency gains. Your S&M denominator should include:
- Base salaries + commissions for all sales and marketing headcount
- Stock-based compensation (yes, really - FP&A practitioners on r/FPandA flag this constantly)
- Marketing program spend, tools, and agency fees
- Executive time allocated to sales activities (see sales activities for what to count)
- Renewal and expansion S&M - or reallocate it to COGS
That last point is critical. If you exclude renewal/expansion S&M from CAC without reallocating those costs somewhere, you've created a phantom efficiency gain. The spend didn't disappear. It just stopped being counted.
Lagging S&M by Sales Cycle
The S&M you spend today doesn't produce customers today. Align the spend with when deals actually close:
| Segment | Avg Sales Cycle | Recommended S&M Lag |
|---|---|---|
| [Enterprise | ~180 days](https://www.saastr.com/dear-saastr-whats-a-good-benchmark-for-b2b-sales-cycles/) | 2 quarters |
| Mid-market | ~90 days | 1 quarter |
| SMB | ~30 days | None |
Use trailing twelve months to smooth seasonality. Monthly views look like an EKG and tell you nothing useful about trends. The payback period sales teams report often looks shorter than reality precisely because they skip this lagging step.
Worked Examples
Example A: SMB SaaS
- Monthly ARPU: $500
- Gross margin: 80%
- CAC: $3,000
- Sales cycle: ~30 days (no lag needed)
Payback = $3,000 / ($500 x 0.80) = $3,000 / $400 = 7.5 months
Clean and fast. That's what good SMB unit economics look like.
Example B: Mid-Market SaaS
- Monthly ARPU: $4,000
- Gross margin: 72%
- CAC: $45,000
- Sales cycle: ~90 days (1-quarter S&M lag applied)
Payback = $45,000 / ($4,000 x 0.72) = $45,000 / $2,880 = 15.6 months
Here's the thing: if you'd skipped the gross margin adjustment and divided $45,000 by $4,000, you'd get 11.25 months. That's a 28% understatement. Your board deck looks great. Your cash flow doesn't. We've seen this exact mistake lead to hiring plans that outrun actual unit economics - it's one of the most expensive spreadsheet errors in SaaS.
The fastest lever to reduce CAC payback isn't cutting S&M spend - it's eliminating waste in your pipeline. When 35% of your emails bounce, you're inflating CAC with spend that never reaches a buyer. Prospeo delivers 98% email accuracy and 30% mobile pickup rates, so every dollar of S&M actually connects with a real prospect.
Stop padding your CAC with bounced emails and dead numbers.
2026 Benchmarks by Segment
By ACV Segment
The Optifai dataset (N=939) is the most granular public benchmark available:
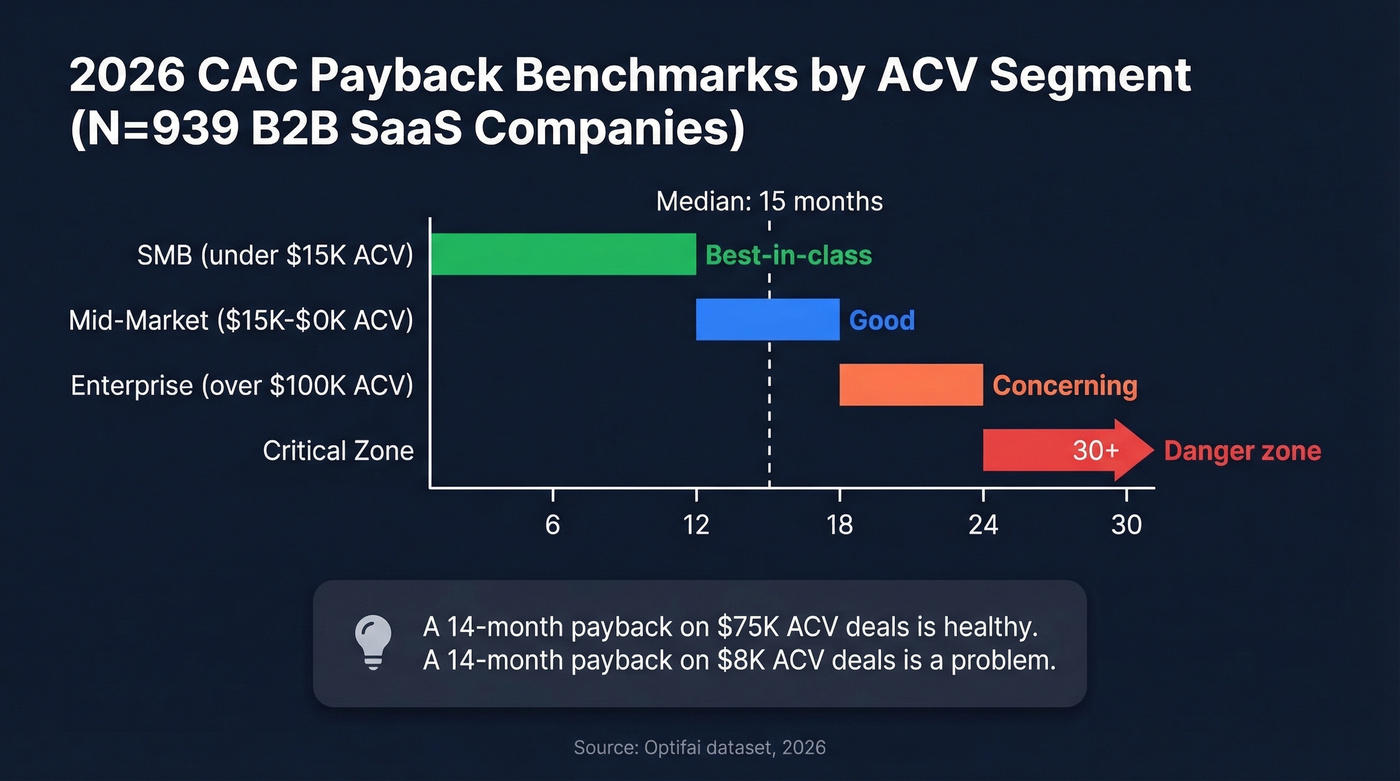
| ACV Segment | Payback Range | Health Band |
|---|---|---|
| SMB (<$15K) | 8-12 months | Best-in-class <12 |
| Mid-market ($15-100K) | 14-18 months | Good: 12-18 |
| Enterprise (>$100K) | 18-24 months | Concerning: 18-24 |
| - | - | Critical: >24 |
The median across all segments is 15 months. If someone tells you "good payback is under 12 months," ask them what ACV segment they're talking about. A 14-month payback on $75K ACV deals is healthy. A 14-month payback on $8K ACV deals is a problem.
By Industry Vertical
FirstPageSage's benchmarks show meaningful vertical variation:
| Vertical | SMB Avg | SMB Good | Enterprise Avg | Enterprise Good |
|---|---|---|---|---|
| Business Services | 14 mo | 8 mo | 30 mo | 20 mo |
| Fintech | 12 mo | 7 mo | 23 mo | 18 mo |
| Security | 13 mo | 8 mo | 25 mo | 19 mo |
| Healthcare IT | 15 mo | 9 mo | 28 mo | 21 mo |
| HR Tech | 13 mo | 8 mo | 26 mo | 20 mo |
Enterprise security and healthcare IT companies shouldn't panic at 20+ month payback - that's the vertical norm. Fintech SMBs, on the other hand, should be alarmed if they're above 12.
What Investors Expect by Stage
| Stage | Target Payback |
|---|---|
| Seed / Series A | <12 months |
| Series B+ / Growth | <18 months |
| Late stage | <24 months |
| Public | <18 months |
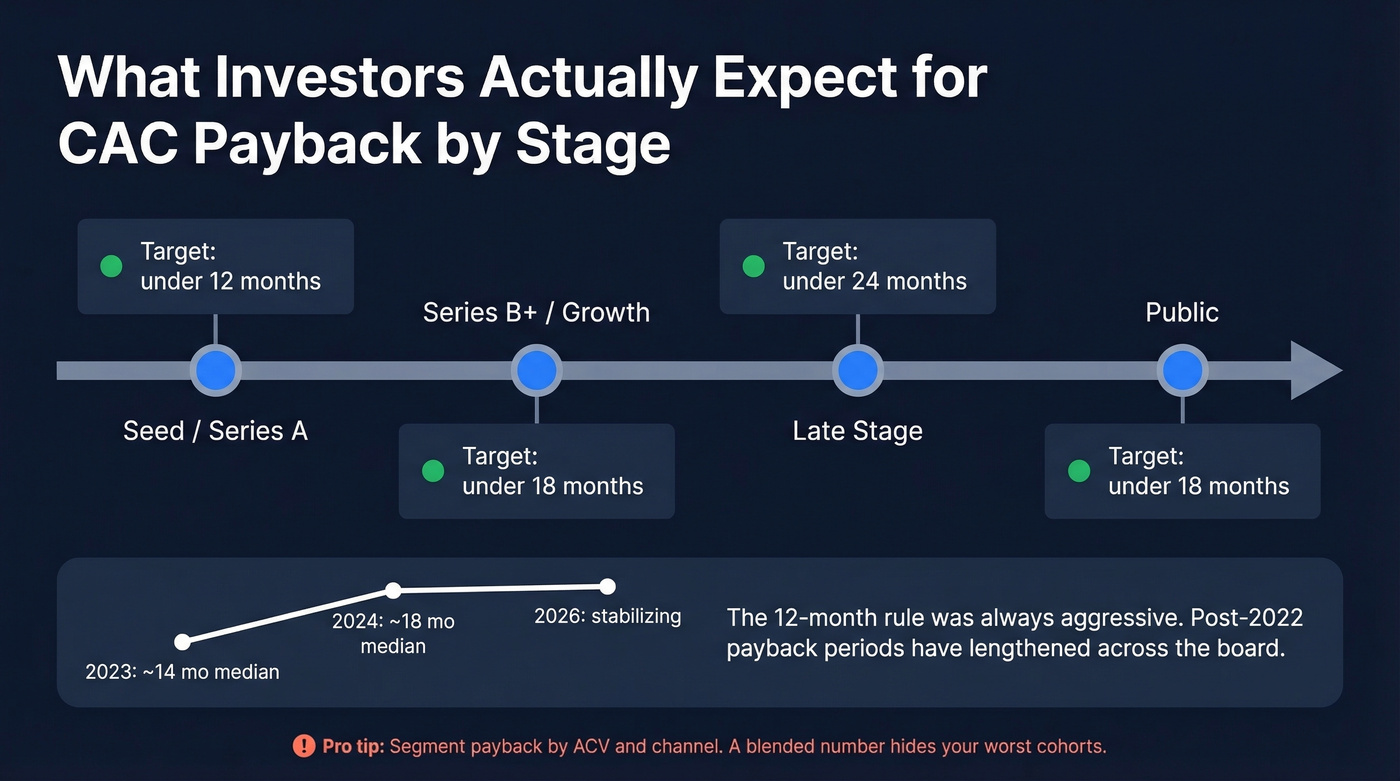
One trend worth noting: SaaS payback periods have generally lengthened post-2022 and have been stabilizing through 2026. Industry data suggests the median moved from about 14 months in 2023 to about 18 months in 2024, based on benchmark indices tracking 800+ companies. The "12-month rule" was always aggressive - now it's borderline unrealistic for anything above SMB.
Investors sometimes use the Magic Number (net new ARR / prior-period S&M) as a quick proxy for payback efficiency. If yours is weak, expect the payback conversation to get uncomfortable.
In our experience, teams that segment payback by ACV and channel make better hiring decisions than those running a single blended number. A blended 14-month payback that hides a 6-month SMB cohort and a 26-month enterprise cohort will lead you to over-invest in the wrong segment.
How to Interpret Your Number
Pair Payback with NDR - Always
A 20-month payback with 150% NDR is a fundamentally different business than a 20-month payback with 95% NDR. OpenView's framework makes this explicit:
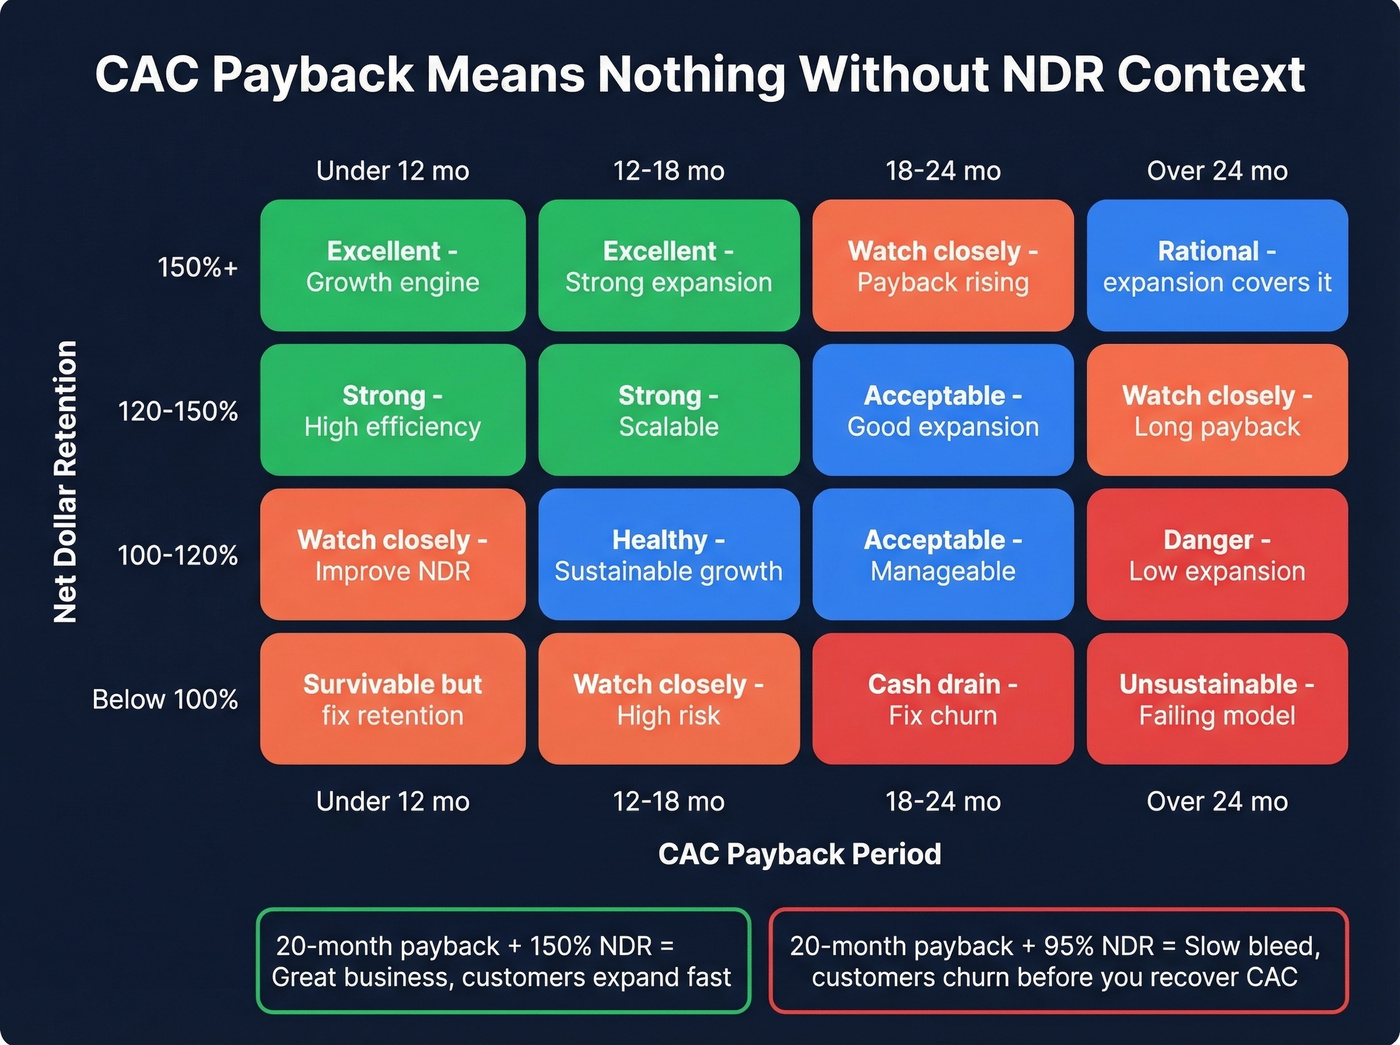
| NDR Range | Acceptable Payback |
|---|---|
| Below 100% | <12 months |
| 100-120% | 12-18 months |
| 120-150% | 18-24 months |
| 150%+ | Longer is rational |
Consider the founder on r/SaaS who defended an 18-month payback: 5.2-year average customer lifetime, LTV:CAC above 4:1. That's a great business. But swap in a 2-year lifetime and LTV:CAC drops to 1.5:1 - now that same 18-month payback is a slow bleed.
Let's be blunt: if your average deal size sits below $10K and NDR is under 110%, you probably can't afford a payback period longer than 10 months. The math just doesn't work. You'll churn customers before you recoup acquisition cost, and no amount of "we're investing in growth" storytelling changes the cash reality. Either raise ARPU, fix retention, or accept that your GTM motion is subsidizing churn (see churn analysis).
When Longer Payback Is Rational
Cash runway matters. If you've got 36 months of runway and strong expansion revenue trajectories, a longer payback period is a growth investment, not a red flag.
The PLG nuance is important here too: Atlassian spends $2.43 on R&D for every $1 on S&M. Standard payback comparisons break down entirely when R&D is the primary acquisition engine. If you're PLG-heavy, consider including a portion of R&D in your acquisition cost - or at least footnote the discrepancy when presenting to investors who are comparing you against sales-led peers.
One advanced methodology worth adopting: cohort-based payback analysis. Instead of calculating payback per average customer, track each acquisition cohort over time and measure when cumulative gross profit crosses cumulative CAC. This naturally incorporates churn and expansion within each cohort, producing a far more honest number than per-customer averages that assume zero churn.
Cash Payback vs. Revenue Payback
Monthly billing makes cash payback closer to revenue payback. Annual prepay changes everything.
If a customer pays $48,000 upfront on a $45,000 CAC, your cash payback is immediate - month 0. Your revenue payback is still 15.6 months. Both numbers are true. Neither is complete without the other. Know which one you're reporting.
Common Calculation Mistakes
- Using revenue instead of gross margin. The most common error, and it flatters your number by 20-40%. Always multiply ARPU by gross margin percentage.
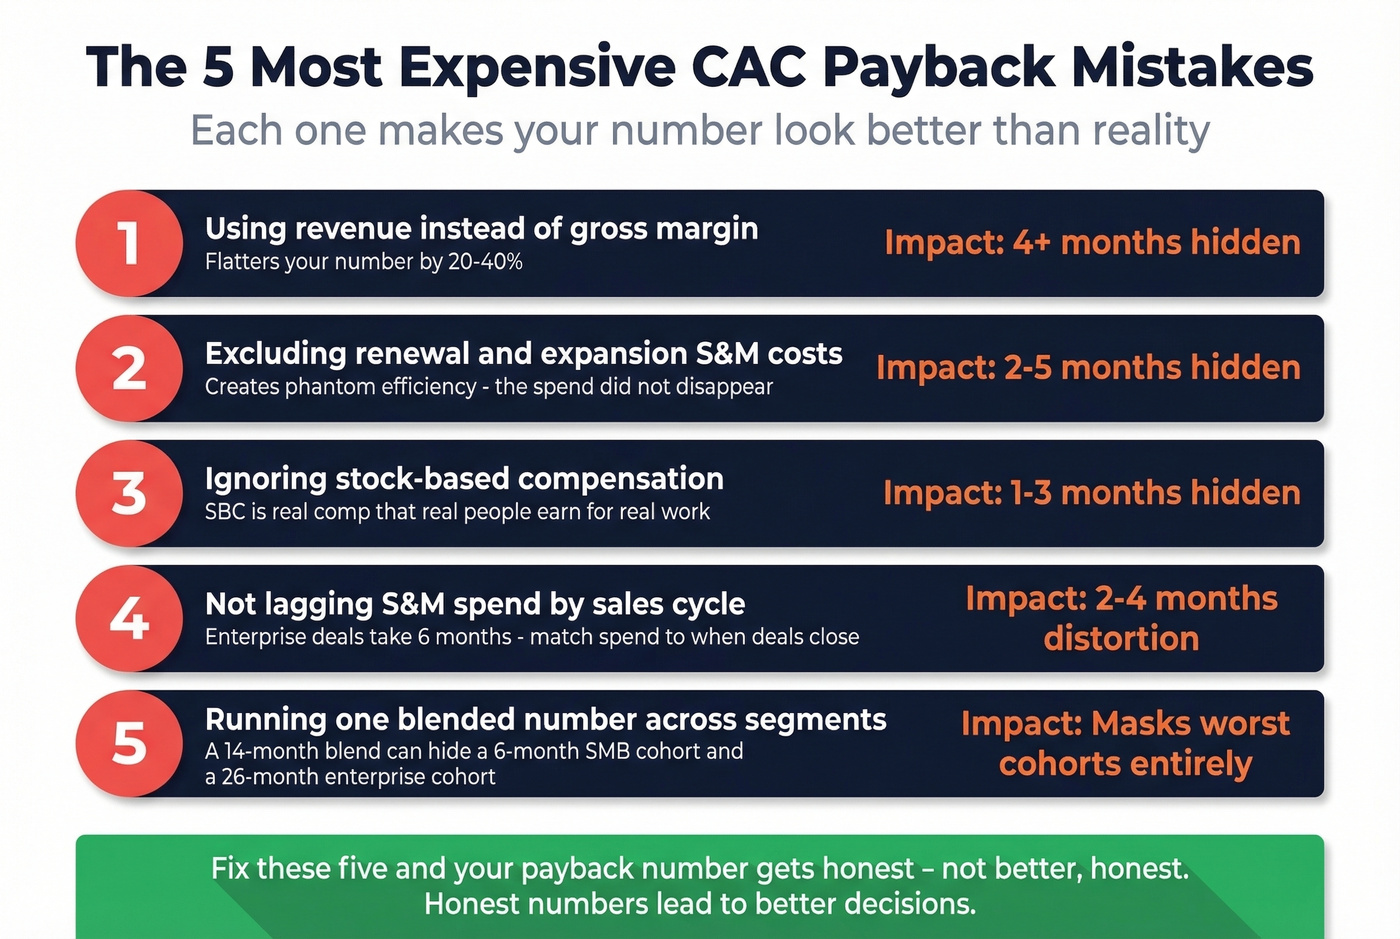
Excluding renewal/expansion S&M without reallocating. If your CSMs drive expansion and you don't count their cost anywhere, you've created a gap in your P&L that makes acquisition look cheaper than it is.
Ignoring stock-based comp in S&M. SBC is real compensation. Excluding it from S&M spend understates your true acquisition cost, especially at growth-stage companies where SBC can be 15-30% of total comp.
Not lagging S&M spend for enterprise sales cycles. Current-quarter S&M divided by current-quarter new customers produces a meaningless number when deals take 6 months to close. Lag it.
PLG companies excluding R&D from acquisition cost. If your product is your primary acquisition channel, some portion of R&D spend is acquisition cost. Ignoring this makes PLG companies look artificially efficient.
Using blended payback instead of segmenting. A blended number that averages your 6-month SMB payback with your 24-month enterprise payback tells you nothing actionable. Segment by ACV, channel, and ICP - or skip the metric entirely (use an ideal customer profile to make segmentation real).
How to Reduce CAC Payback
Improve Targeting and Data Quality
This is the highest-impact, lowest-risk move. Your SDR team sends 50,000 emails per quarter. At a 12% bounce rate, that's 6,000 wasted touches. At $3-5 per touch (fully loaded rep time + tooling), you're burning $18-30K in dead S&M spend every quarter. That spend inflates your CAC directly.
We've watched teams fix this overnight. Prospeo's 98% email accuracy and 7-day data refresh cycle mean reps spend time on reachable prospects, not bounced emails. Snyk's 50-person AE team saw bounce rates drop from 35-40% to under 5% after switching - AE-sourced pipeline jumped 180%. At roughly $0.01 per email with a free tier to start, it's the lowest-risk lever on this list (more on bounce-rate mechanics in our email bounce rate guide).
Five More Levers, Ranked by Impact
1. Optimize conversion rates. A 10% improvement in SQL-to-close rate on a $45K CAC effectively saves $4,500 per deal. Multiply that across 50 deals per quarter and you've cut $225K from quarterly S&M without touching headcount (track it alongside your sales conversion rate).
2. Drive expansion revenue. If you're using the fully-loaded formula, expansion revenue directly shortens payback. Product-led expansion motions and CS-driven upsells accelerate the break-even timeline on every customer you've already acquired (see upsell vs cross-sell in SaaS).
3. Adjust pricing and packaging. Higher ARPU = faster payback. It's arithmetic. Even a 15% ARPU increase can shave 2-3 months off payback. Review your packaging for underpriced tiers before you cut a single dollar of spend.
Real talk on the next two: they're slower to execute but compound over time.
4. Shift billing to annual prepay. Offer a 10-15% discount for annual prepay and your cash payback drops dramatically. The discount pays for itself in reduced payback and improved cash flow predictability.
5. Improve gross margin. Moving from 72% to 78% GM on a $4,000 ARPU customer adds $240/month in gross profit per customer. Hosting optimization, support automation, and infrastructure efficiency all contribute - and the gains compound across your entire base.
That 28% payback understatement from Example B? Bad data creates the same illusion. Teams using Apollo (79% accuracy) or ZoomInfo (87%) burn acquisition budget on invalid contacts - inflating real CAC while the spreadsheet looks clean. At $0.01 per verified email, Prospeo cuts your cost-per-contacted-prospect and compresses payback by weeks.
Reduce your true CAC payback - start with data that actually converts.
CAC Payback vs. LTV:CAC
These metrics answer different questions. Use both.
| Dimension | CAC Payback | LTV:CAC |
|---|---|---|
| Measures | Months to break even | Total return on acquisition |
| Focus | Cash efficiency | Long-term value |
| Time horizon | Short-term | Full lifetime |
| Best paired with | NDR, cash runway | Payback, churn rate |
| Use when | Planning cash flow | Growth investment decisions |
A company with 8-month payback and 2:1 LTV:CAC is efficient but not valuable enough. A company with 22-month payback and 6:1 LTV:CAC is a great business that just needs patience and cash. You can't make good decisions with only one of these numbers. Pair both with NDR and you've got a complete picture of go-to-market efficiency (and a cleaner operating cadence with funnel metrics).
FAQ
What's a good CAC payback period for SaaS?
Under 12 months is best-in-class for SMB. For mid-market deals ($15-100K ACV) with 110%+ NDR, 14-18 months is healthy. Above 24 months is a red flag regardless of segment, unless exceptional expansion revenue and long customer lifetimes justify it.
How do you calculate CAC payback period?
Divide total CAC by monthly ARPU multiplied by gross margin percentage. Use fully-loaded S&M for internal planning and new-logo-only for investor comparisons. Lag your S&M spend by average sales cycle length - one quarter for mid-market, two quarters for enterprise.
Is 18 months too long for CAC payback?
Not necessarily. With 120%+ NDR, customer lifetimes above 4 years, and LTV:CAC above 3:1, 18 months is perfectly rational. The key question is whether your cash runway supports the wait. Context matters far more than the raw number.
What's the difference between CAC payback and LTV:CAC?
CAC payback measures months to break even on acquisition spend - it's a cash efficiency metric. LTV:CAC measures total return over the customer's lifetime. Payback without LTV:CAC ignores long-term value; LTV:CAC without payback ignores cash timing. You need both, ideally paired with NDR.
How can I reduce CAC payback quickly?
The fastest lever is improving data quality to eliminate wasted S&M spend on unreachable contacts. After that: optimize conversion rates to shorten sales cycles, and shift billing to annual prepay for immediate cash payback improvement.