Annual Churn Rate: How to Calculate, Benchmark, and Reduce It
Your 4% monthly churn looks manageable on a dashboard. Run the compounding math and it's actually 38.7% annual - meaning you're replacing nearly four out of ten customers every year just to stay flat. The worst part? 44% of executives don't even know their own churn rate. That's not a rounding error. That's flying blind while your revenue base erodes underneath you.
What Is Annual Churn Rate?
Annual churn rate is the percentage of customers or revenue you lose over a 12-month period. Simple concept, but the measurement is where teams get tripped up.
Monthly churn gets all the attention because it's the number sitting in your billing dashboard every 30 days. But monthly figures hide the compounding effect. A "small" 3% monthly churn doesn't mean 36% annual - it means 30.6%, because each month's churn applies to a shrinking base. Annualizing forces you to confront the full picture, and that picture is usually uglier than you think.
One distinction to flag early: customer churn counts logos lost, while revenue churn counts dollars lost. A company losing 50 small accounts but retaining its enterprise base might have high customer churn and low revenue churn. You need both numbers, but revenue churn matters more for financial planning.
If you want the full foundation (definitions, formulas, and common pitfalls), start with churn.
Why Churn Impacts Valuation
Churn is one of the biggest levers on your company's valuation. SaaS businesses with yearly churn above 10% typically trade at 3-4x revenue multiples. Low-churn companies? 8-12x. That's the gap between a $20M exit and a $60M one.
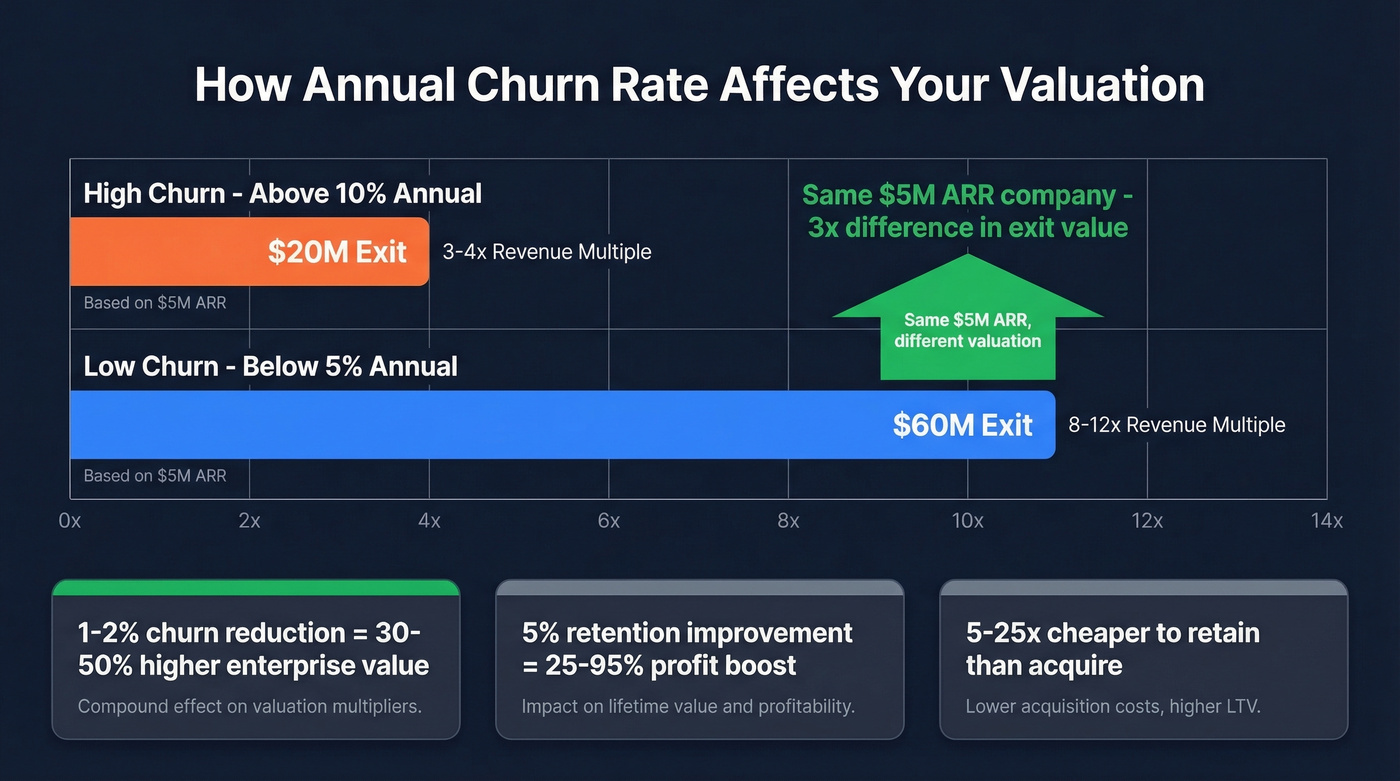
The compounding effect is even sharper at the margin. Reducing churn by just 1-2% can boost long-term enterprise value by 30-50%. For context, the median public SaaS EV/Revenue multiple sat at 5.1x as of late 2025 - down 60%+ from the 2021 peak. In a compressed-multiple environment, investors scrutinize retention harder than ever.
Here's a quick way to feel the impact: acquiring new customers costs 5-25x more than retaining existing ones. A 5% improvement in retention can boost profits by 25-95%. And a quick LTV approximation - divide 1 by your monthly churn rate. At 3% monthly churn, average customer lifetime is roughly 33 months. Think of your revenue as a leaky bucket. You can pour more water in through new sales, but if the holes keep growing, you'll never fill it. Your yearly churn number tells you how big those holes really are.
If you’re tying churn to unit economics, it helps to sanity-check your cost to acquire customer alongside retention.
How to Calculate Annual Churn Rate
Three formulas, three use cases. Use customer churn for board reporting, revenue churn for financial planning, and MRR-based churn when you're running monthly billing cycles.
Customer Churn Formula
Annual Customer Churn = (Customers Lost During Year / Customers at Start of Year) x 100
Worked example: You start January with 1,000 customers. By December 31, 180 have canceled, not counting any new customers acquired during the year. Your annual customer churn is 18%.
The key detail people miss: exclude new customers acquired during the period. You're measuring retention of the starting cohort, not net movement.
Revenue Churn Formula
Annual Revenue Churn = (Revenue Lost from Churned Customers / Total Revenue at Start of Year) x 100
This tells you whether you're losing your $500/mo accounts or your $5,000/mo accounts. A company with 10% customer churn but 3% revenue churn is losing small fish and keeping whales - a very different story than the reverse.
MRR-Based Churn Formula
Annual MRR Churn = 1 - (1 - Monthly MRR Churn Rate)^12
If your monthly MRR churn is 2.5%, your annual MRR churn is 1 - (0.975)^12 = 26.3%.
Our recommendation: track all three, but lead with revenue churn in any investor or board conversation. It maps directly to your P&L.
If you’re doing deeper diagnosis (not just reporting), use a structured churn analysis workflow.
Monthly to Annual Conversion
Multiplying monthly churn by 12 is the most common mistake in SaaS metrics. It overstates your churn for any non-zero rate.
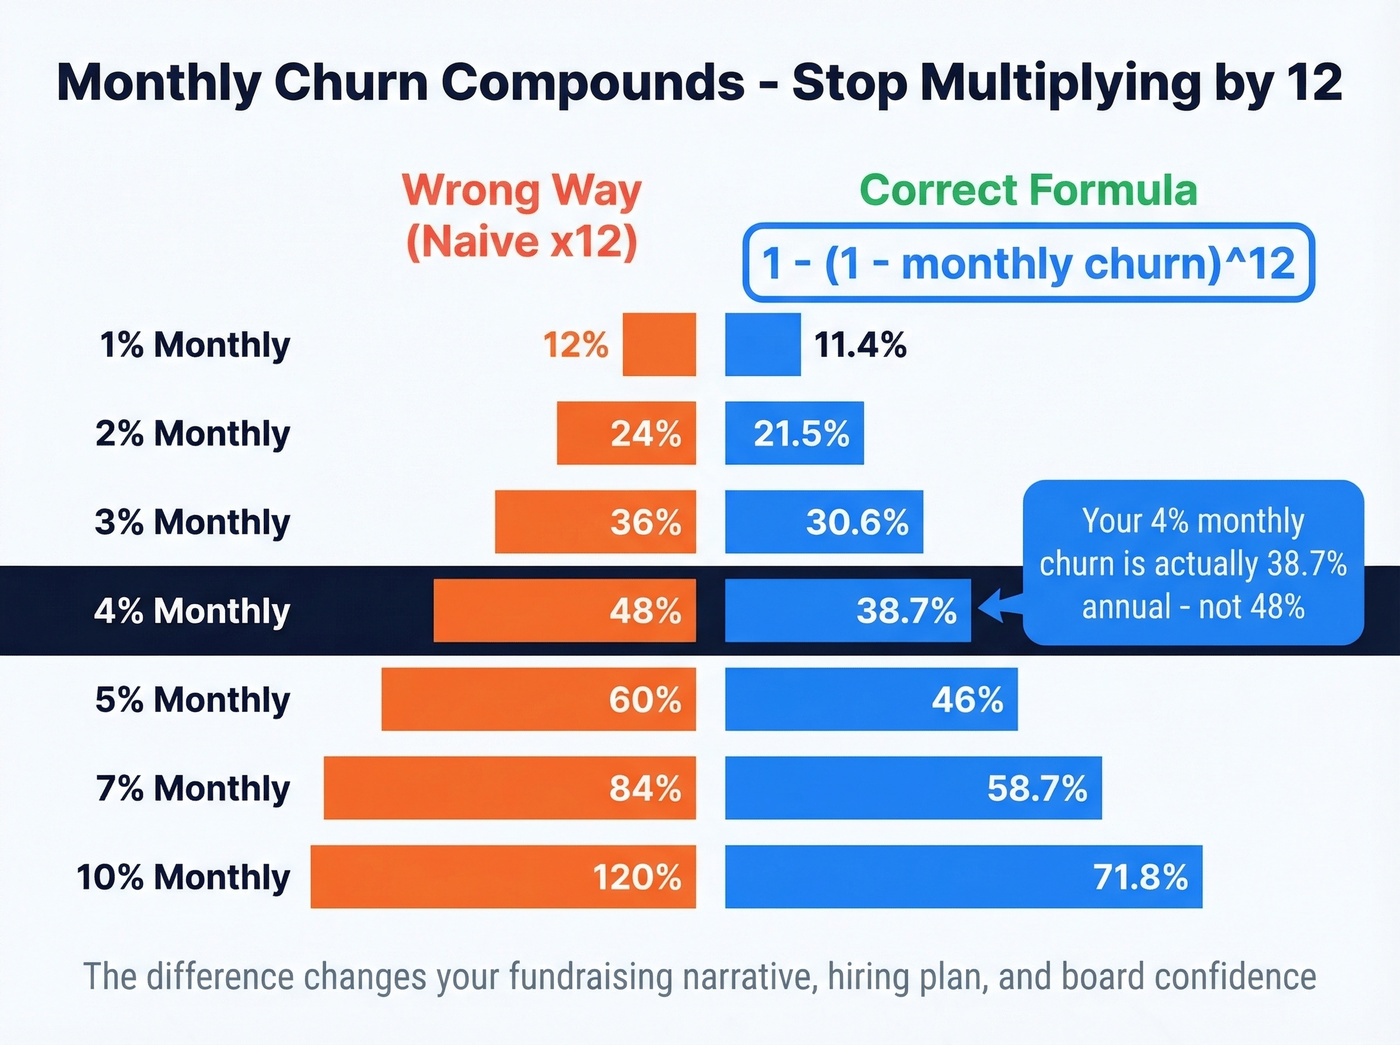
Churn compounds against a shrinking base. If you lose 3% of customers in January, February's 3% applies to the 97% who remained - not the original 100%. The correct formula:
Annual Churn = 1 - (1 - Monthly Churn)^12
So 3% monthly churn = 1 - (0.97)^12 = 30.6% annual, not 36%. At 5% monthly, the gap is even wider: 46% annual vs. the naive 60%.
Here's the full conversion table:
| Monthly Churn | Annual (Naive x12) | Annual (Compounded) |
|---|---|---|
| 1% | 12% | 11.4% |
| 2% | 24% | 21.5% |
| 3% | 36% | 30.6% |
| 4% | 48% | 38.7% |
| 5% | 60% | 46.0% |
| 7% | 84% | 58.7% |
| 10% | 120% | 71.8% |
The difference between 46% and 60% isn't academic - it changes your fundraising narrative, your hiring plan, and your board's confidence level.
If you’re mapping churn back to pipeline and growth targets, keep your funnel metrics consistent with the same compounding logic.
Churn compounds when you're selling to the wrong people. Prospeo's 300M+ verified profiles with 30+ filters - including buyer intent, technographics, and headcount growth - help you target accounts that actually fit your ICP. Better targeting means better-fit customers, and better-fit customers don't churn.
Stop replacing 40% of your customer base every year. Start acquiring the right ones.
Benchmarks by Industry
Every benchmark article gives different numbers because nobody agrees on the formula. GoCardless has documented at least 43 distinct ways to calculate churn - which is why benchmark comparisons across sources are nearly useless without knowing the methodology behind each number.
SaaS Benchmarks:
| Segment | Annual Churn | Source |
|---|---|---|
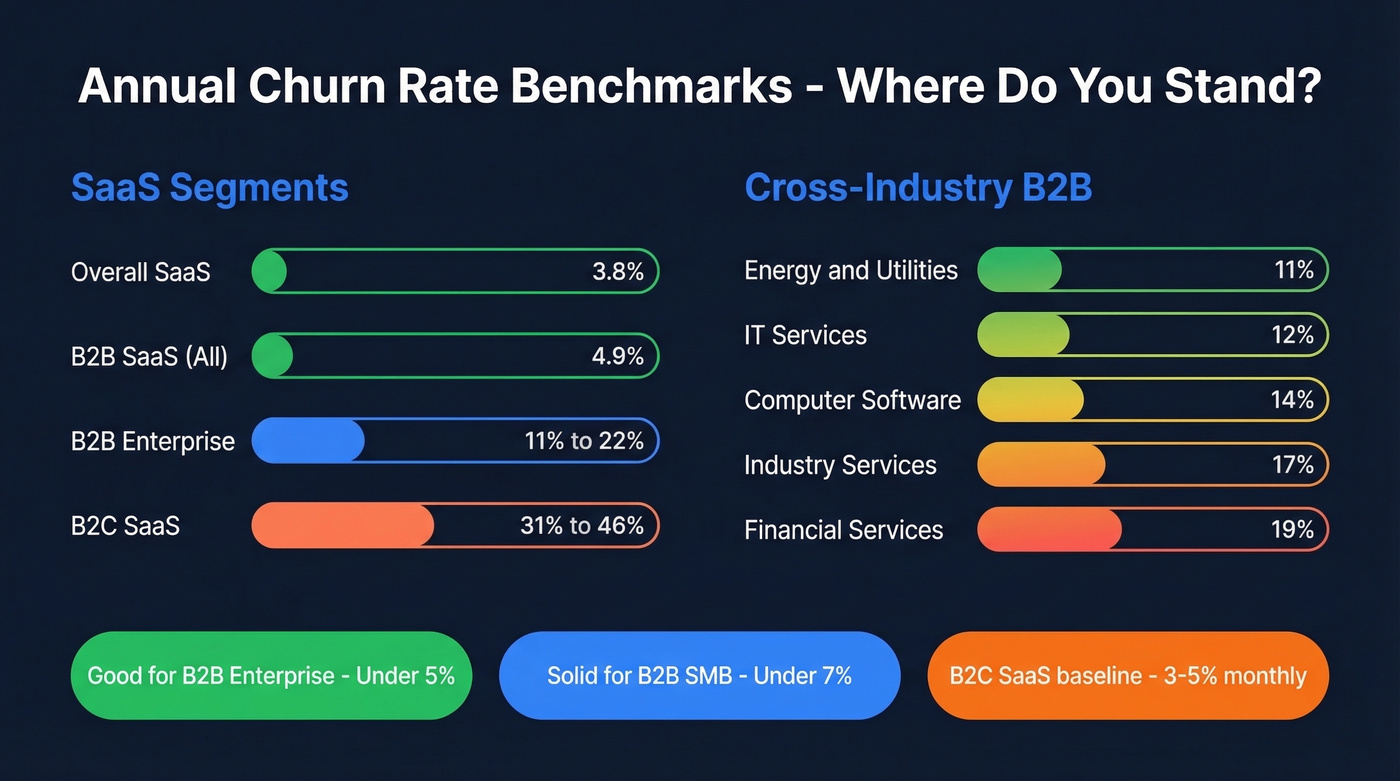
| Overall SaaS | ~3.8% | Vena 2026 |
| B2B SaaS (all) | ~4.9% | Vena 2026 |
| B2B Enterprise | ~11-22% (1-2%/mo) | Statsig |
| B2C SaaS | ~31-46% (3-5%/mo) | Statsig |
| Recurly dataset (overall) | 3.27% | Recurly |
Cross-Industry B2B Benchmarks:
| Industry | Annual Churn |
|---|---|
| Energy / Utilities | 11% |
| IT Services | 12% |
| Computer Software | 14% |
| Industry Services | 17% |
| Financial Services | 19% |
So what's "good"? For B2B enterprise SaaS, keep it under 5% annually. B2B SMB, under 7% is solid. For B2C SaaS, 3-5% monthly churn (about 31-46% annually) is a decent benchmark. In our experience, the companies obsessing over benchmark comparisons are usually avoiding the harder question: why are customers leaving?
Here's a nuance most articles skip: a 15% churn rate isn't automatically fatal. If your LTV:CAC is above 3:1 with a sub-6-month payback, you can run a profitable business at higher churn. The real question is whether you're building a venture-scale company or a cash-flow business - investors care about the distinction. The consensus on r/SaaS is that investors expect B2B enterprise churn around 1-2% monthly, while SMB/self-serve products get more leeway at 3-5% monthly.
One caveat: annual churn smooths over seasonal spikes. If you sell tax software or holiday-adjacent products, monthly cohort analysis will reveal patterns the annual number hides.
Recurly's data also splits churn into voluntary (2.41%) and involuntary (0.86%), and shows that churn decreases as average revenue per customer rises - customers paying more tend to stick longer. That involuntary number matters. We'll come back to it.
Hot take: If your annual churn is under 5% and you're still pouring resources into retention programs instead of expansion revenue, you're optimizing the wrong lever. Below 5%, the marginal return on churn reduction is tiny compared to what a strong upsell motion delivers.
If you’re building that expansion motion, align it with clear upsell vs cross-sell in SaaS plays.
Customer vs. Revenue vs. Net Revenue Churn
GRR and NRR Formulas
Gross Revenue Retention (GRR) measures how much revenue you keep from existing customers, ignoring expansion:
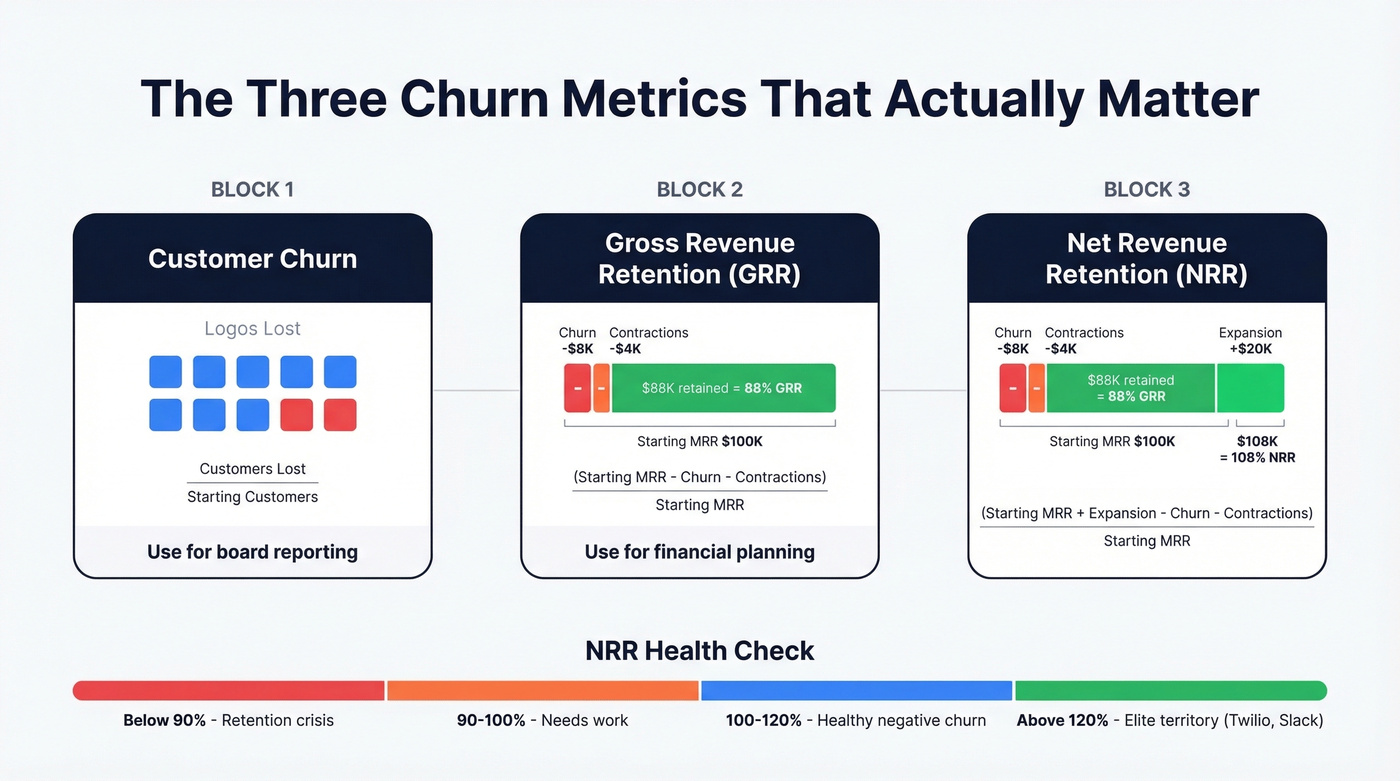
GRR = (Starting MRR - Churn - Contractions) / Starting MRR
Net Revenue Retention (NRR) includes upsells and expansions:
NRR = (Starting MRR + Expansion - Churn - Contractions) / Starting MRR
Let's be honest: revenue churn matters more than customer churn. A company can lose 15% of its logos annually and still grow if expansion revenue from remaining accounts offsets the loss. That's the playbook for every land-and-expand SaaS company.
What Negative Churn Looks Like
Negative churn means your existing customers are spending more than you're losing from cancellations - the holy grail of SaaS economics.
Twilio's S-1 showed dollar-based net expansion rates of 170%, 153%, and 155% from 2013-2015. For every dollar of revenue at the start of each year, existing customers were paying $1.53-$1.70 by year-end. Slack and Shopify followed similar patterns with seat-based and usage-based pricing models that naturally expand as customers grow.
If your NRR is above 100%, you have negative net revenue churn. Above 120%, you're in elite territory. Below 90%? You have a retention problem that no amount of new sales will fix.
If you’re operationalizing retention in account reviews, a tight QBR meaning framework helps keep churn drivers visible.
Five Mistakes That Skew Your Numbers
- Including new customer revenue in retention calcs. Expansion from existing accounts counts. Revenue from brand-new logos doesn't. Mixing them inflates your GRR and NRR.
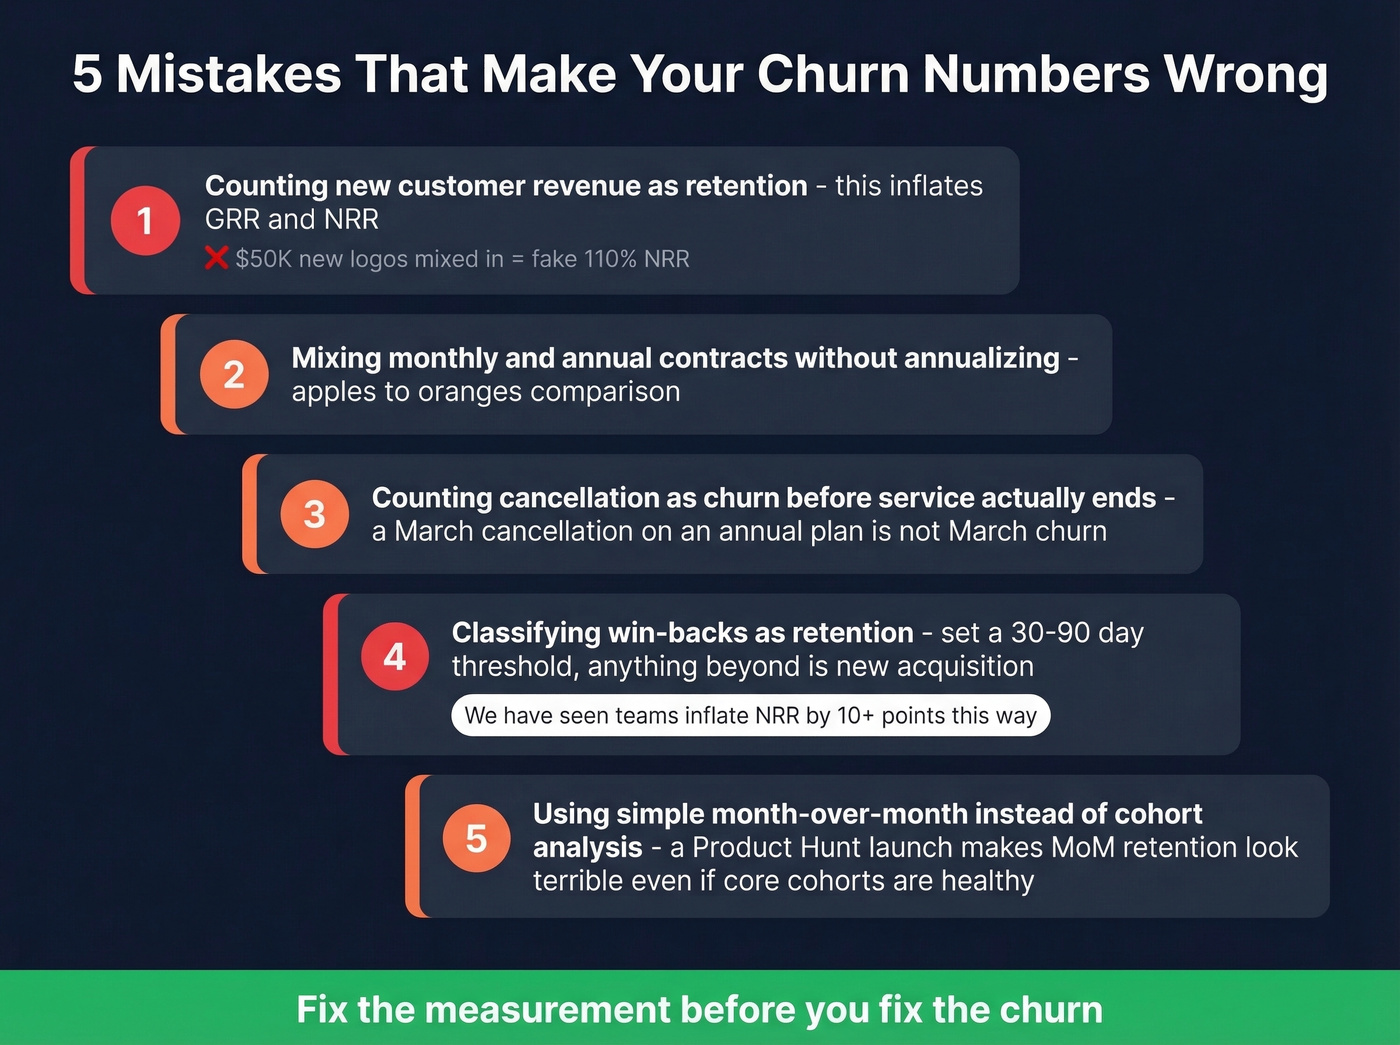
Mixing monthly and annual contracts without annualizing. A monthly subscriber who cancels in month 3 and an annual subscriber who doesn't renew aren't the same event. Annualize everything before comparing.
Treating cancellation as churn before service ends. A customer who cancels an annual plan in March still has service through December. That's cancellation intent, not churn - track them separately.
Classifying win-backs as retention. We've seen teams inflate their NRR by 10+ points just by miscategorizing win-backs. Set a 30-90 day threshold - anything beyond it is new acquisition, not a save.
Using simple month-over-month retention instead of cohort analysis. A Product Hunt launch floods your user base with low-intent signups, making MoM retention look terrible even if core cohorts are healthy. Cohort analysis separates signal from noise.
If you’re trying to connect churn to pipeline execution, audit your sales pipeline challenges alongside retention.
How to Reduce Your Churn
Six tactics, ranked by impact and ease of implementation.
Fix Involuntary Churn First
Involuntary churn accounts for 20-40% of total churn and is entirely preventable. Dunning emails, card-update reminders, and smart payment retry logic can recover most of it. Recurly reports that churn management techniques deliver an average 16x ROI. This is the single easiest win in SaaS - and most companies still ignore it.
Redesign Your Cancellation Flow
Instead of making it hard to cancel, make it easy to stay. A well-designed cancellation experience with pause options, downgrade offers, and feedback collection reduces churn by 15-30%. The goal isn't friction - it's giving customers an alternative they didn't know existed.
Move Customers to Annual Plans
Annual subscribers churn 3-5x less than monthly ones. Offer a meaningful discount of 15-20% and make the annual option the default on your pricing page.
Close the Feedback Loop Fast
NPS programs cut churn by roughly 7% on average, but the real leverage is speed. Closing the loop on feedback within 48 hours drives +8.5% retention improvement - yet only 26% of companies actually do this. INAP cut churn by 50% over two years after implementing a systematic NPS program. The pattern is clear: collect feedback, act on it fast, and tell the customer what you changed.
Find Your Retention Point
Every product has a usage milestone where customers "click" - they've integrated deeply enough that switching costs become real. Customers who reach that point are 3-5x more likely to become long-term users. Find yours and build onboarding around accelerating people toward it.
Clean Your CRM Data
Here's the thing: your CS team can't save at-risk accounts if their contact records have decayed emails and disconnected phone numbers. This is a silent churn driver that nobody talks about. We've watched teams lose accounts simply because a CSM's outreach bounced for three weeks while a champion went quiet. Prospeo's 98% email accuracy and 7-day data refresh cycle keep contact records current, so when your team needs to reach someone, the email actually lands.
If you’re evaluating tooling for this, compare options in contact management software and broader data enrichment services.
Reducing churn by 1-2% can boost enterprise value by 30-50%. That starts with reaching real decision-makers at the right companies. Prospeo delivers 98% email accuracy and 125M+ verified mobile numbers with a 30% pickup rate - so your retention efforts connect with actual humans, not dead inboxes.
Every bounced email is a missed save. Get 98% accurate contact data at $0.01 per lead.
FAQ
Is 10% annual churn rate bad?
For B2B SaaS selling to mid-market and enterprise, 10% is the upper bound of acceptable - investors start discounting valuations above it. For B2C or SMB self-serve products, 10% annually is actually strong. A 15% rate paired with solid unit economics (LTV:CAC above 3:1, sub-6-month payback) can still produce a profitable, growing business.
Can you convert monthly churn to annual by multiplying by 12?
No - churn compounds against a shrinking base each month. A 5% monthly rate equals 46% annual, not 60%. The correct formula is: Annual churn = 1 - (1 - monthly churn)^12. The naive multiplication always overstates actual churn, which distorts financial planning and investor conversations.
What's the fastest way to reduce churn?
Fix involuntary churn first - it accounts for 20-40% of total churn and is entirely preventable with dunning automation, card-update reminders, and payment retry logic. Next, build cancellation flows with pause and downgrade options (15-30% reduction). Then incentivize annual plans, which churn 3-5x less than monthly subscriptions.
How do you keep CRM data fresh enough to prevent churn?
Decayed contact records are a silent churn driver - your CS team can't intervene if champion emails bounce. Tools like Prospeo refresh contact data on a 7-day cycle and maintain 98% email accuracy, ensuring outreach to at-risk accounts actually reaches the right person.