SaaS Churn Rate Benchmarks: Which Number Actually Applies to You
Every SaaS churn rate benchmark you've read gives a different number. One report says 3.27%. Another says 16.25%. A third says "under 5% is good." They can't all be right - and none of them are wrong. The number that matters is the one that matches your ACV, your vertical, and your company stage.
Let's find it.
Quick Reference: Where You Land
- SMB SaaS (monthly logo churn): 3-7%
- Mid-market B2B: 1-3% monthly
- Enterprise: <1% monthly
- Median GRR (all private SaaS): ~89-92%
- Median NRR: ~101-104%
A single average churn rate for SaaS is useless. Your benchmark depends on your ACV, vertical, and company stage. The sections below break each one down.
Why Every Churn Benchmark Contradicts
Recurly's benchmark page puts overall monthly churn at 3.27%. Lighter Capital's 2026 startup benchmarks report pegs median annual customer churn at 16.25% with median revenue churn at 12.50%. Those numbers aren't even in the same universe - and both are correct.
The contradiction comes down to three things: who's in the dataset, how churn is defined, and what time window is measured. Recurly's benchmarks come from subscription businesses on its billing platform. Lighter Capital's are based on 155 private B2B SaaS startups across 11 verticals using connected business data from CY 2020-2024. One measures monthly, the other annual. One reports overall churn with an involuntary component, the other separates customer churn from revenue churn.
"What's the average churn rate?" is the wrong question. The right one: "What's the benchmark for a company that looks like mine?"
The State of SaaS Churn in 2026
The macro trend is encouraging. Paddle's ProfitWell B2B SaaS Index, which tracks cumulative MRR across 34,000+ companies, shows churn improving through mid-2025. Their Churn Index moved from -1.638 in April to -1.545 in May and -1.507 in June - the lowest reading since the end of 2022.
After two years of elevated churn driven by budget tightening and vendor consolidation, the worst of the contraction is over. Whether AI features increasing switching costs deserve credit (Paddle's hypothesis) or it's simply a healthier macro environment, the direction is clear: retention is getting easier, not harder. For teams tracking performance against historical data, your 2024 numbers may already look outdated.
Churn Benchmarks by Segment
Here's where the data gets useful. Three dimensions actually matter.
By Company Size
| Segment | Monthly Logo Churn | Annual Logo Churn | Notes |
|---|---|---|---|
| SMB (<$5k ACV) | 3-7% | 30-60% | High volume, low touch |
| Mid-Market ($5k-$50k) | 1-3% | 11-30% | CS-driven retention |
| Enterprise ($50k+) | <1% | <10% | Multi-year contracts |
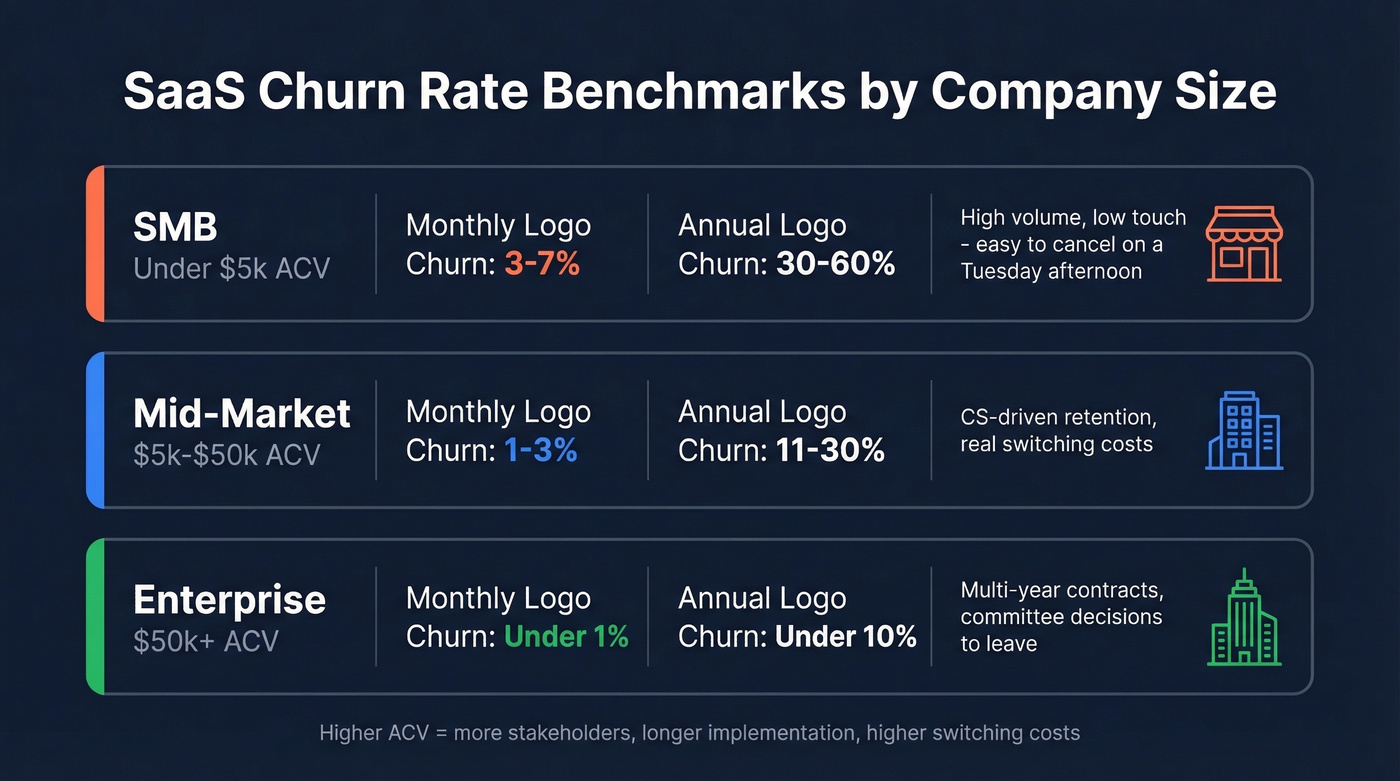
The pattern is intuitive: higher ACV means more stakeholders involved in the buying decision, longer implementation cycles, and higher switching costs. A $200/mo tool gets cancelled on a Tuesday afternoon. A $50k/year platform requires a committee meeting, a migration plan, and six months of internal debate.
By Vertical
Vertical matters more than most teams realize. Lighter Capital's data shows education-sector customer churn doubling from 11% in 2024 to 22% in 2025, with education revenue churn up 71% and healthcare revenue churn up 67%. Meanwhile, DTC subscription businesses average 6.5% monthly churn versus 3.8% for B2B software and professional services.
The gap between 16.25% median customer churn and 12.50% median revenue churn across all verticals tells its own story: higher-value customers churn less frequently. If you're in edtech or healthtech, don't benchmark against generic cross-industry datasets. Your vertical has its own gravity.
By Pricing Model and ARPU
This one's underappreciated. Baremetrics data via Vitally shows a clear inverse relationship between ARPU and churn at the high end: customers paying more than $250/month have the lowest churn rates in the table. It isn't just about the money - higher price points attract more committed buyers who've done real evaluation before purchasing.
Raising prices can actually reduce churn. Sounds counterintuitive, but filtering out low-intent buyers at the pricing gate means fewer cancellations downstream. One operator on r/SaaS reported that raising prices was one of six tactics that drove their lowest-ever monthly churn.
Here's the thing: if your deal size is under $1k and monthly churn exceeds 5%, your first move shouldn't be a retention campaign. It should be a price increase. You'll lose some volume and gain better customers.
Higher ACV deals churn less - but only if you're reaching the right buyers. Prospeo's 30+ filters let you target by intent signals, company growth, funding stage, and department headcount so you land customers who fit your ICP and stay.
Stop acquiring customers who were always going to churn.
GRR vs. NRR - The Metrics Investors Want
If you're talking to investors or a board, they don't care about your monthly churn rate. They want GRR and NRR.
| Metric | Median | Top Quartile | What It Tells You |
|---|---|---|---|
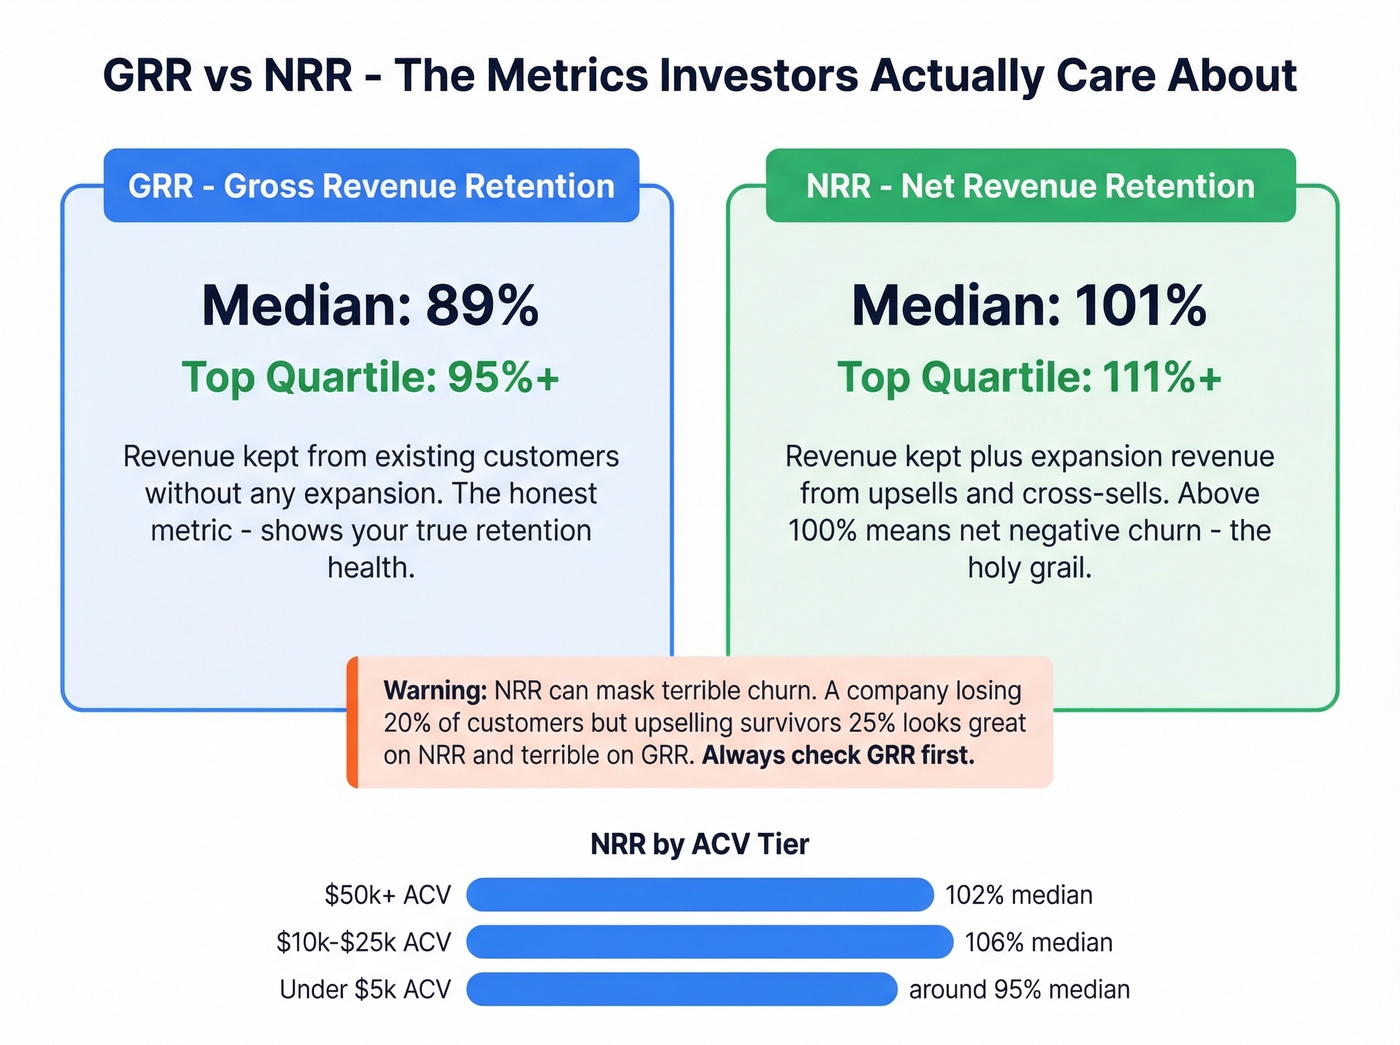
| GRR | 89% | 95%+ | Revenue kept without expansion |
| NRR | 101% | 111%+ | Revenue kept + expansion revenue |
NRR segments cleanly by ACV. For companies with $25k-$50k ACV, median NRR is 102% with a top quartile of 111%. At $10k-$25k ACV, median NRR sits at 106%. Below $5k ACV, it drops to around 95%.
When NRR exceeds 100%, you have net negative churn - existing customers are growing revenue faster than lost customers are shrinking it. This is the holy grail for SaaS businesses, and it's why investors obsess over the metric.
Let's be honest though: GRR is the more honest metric. NRR can mask terrible churn with aggressive expansion revenue. A company losing 20% of customers annually but upselling the survivors 25% looks great on NRR (100%+) and terrible on GRR. If you're evaluating a SaaS business - yours or someone else's - look at GRR first.
Product-level retention metrics like DAU/MAU and 30/60/90-day cohort retention are leading indicators of subscription churn, but they're a separate measurement. Track both.
Benchmarks by Company Stage
Bootstrapped cohort data from a survey of 1,000+ private SaaS companies at $3M-$20M ARR gives us clean stage-specific numbers:
- Median NRR: 104%
- 90th percentile NRR: 118%
- Median GRR: 92%
- 90th percentile GRR: 98%
Strong numbers. But early-stage companies should beware "false positive retention."
If you launched 18 months ago, most of your customer base hasn't had time to churn yet. Annual contracts haven't come up for renewal. Your GRR looks amazing because the clock hasn't run out - not because your product is sticky. We've seen this pattern repeatedly: founders celebrate 95%+ GRR at $1M ARR, then watch it crater to 80% as the first wave of renewals hits. Average customer churn in SaaS tends to spike between months 12 and 18 as those initial contracts come due.
Stop Multiplying Monthly Churn by 12
This is the most common math mistake in SaaS. If your monthly churn is 5%, your annual churn isn't 60%. It's 46%.
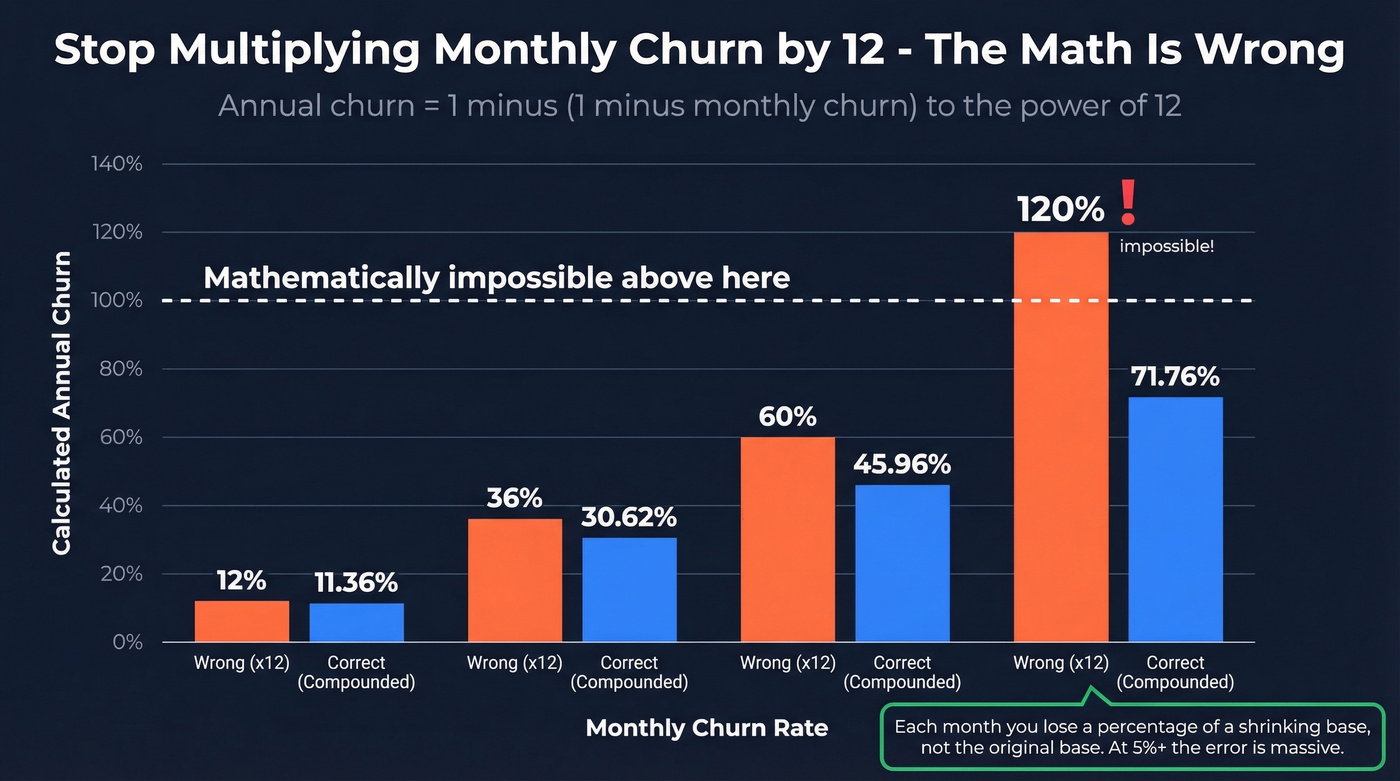
Annual churn = 1 - (1 - monthly churn)^12
| Monthly Churn | Wrong (x12) | Correct (Compounded) |
|---|---|---|
| 1% | 12% | 11.36% |
| 3% | 36% | 30.62% |
| 5% | 60% | 45.96% |
| 10% | 120% (!) | 71.76% |
Each month, you're losing a percentage of a shrinking base, not the original base. At 1% monthly the difference is small. At 5%+ it's massive. And at 10% monthly, simple multiplication gives you an impossible 120% - which should've been the first clue the math was wrong.
What Actually Reduces Churn
Benchmarks tell you where you stand. Here's what moves the number.
Tighten Your ICP First
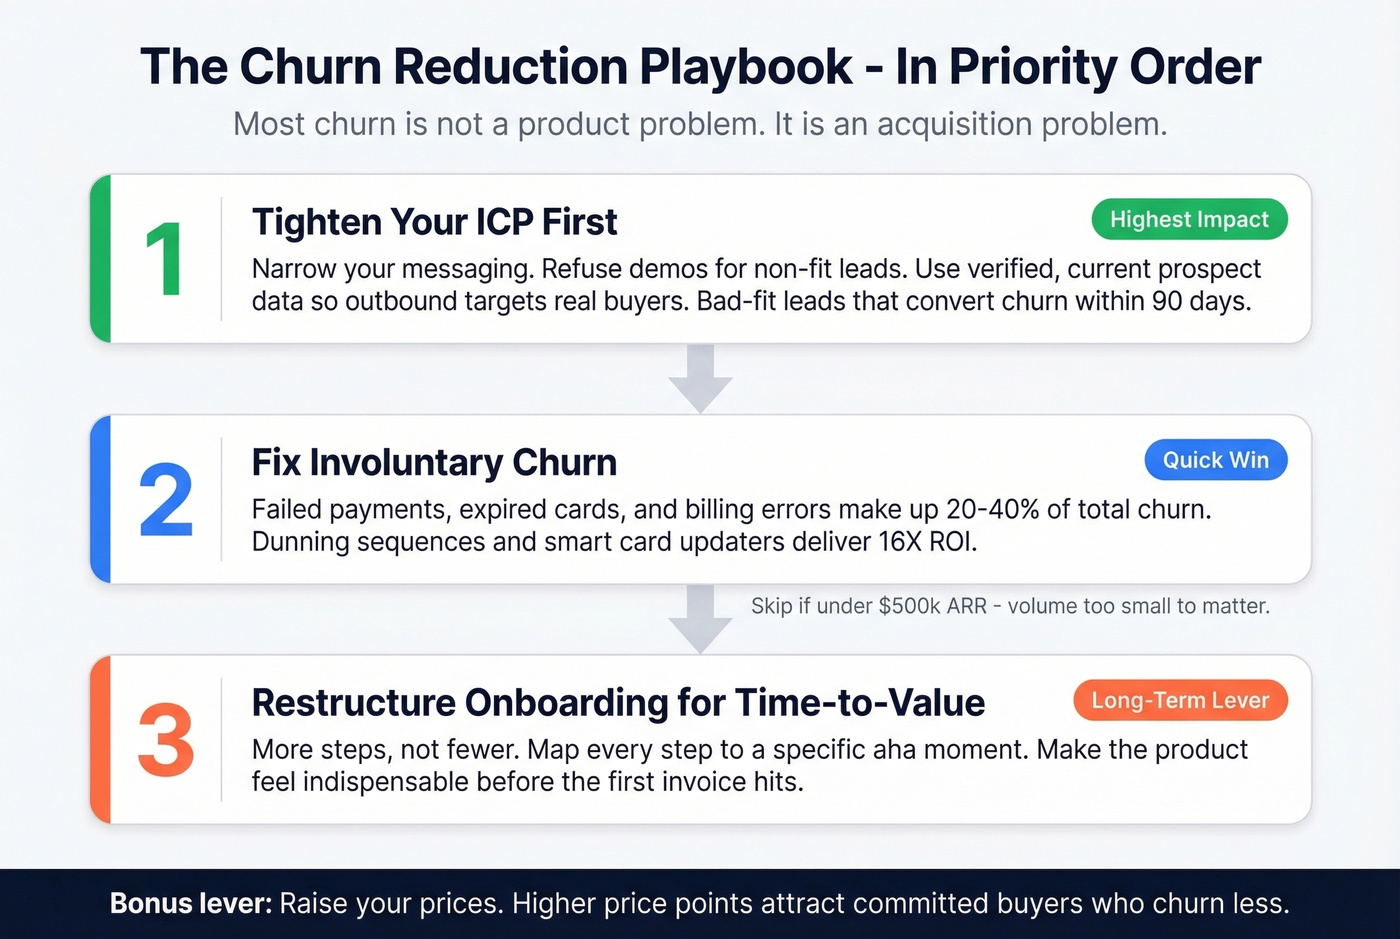
Most churn isn't a product problem. It's an acquisition problem. You signed the wrong customer, they never got value, and they left. The r/SaaS thread where an operator shared their lowest-ever churn tactics is instructive - the top two levers were narrowing ICP messaging and refusing demos for non-fit leads. Not product changes. Not feature launches. Better targeting.
Data quality compounds here. If your outbound team works off stale prospect data, you're filling the pipeline with contacts who've changed roles and companies that no longer fit your ICP. Those bad-fit leads that do convert churn within 90 days. Prospeo's 7-day data refresh cycle and 98% email accuracy mean the contacts entering your pipeline are current and verified, so fewer sales cycles get wasted on prospects who were never a good fit. Improving customer retention starts well before the contract is signed.
If you want a deeper framework, start with a proper churn analysis and a clear Ideal Customer Profile.
Fix Involuntary Churn
Overall churn of 3.27% splits into voluntary (2.41%) and involuntary (0.86%). That involuntary slice - failed payments, expired cards, billing errors - represents 20-40% of total churn for many SaaS companies. And it's almost entirely fixable with dunning sequences, smart card updaters, and intelligent payment retries. Recurly reports that using these techniques delivered an average 16X ROI for merchants.
Skip this section if you're pre-revenue or under $500k ARR. Your involuntary churn volume is too small to move the needle. Focus on ICP and onboarding instead.
Restructure Onboarding for Time-to-Value
The same Reddit operator found that adding more onboarding steps - not fewer - reduced churn. More structured onboarding sets expectations, surfaces value early, and filters out users who aren't serious. The key isn't fewer steps. It's faster time-to-value within those steps.
In our experience, the companies with the best retention don't have the shortest onboarding. They have the most intentional onboarding, where every step maps to a specific "aha moment" that makes the product feel indispensable before the trial ends or the first invoice hits.
If you're building a retention motion, it helps to align churn work with your renewal rate targets and your broader SaaS sales process.
Net negative churn starts with expansion - and expansion starts with reaching decision-makers in your existing accounts. Prospeo gives you 98% accurate emails and 125M+ verified mobiles to multi-thread into accounts before renewal risk even surfaces.
Turn your install base into a growth engine for $0.01 per contact.
FAQ
What is a good SaaS churn rate?
For mid-market B2B SaaS, under 2% monthly (roughly 21% annual) is strong; enterprise companies should target under 1% monthly. SMB SaaS typically runs 3-7% monthly. On an annual basis, established B2B businesses often aim for 3.5-5% annual churn, while SMB and early-stage companies can run much higher.
How does average churn differ between B2B and B2C SaaS?
B2C subscription businesses average roughly 6.5% monthly churn, nearly double the 3.8% rate for B2B software. The gap comes from switching costs, multi-stakeholder buying processes, and integration dependencies that make B2B cancellation harder. B2C subscriptions are often impulse purchases with one-click cancellation.
What's the difference between logo churn and revenue churn?
Logo churn counts customers lost; revenue churn measures MRR lost. Revenue churn matters more because losing one $50k/year enterprise account has a completely different impact than losing one $500/year SMB account. Lighter Capital's data confirms this: median customer churn runs 16.25% while revenue churn is only 12.50%.
How do you calculate monthly churn rate?
Monthly churn rate = (customers lost during the month / customers at the start of the month) x 100. If you started with 500 customers and lost 15, your monthly churn is 3%. Don't annualize by multiplying by 12 - use the compounding formula: annual churn = 1 - (1 - monthly churn)^12. At 3% monthly, that's 30.6%, not 36%.
How can better prospect data reduce SaaS churn?
Stale or inaccurate prospect data fills your pipeline with bad-fit leads who churn within 90 days. When your outbound team targets current, ICP-matched contacts with verified information, fewer bad-fit signups make it through - and that means structurally lower churn without any product changes.