Renewal Rate: Formula, Benchmarks & How to Improve in 2026
A 5% increase in retention can lift profits by 25-95%. That's a widely cited Bain finding that's been floating around for years. Yet most SaaS companies can't agree internally on how to calculate their own renewal rate - let alone whether the number they're reporting to the board is actually correct.
What Is Renewal Rate?
Renewal rate measures the percentage of customers (or revenue) that renews when contracts come up for renewal. The basic formula:
Renewal Rate = (Renewals / Eligible Renewals) x 100
If 1,000 customers were up for renewal this quarter and 850 renewed, your rate is 85%. Simple enough on the surface. The complexity hides in what counts as "eligible," whether you're measuring by logos or dollars, and how you handle edge cases like mid-cycle cancellations and reactivations.
The metric matters because it isolates your ability to retain existing business at the moment of truth - the contract decision point.
The Quick Version
- Start with GRR. It's the most common standardized retention metric for board and investor reporting.
- Benchmark yourself. Median GRR is 92% for bootstrapped B2B SaaS at $3M-$20M ARR. Below that, you're below the median for that cohort.
- Your number is probably wrong. Most companies make at least one of the calculation mistakes covered below, especially around aggregation periods and denominator definitions.
How to Calculate Renewal Rate
There are two fundamentally different ways to calculate this metric, and they can produce wildly different numbers from the same data set.
Count-Based (Logo) Formula
Logo Renewal Rate = (Customers Who Renewed / Customers Eligible to Renew) x 100
This treats every customer equally. A $500/month startup and a $50,000/month enterprise account each count as one. It's clean, easy to compute, and works well when your customer base is relatively homogeneous - say, all $99/month plans.
Revenue-Based (Dollar) Formula
Revenue Renewal Rate = (Renewed Revenue / Revenue Eligible for Renewal) x 100
This weights by contract value. The divergence from logo rates can be dramatic.
Here's a classic example from Maxio: two customers are up for renewal - one at $10K/year and one at $100K/year. The $10K customer churns; the $100K customer renews. Your logo rate is 50%. Your revenue rate is 91%. Same data, completely different story.
| Metric | Formula | Result |
|---|---|---|
| Logo rate | 1 / 2 | 50% |
| Revenue rate | $100K / $110K | 91% |
Dollar-based rates often exceed account-based rates because larger accounts are stickier and subsidize churn from smaller ones. Threads on r/FPandA consistently flag this divergence as a source of confusion in board reporting.
When Revenue Renewal Exceeds 100%
If you include expansion revenue - upsells, cross-sells, price increases - your rate can exceed 100%. In the Maxio example, if that $100K customer renews with a 10% price increase, you've got $110K renewed against $110K eligible: a 100% revenue figure despite losing half your logos. Add a bigger upsell and you're above 100%. This is where the line between "renewal rate" and "net revenue retention" starts to blur.
Types of Renewal Rate
The term is doing a lot of heavy lifting. Depending on who's talking, it could mean any of these:
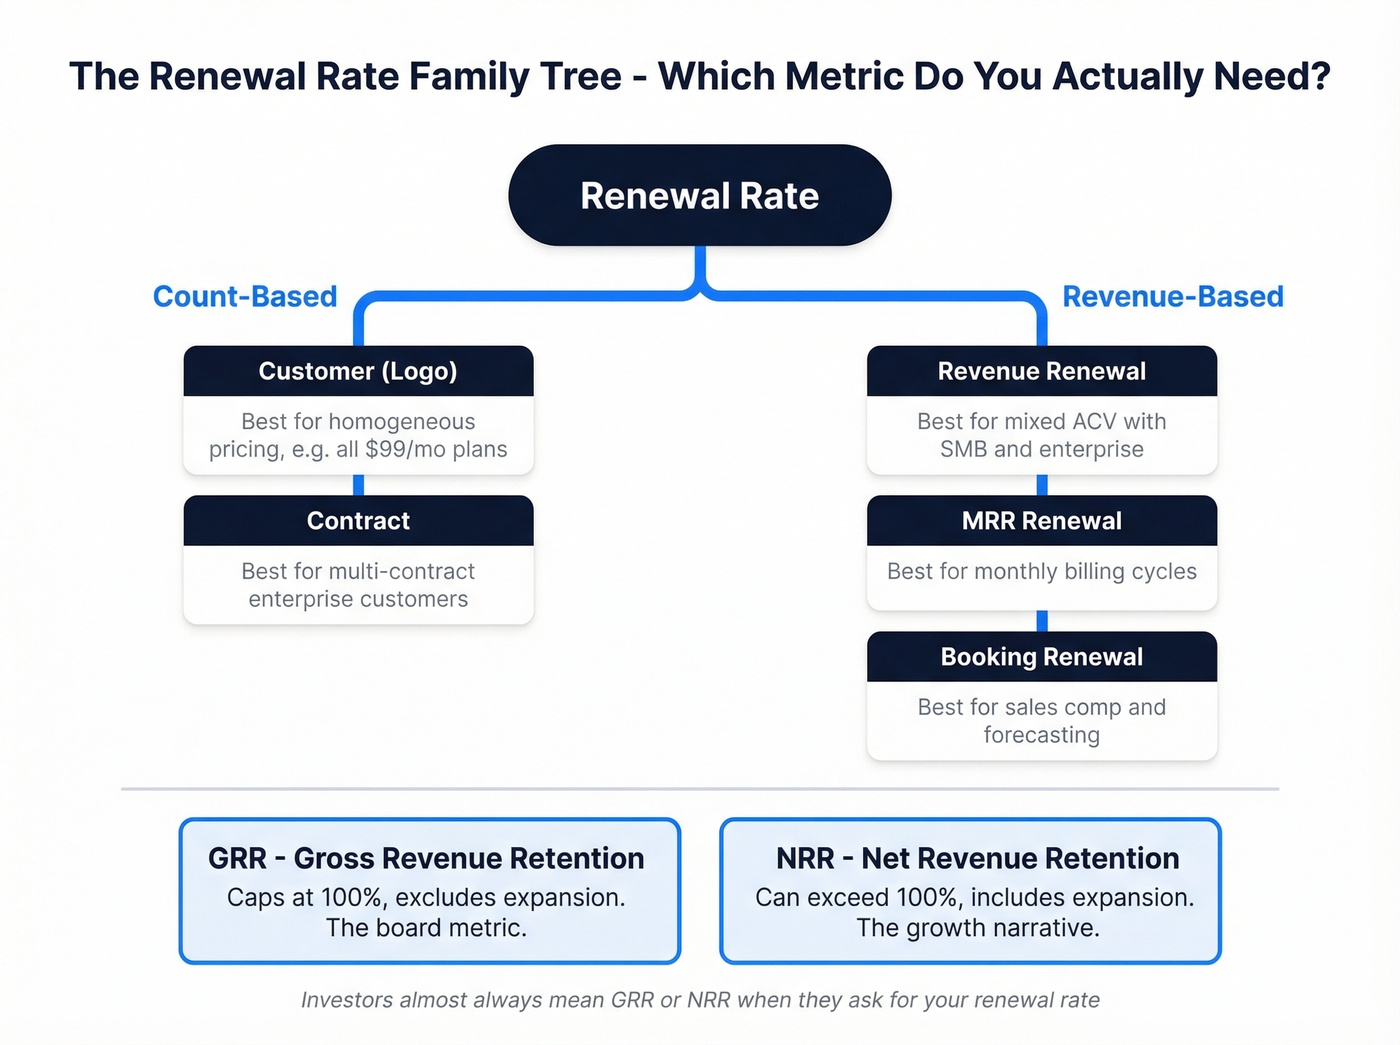
| Type | Formula | When to Use |
|---|---|---|
| Customer (logo) | Renewed customers / eligible | Homogeneous contracts, e.g. all $99/mo plans |
| Revenue | Renewed $ / eligible $ | Mixed ACV with SMB + enterprise |
| MRR renewal | Renewed MRR / eligible MRR | Monthly billing cycles |
| Booking renewal | Renewal bookings / contract value | Sales comp and forecasting |
| Contract renewal | Renewed contracts / eligible | Multi-contract customers |
| GRR | (Start MRR - churn - contraction) / Start MRR | Board reporting; caps at 100% |
| NRR | (Start MRR + expansion - churn - contraction) / Start MRR | Growth narrative; can exceed 100% |
GRR and NRR aren't technically "renewal rates" - they're retention metrics calculated from a cohort's starting MRR. But they're the closest thing to a standardized, comparable metric in SaaS, which is why investors default to them. If someone asks for your "renewal rate" in a board meeting, they almost certainly mean GRR or NRR.
Here's the key distinction: GRR excludes expansion revenue and caps at 100%. NRR includes expansion and is unbounded. A company with 88% GRR and 115% NRR is losing customers but more than making up for it with upsells - a very different story than a company with 95% GRR and 101% NRR. The first company has a leaky bucket masked by expansion. The second has a tight bucket with modest growth.
We'd take the second company every time.
Your renewal rate depends on landing the right customers in the first place. Prospeo's 30+ filters - including buyer intent, technographics, and headcount growth - help you target accounts that stick, not ones that churn at the first renewal cycle.
Better targeting today means higher renewal rates tomorrow.
Renewal Rate vs. Retention vs. Churn
These three metrics get used interchangeably, and they shouldn't be.
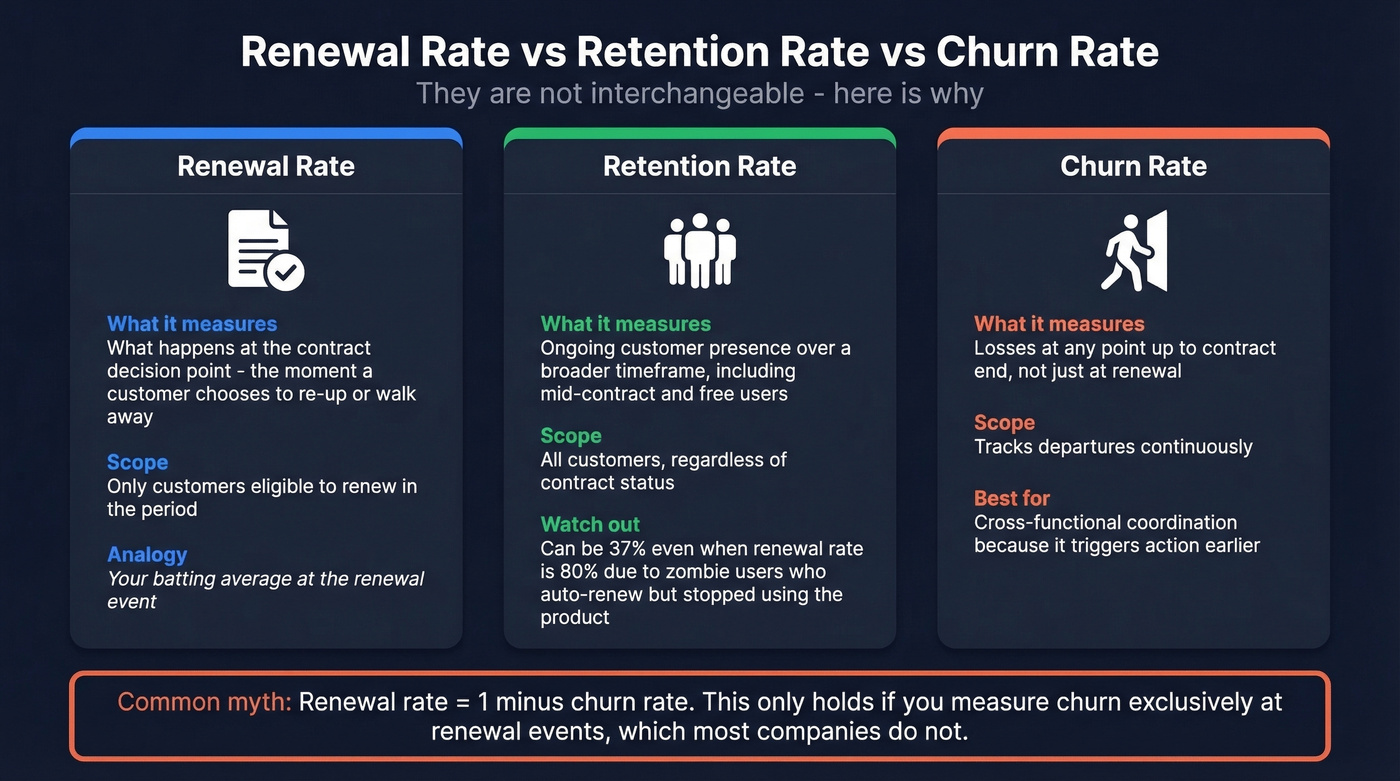
Renewal rate measures what happens at the contract decision point - the moment a customer actively chooses to re-up or walk away. Think of it as your batting average at the renewal event.
Retention rate measures ongoing customer presence over a broader timeframe, including free users and customers who are mid-contract. It captures a wider population.
Churn rate tracks losses at any point up to contract end, not just at the renewal moment. It's useful for cross-functional coordination because it triggers action earlier.
Here's the thing: renewal and retention rates can tell completely different stories. A company can have an 80% renewal rate but only 37% retention rate. The gap? "Zombie users" - customers who auto-renew but have stopped using the product. They're paying, so your renewal number looks fine. But they're one budget review away from churning.
The common shorthand "renewal rate = 1 - churn rate" only holds if you're measuring churn exclusively at renewal events, which most companies don't. (If you want a clean definition set, start with churn.)
2026 Benchmarks
Let's look at what the data actually says. Most recent available data reflects 2024-2025 performance across multiple survey sources.
SaaS Benchmarks by Source
| Source | Metric | Benchmark | Top Decile |
|---|---|---|---|
| SaaS Capital | GRR | 92% (median) | 98% |
| SaaS Capital | NRR | 104% (median) | 118% |
| Benchmarkit | GRR | 88% | - |
| Benchmarkit | NRR | 101% | - |
| KeyBanc | Gross retention | 86% (2023) | - |
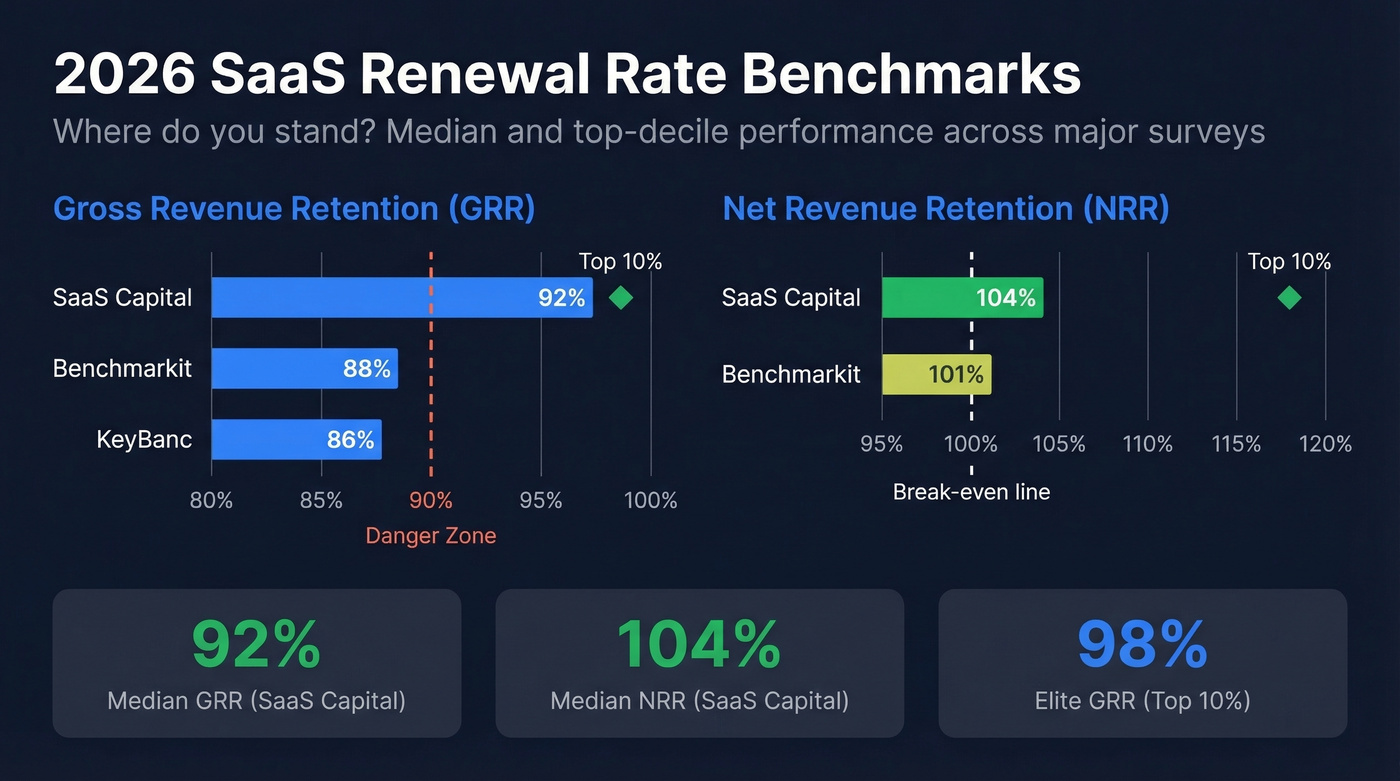
SaaS Capital's dataset includes 1,000+ private SaaS companies and provides benchmarks for bootstrapped B2B SaaS with $3M-$20M ARR. If you're in that cohort and your GRR is below 92%, you're below the median. Above 98% and you're elite.
If you're trying to connect renewal performance to pipeline quality, it helps to track adjacent funnel metrics alongside retention.
Net Dollar Retention Trends
The trend lines aren't encouraging. Benchmarkit shows GRR declining from 90% to 88% over three years. KeyBanc's survey pegged gross retention at 86% in 2023, with expectations of it approaching 90% - but "approaching" isn't "reaching." The net dollar retention benchmark has compressed too, with Benchmarkit's headline NRR at 101%, barely above the break-even line.
Retaining and expanding existing customers is getting harder. Buyers are more cost-conscious, procurement teams are more aggressive, and the easy expansion revenue from 2021-2022 has dried up. If your NRR is below 105% heading into 2026, you don't have an expansion motion - you have a pricing page.
Benchmarks Outside SaaS
SaaS doesn't own this concept. Associations and membership organizations often run around 80-90%, with well-run organizations pushing above 90%. Insurance policy renewals vary widely by line but practitioners typically cite 85-90%+. Enterprise logo rates for B2B software typically run 85-95%+, though these numbers are harder to benchmark because fewer companies report them publicly.
Common Calculation Mistakes
We've seen teams report numbers that look healthy on the surface but hide serious problems underneath. In our experience, the biggest gap is between what companies report to the board and what the monthly data actually shows.
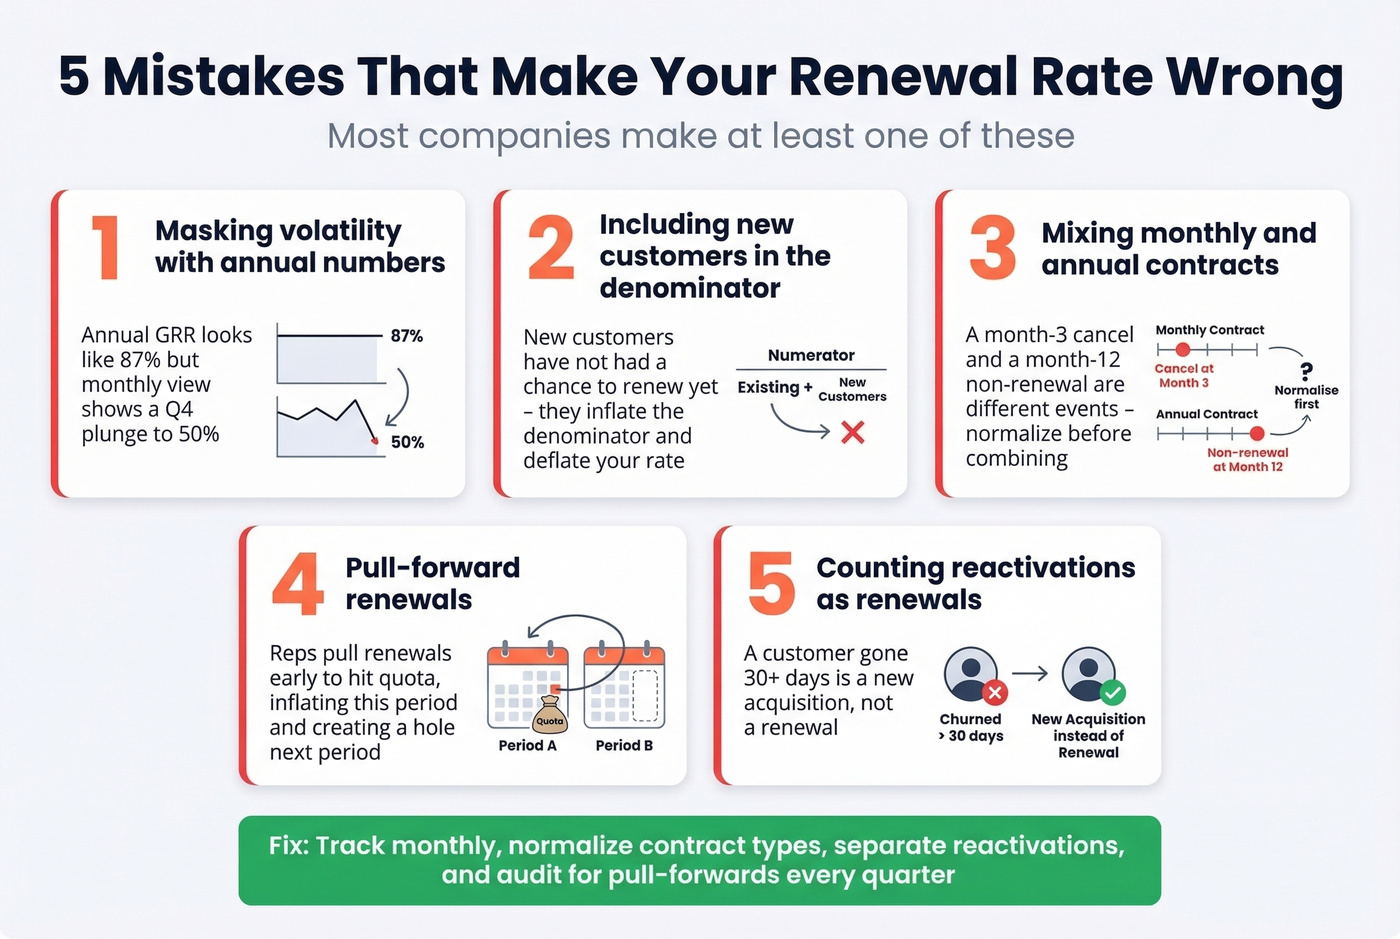
1. Aggregating annual numbers that mask intra-year volatility. SaaS Capital walks through a scenario where annual GRR looks like a respectable ~87.5%, but the monthly view reveals a plunge to ~50% in Q4. If you'd only looked at the annual number, you'd have missed a crisis. Track monthly, compare to the year-ago month.
2. Including new customers in the denominator. Your calculation should only count customers who were eligible to renew during the period. New customers acquired mid-period haven't had a chance to renew yet. Including them inflates your denominator and deflates your rate.
3. Mixing monthly and annual contracts without normalizing. A monthly customer who cancels in month 3 and an annual customer who doesn't renew at month 12 are fundamentally different events. Annualize or normalize before combining them, or you'll get a blended number that doesn't mean anything useful.
4. Pull-forward renewals inflating the number. This one comes straight from r/FPandA: reps pull renewals forward to hit quota, which inflates the current period's rate and creates a hole in the next period. Add discounting to sweeten the early renewal, and you've compounded the distortion. If your numbers look suspiciously good in Q4, check for pull-forwards.
5. Counting reactivations as renewals. A customer who churned three months ago and comes back isn't a renewal - they're a new customer. Treat any customer gone 30-90 days as a new acquisition to avoid inflating retention metrics.
If you want a more rigorous way to diagnose what's actually driving losses, do a proper churn analysis before you change the playbook.
How to Improve Your Renewal Rate
Selling to an existing customer has a 60-70% success rate versus 5-20% for new prospects. Every point of improvement compounds directly into LTV.
Onboarding and Engagement
Most churn is seeded in the first 90 days. If a customer doesn't reach their first value milestone quickly, the renewal conversation 12 months later is already uphill.
Instrument your onboarding flow to track time-to-value, flag accounts that stall, and trigger CS intervention before the customer mentally checks out. On the engagement side, monitor product usage at the account level, not just the admin. If fewer than 30% of licensed seats are active, flag the account for outreach - that's a zombie renewal waiting to happen. Build health scores that weight breadth of adoption, incorporating NPS and CSAT signals alongside usage data, not just depth of a single power user. Layering churn prediction models on top of these health scores lets your CS team prioritize the accounts most likely to lapse before the renewal window even opens.
Align to the Buyer's Calendar
Here's where most renewal playbooks stop being useful - they tell you to "start 90 days before renewal" as if every customer operates on the same timeline. They don't.
ChurnZero's renewal strategy research makes a sharp point: renewals aren't won on ROI alone anymore. Buyers prioritize cash flow and cost efficiency. Survey your customers for their budgeting season and procurement process. If your renewal lands in January but their budget cycle closes in October, you're three months late to the conversation.
Build pricing and terms guardrails for your CS team - pre-authorized discount thresholds, flexibility on payment terms, and early-renewal incentives that reduce back-and-forth. Every escalation to a manager adds days to the renewal cycle and increases the chance of a "let's just pause for now" outcome.
Kill Involuntary Churn
Failed payments are the silent killer of renewal rates. Expired credit cards, declined charges, outdated billing details - none of it has anything to do with product satisfaction. Implement proper dunning sequences: pre-expiry card update reminders, retry logic on failed charges, and a graceful degradation flow instead of hard cutoff.
If you're measuring the impact of these fixes, pair renewal rate with pipeline health so you can separate retention issues from demand issues.
Fix Your Contact Data
This is the renewal failure mode nobody talks about: your CS team sends the renewal email, and it bounces. They call the champion's direct line, and it's disconnected. The contact left the company six months ago, and nobody updated the CRM.
Stale contact data causes preventable churn. It's not a product problem or a relationship problem - it's an infrastructure problem. And it's more common than most teams admit. If your renewal contacts are stale, run them through an enrichment tool like Prospeo to get updated emails, direct dials, and flag job changes that signal a new stakeholder you need to build a relationship with. A 7-day data refresh cycle catches the contact decay that causes renewals to slip through the cracks, and intent data can surface signals that a renewal account is researching competitors before the conversation even starts.
To operationalize this, most teams end up standardizing on data enrichment services and a dedicated lead enrichment workflow.
Losing logos to bad-fit customers tanks your GRR. Prospeo gives you 300M+ profiles with 98% email accuracy and intent data across 15,000 topics - so your pipeline is full of buyers who actually need your product long-term.
Stop filling your funnel with future churn. Start with better data.
FAQ
Can renewal rate exceed 100%?
Yes, when measured by revenue. If existing customers expand through upsells beyond their prior contract value, revenue-based renewal rate exceeds 100%. This is functionally the same as NRR. Logo-based measurement caps at 100% because you can't renew more customers than were eligible.
What's the difference between GRR and NRR?
GRR caps at 100% and excludes expansion - it measures how much existing revenue you kept. NRR includes expansion from upsells, so it can exceed 100%. Median NRR for private SaaS sits around 101-104% depending on the dataset. GRR is the cleaner measure of retention health; NRR tells the growth story.
How often should I measure renewal rate?
Monthly, compared to the year-ago month. Annual aggregation hides intra-year volatility - SaaS Capital documented a case where annual GRR looked like ~87.5% but monthly data revealed a Q4 plunge to ~50%.
Is renewal rate the same as retention rate?
No. Renewal rate measures the contract decision event specifically. Retention rate measures ongoing customer presence over a period and can include free users. High renewal rates with low retention signal zombie users who auto-renew without engaging - a ticking time bomb.
How does stale CRM data hurt renewals?
Outdated contacts cause renewal outreach to bounce or reach departed champions, turning winnable renewals into silent churn. Running your renewal pipeline through an enrichment tool catches departed stakeholders before they become missed renewals.