Churn Rate Formula: Calculate Churn Correctly in 2026
Your VP of Finance says churn is 5% in the board deck. Your ops dashboard says 12%. Your CS lead swears it's "getting better." Everyone's looking at different numbers, and nobody's wrong - they're just calculating differently. At last count, there were 43 different ways public SaaS companies accounted for retention, and most of them produce a different answer.
Here's every churn rate formula that actually matters, the benchmarks to measure against, and the mistakes that make your number meaningless.
Quick Reference: Core Formulas
Customer churn rate = (Customers lost / Customers at start of period) x 100
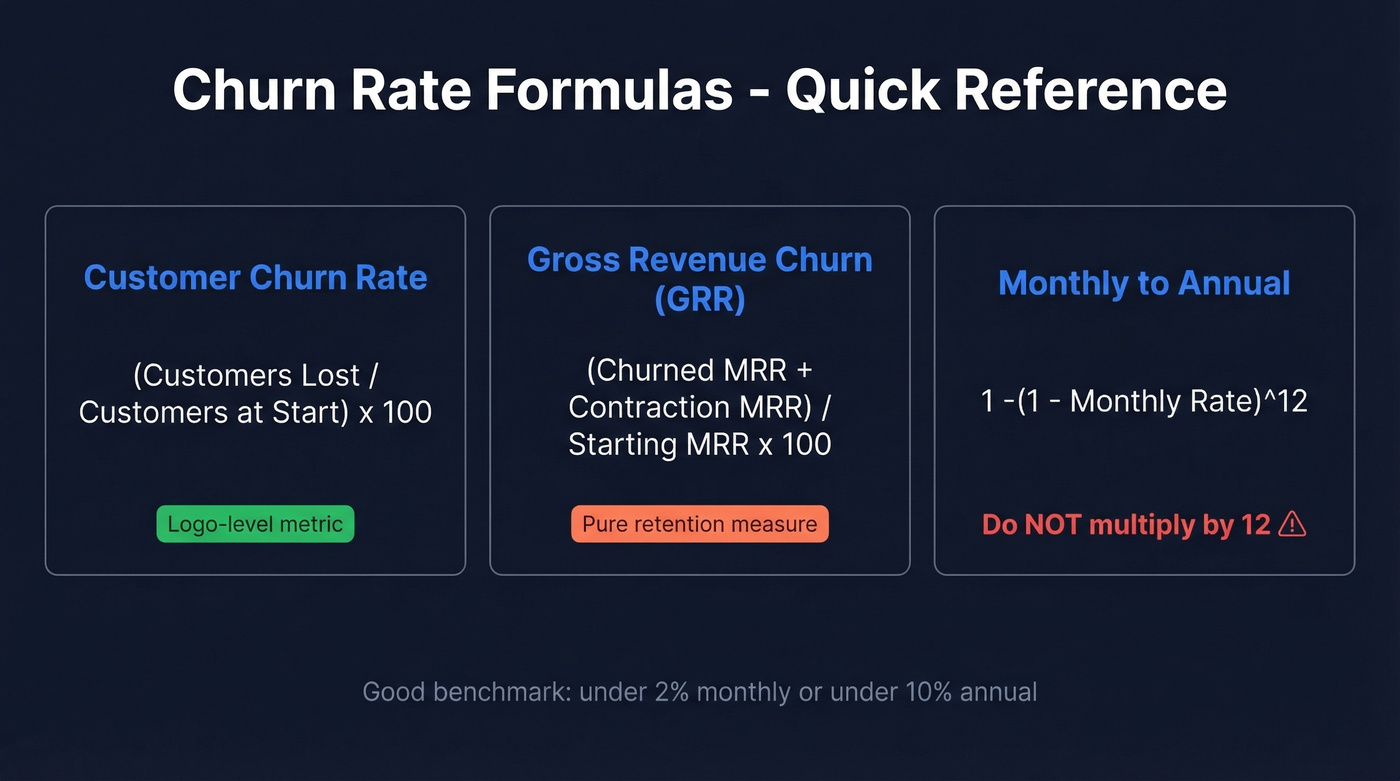
Gross revenue churn = (Churned MRR + Contraction MRR) / Starting MRR x 100
Monthly to annual conversion = 1 - (1 - monthly churn rate)^12
A "good" rate for most SaaS companies is under 2% monthly or under 10% annual - but your vertical and company stage matter far more than any single benchmark. Below you'll find worked examples, revenue churn variants, and 2026 benchmarks broken down by vertical, stage, and pricing model.
The Customer Churn Rate Formula
The basic calculation is straightforward:
Customer Churn Rate = (Customers Lost During Period / Customers at Start of Period) x 100
The critical detail most teams get wrong: "customers lost" means only customers who were active at the start of the period and then left. You don't include new customers acquired during the period in either the numerator or the denominator. Mixing new acquisitions into the base is the single most common error we see, and practitioners on r/SaaS flag it constantly.
Some fast-growing companies use an "adjusted" denominator - the average of start and end customers - to account for rapid growth. This is misleading. It dilutes the denominator with new accounts that haven't had time to churn, making retention look better than it is. Stick with the starting count.
Worked Example: Simple
You start January with 500 customers. By January 31, 50 have cancelled.
Churn rate = (50 / 500) x 100 = 10%
Clean, simple. But real life is messier.
Worked Example: Realistic SaaS
You start March with 1,200 customers. During March, you acquire 150 new customers. By March 31, 80 customers from the original 1,200 have cancelled, and 5 of the 150 new customers also cancelled.
The correct calculation uses only the starting cohort:
Churn rate = (80 / 1,200) x 100 = 6.67%
Not 85 / 1,350. Not 85 / 1,200. The 150 new customers and their 5 cancellations belong to a different cohort entirely. If you lump them in, you're diluting your denominator with fresh accounts and masking the real retention story of your existing base.
Revenue Churn Formulas
Logo churn tells you how many customers left. Revenue churn tells you how much it actually cost - and as you scale, revenue churn usually matters more. Losing ten $50/month accounts is a rounding error compared to losing one $50K/year enterprise contract.
Gross Revenue Churn (GRR)
GRR = (Churned MRR + Contraction MRR) / Starting MRR x 100
GRR only counts losses. It ignores expansion revenue entirely, which makes it the purest measure of how well you retain the revenue you already have. GRR falls between 0% and 100%.
Net Revenue Retention (NRR)
NRR = (Starting MRR - Churned MRR - Contraction MRR + Expansion MRR) / Starting MRR x 100
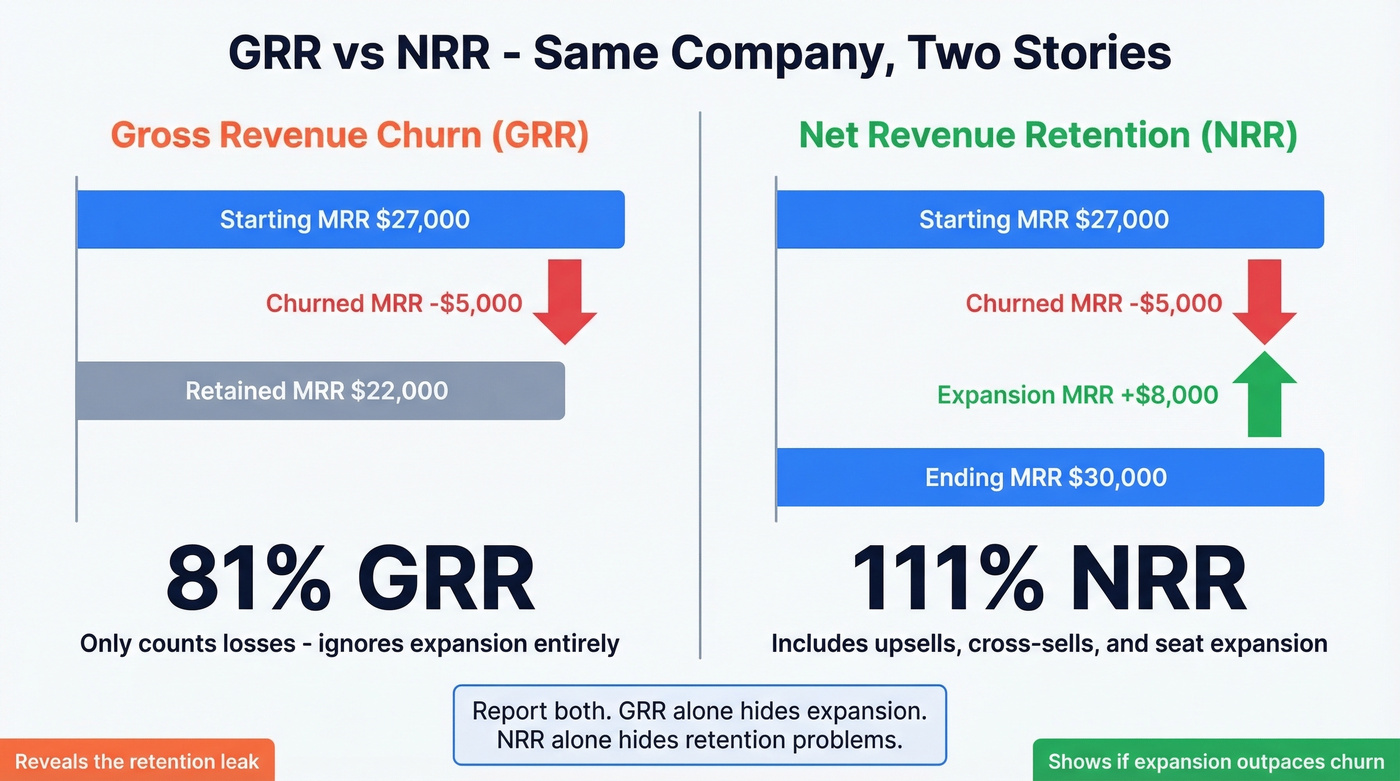
NRR includes upsells, cross-sells, and seat expansion from existing customers. This is the metric investors care about most, because NRR above 100% means your existing customer base is growing even without new logos. When boards ask about monthly recurring revenue churn, they typically want both the gross and net figures side by side. The gross number reveals the raw retention leak; the net number shows whether expansion is outpacing it.
GRR vs NRR Side by Side
A worked example makes this concrete:
| Metric | Amount |
|---|---|
| Starting MRR | $27,000 |
| Churned MRR | $5,000 |
| Contraction MRR | $0 |
| Expansion MRR | $8,000 |
| Ending MRR | $30,000 |
GRR = ($27,000 - $5,000) / $27,000 = 81%
NRR = ($27,000 - $5,000 + $8,000) / $27,000 = 111%
Same company, same month, two very different stories. GRR says you're losing nearly a fifth of your revenue base. NRR says your existing customers are actually growing. Both are true.
If you only report NRR, you're hiding a retention problem behind strong upsell motion. If you only report GRR, you're ignoring the expansion that's funding your growth. Strong SaaS companies typically run GRR above 90% and NRR above 110%. When GRR is very low, upsells won't fix the underlying retention leak.
Monthly to Annual Conversion
Annual Churn = 1 - (1 - Monthly Churn)^12
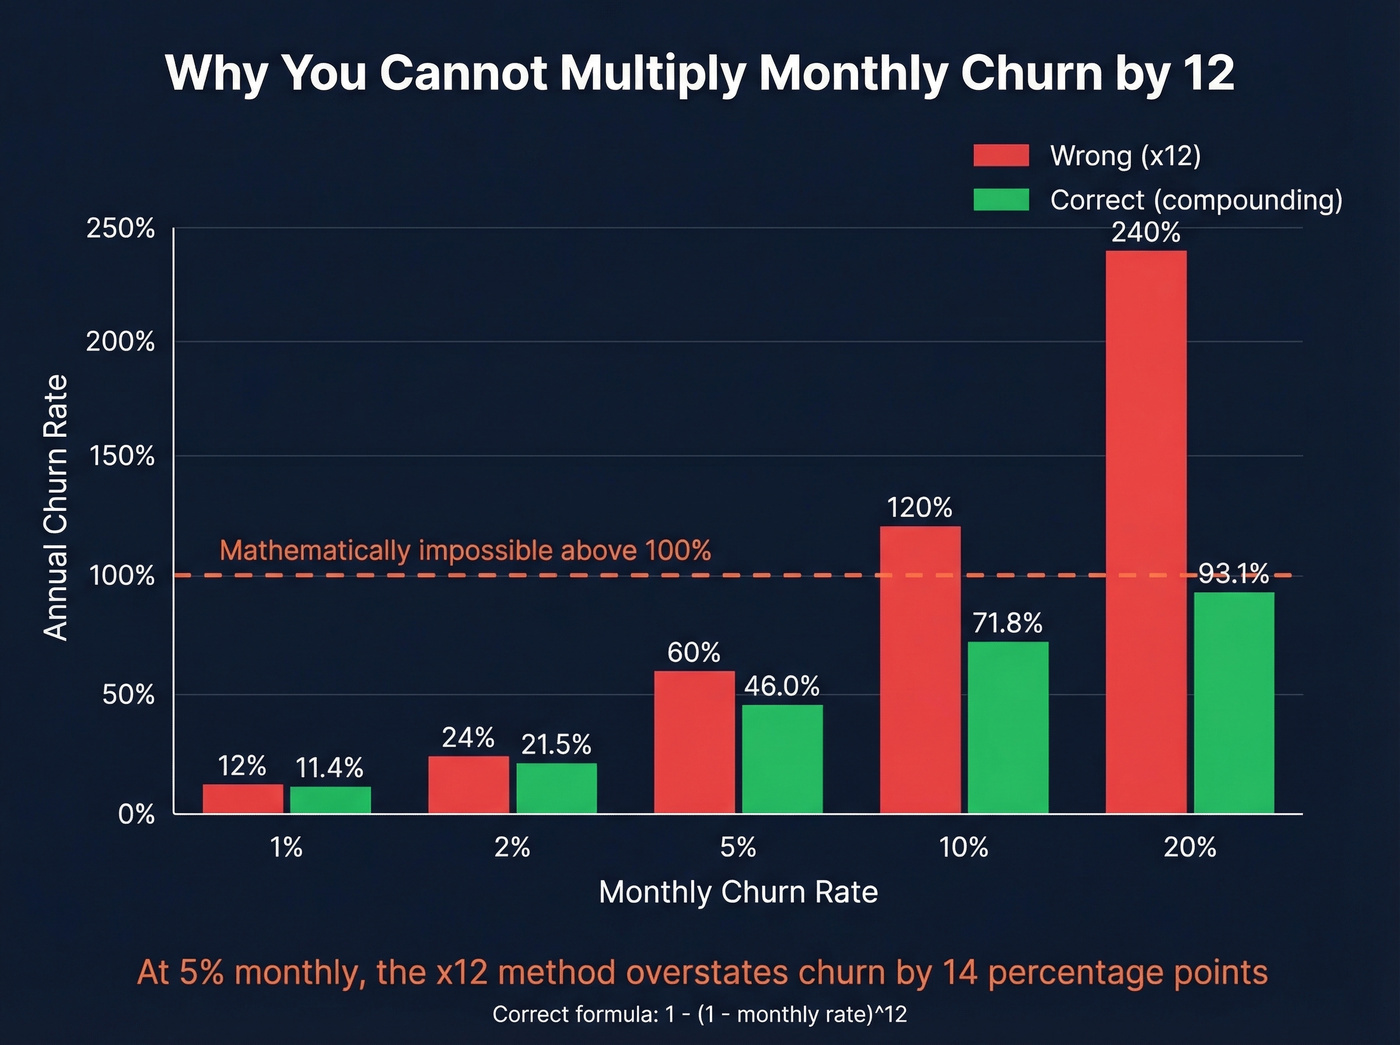
Do not multiply monthly churn by 12. This is wrong, and it gets more wrong the higher your rate. Churn compounds like exponential decay - each month's losses apply to a smaller surviving base.
The reverse formula, annual to monthly:
Monthly Churn = 1 - (1 - Annual Churn)^(1/12)
A conversion reference table worth bookmarking:
| Monthly Churn | Annual (x12 method) | Annual (correct) |
|---|---|---|
| 1% | 12% | 11.36% |
| 2% | 24% | 21.53% |
| 5% | 60% | 45.96% |
| 10% | 120% (impossible) | 71.76% |
| 20% | 240% (absurd) | 93.13% |
At 1% monthly, the difference is small. At 5%, you're off by 14 percentage points. At 10%, the multiply-by-12 method gives you a number above 100%, which is mathematically impossible for a rate. If someone on your team is multiplying by 12, fix it today.
Churn Rate vs Retention Rate
The relationship is simple:
Churn Rate = 1 - Retention Rate
But there's a subtlety worth flagging. Customer retention - accounts renewing their subscription - and user retention - individual users coming back to the product - are different metrics that move at different speeds. Pendo's benchmarks show that software products lose 70% of users within three months of first use. That's user retention, not subscription churn, but it's a leading indicator. If users stop logging in, the cancellation is coming. It's just a matter of how long the contract runs.
Tracking user retention alongside customer retention gives you a 30-90 day early warning system that pure churn metrics can't provide. Set your measurement frequency based on your product's natural usage interval: daily for high-frequency apps, weekly for tools used in periodic workflows.
Your churn rate formula is only useful if you're filling the top of the funnel with real contacts. Bad data means bounced emails, burned domains, and inflated acquisition costs that destroy your LTV:CAC ratio. Prospeo delivers 98% email accuracy with a 7-day refresh cycle - so every dollar you spend acquiring customers actually reaches a human.
Stop losing customers before they even see your first email.
From Churn to Customer Lifetime Value
Your churn calculation unlocks two of the most important metrics in SaaS finance: customer lifetime and CLV.
Customer Lifetime = 1 / Churn Rate
CLV = (ARPU x Gross Margin) x Customer Lifetime
Say your monthly churn rate is 2.5%.
Customer lifetime = 1 / 0.025 = 40 months (3.3 years)
Now assume ARPU of $200/month and 75% gross margin:
CLV = ($200 x 0.75) x 40 = $6,000
That $6,000 is the ceiling on what you should spend to acquire a customer and still make money. If your CAC is $4,000, you've got a 1.5x LTV:CAC ratio - tight, but workable. If your CAC is $7,000, you're underwater. (If you want to sanity-check your acquisition math, see CAC and subscriber acquisition cost.)
One thing to watch: some LTV calculators assume a default of 1.67% monthly (which translates to 18.3% annual) when actual data isn't available yet. If your real churn is higher, that default will overstate your LTV. Don't let an auto-calculated number drive your unit economics - plug in your actual rate.
SaaS Churn Benchmarks (2026)
Benchmarks are only useful if they're specific enough to be relevant. "Average SaaS churn is 5%" tells you nothing if you're selling infrastructure software to enterprises or email tools to SMBs.
By Vertical
| Vertical | Monthly | Annual |
|---|---|---|
| Infrastructure/DevOps | 1.8% | 19.8% |
| ERP | 2.1% | 22.9% |
| CRM | 2.4% | 25.6% |
| Cybersecurity | 2.6% | 27.8% |
| BI/Analytics | 3.2% | 32.8% |
| HR/Payroll | 3.5% | 35.9% |
| Collaboration | 4.1% | 40.7% |
| Finance/Accounting | 4.3% | 42.5% |
| Marketing Automation | 4.8% | 46.1% |
| Sales Enablement | 5.2% | 49.4% |
| Helpdesk | 5.6% | 52.1% |
| Project Management | 6.1% | 55.6% |
| E-commerce Enablement | 6.8% | 59.4% |
| CMS | 7.3% | 62.9% |
| Email/Comms Tools | 8.1% | 67.2% |
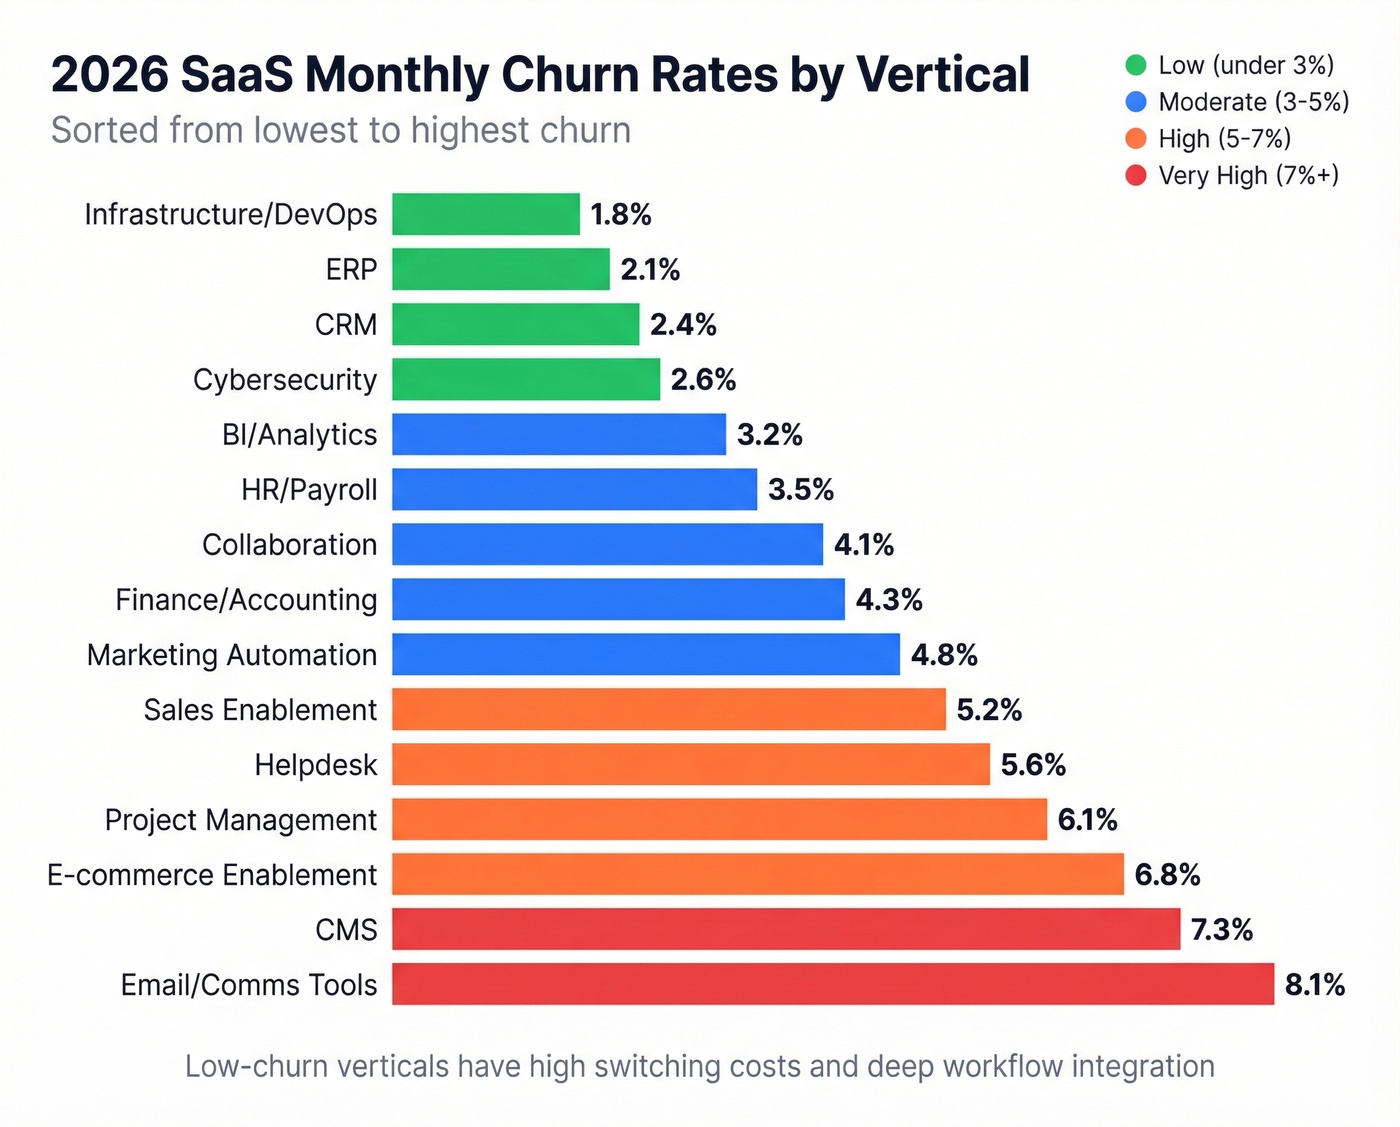
The spread is massive. Infrastructure and DevOps tools churn at 1.8% monthly because they're deeply embedded in workflows - ripping them out is painful. Email and communication tools churn at 8.1% because switching costs are low and alternatives are everywhere. Know your category before you benchmark.
By Company Stage
| Stage | Monthly | Annual |
|---|---|---|
| Pre-PMF (<$1M ARR) | 8.2% | 67.8% |
| Early ($1-5M) | 5.7% | 52.3% |
| Growth ($5-20M) | 3.9% | 39.1% |
| Scale-up ($20-50M) | 2.8% | 29.4% |
| Established ($50M+) | 1.9% | 21.0% |
Pre-PMF companies churning at 8% monthly isn't a crisis - it's expected. You're still figuring out who your customer is. But if you're at $20M ARR and still running 5%+ monthly, something structural is broken.
By Pricing Model
| Pricing Model | Monthly | Annual |
|---|---|---|
| Usage-based | 2.1% | 22.9% |
| Hybrid | 2.8% | 29.4% |
| Per-seat | 3.9% | 39.1% |
| Tiered flat | 4.2% | 41.8% |
| Single flat | 5.6% | 52.1% |
Usage-based pricing wins on retention because customers scale naturally - they don't hit a wall and cancel, they just use more or less. Single flat-rate pricing has the highest churn because there's no expansion path.
Cross-Industry B2B Benchmarks
SaaS isn't the only world where churn matters. CustomerGauge's B2B benchmarks show wide variation:
| Industry | Annual Churn |
|---|---|
| Energy/Utilities | 11% |
| IT Services | 12% |
| Computer Software | 14% |
| Industry Services | 17% |
| Financial Services | 19% |
| Professional Services | 27% |
Professional services at 27% annual churn makes sense - relationships are personal, and when a key contact leaves, the account often follows. Use these as context when your board compares your SaaS churn to "industry averages" without specifying which industry.
Voluntary vs Involuntary Churn
The median split across SaaS companies: 74% of churn is voluntary (customer chose to leave) and 26% is involuntary (payment failed). That 26% is the easiest win most companies ignore.
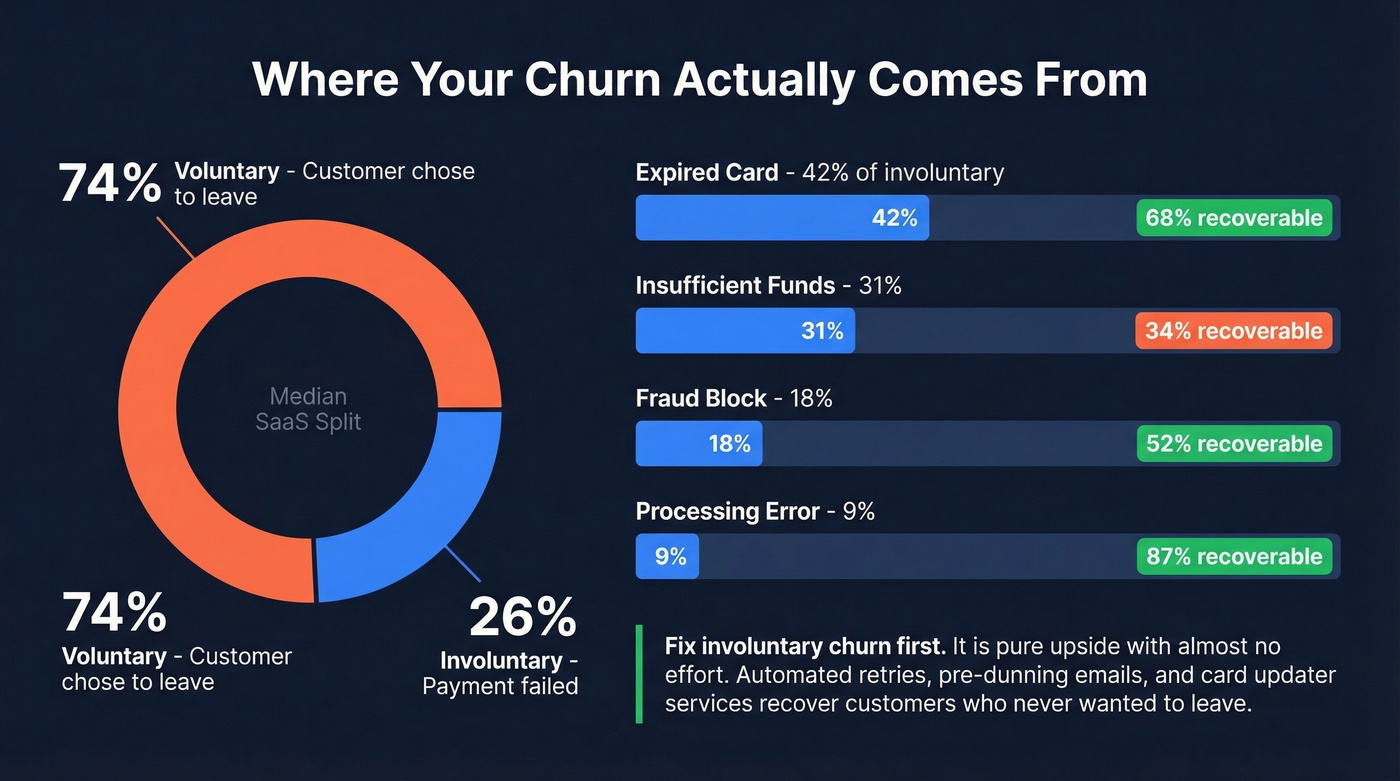
| Cause | % of Involuntary | Recovery Rate |
|---|---|---|
| Expired card | 42% | 68% |
| Insufficient funds | 31% | 34% |
| Fraud block | 18% | 52% |
| Processing error | 9% | 87% |
Look at those recovery rates. Expired cards - the single biggest cause of involuntary churn - recover at 68% with proper dunning. Processing errors recover at 87%. If you don't have automated retry logic, pre-dunning emails, and card updater services running, you're losing customers who never wanted to leave.
Fix involuntary churn before you spend a dollar on retention campaigns. It's pure upside with almost no effort.
Cohort-Based Churn Analysis
Aggregate churn is a vanity metric. It tells you the average temperature of the hospital, not which patients are dying.
SaaS Capital demonstrated that annual GRR can look like 87.5% while the monthly view reveals GRR was 100% through Q3 and then collapsed to 50% in Q4. The annual number hides a catastrophic quarter behind three good ones. Cohort analysis fixes this by grouping customers by when they signed up or what they did, then tracking each group's retention over time. (If you want the full framework, see our guide to churn analysis.)
| Cohort | Month 0 | Month 1 | Month 2 | Month 3 |
|---|---|---|---|---|
| January | 200 | 178 (89%) | 162 (81%) | 151 (76%) |
| February | 220 | 190 (86%) | 170 (77%) | 155 (70%) |
| March | 180 | 167 (93%) | 158 (88%) | 150 (83%) |
| April | 250 | 228 (91%) | 213 (85%) | - |
Reading this table, February's cohort is churning faster than every other month. That's a signal - maybe a campaign brought in wrong-fit customers, maybe onboarding was disrupted, maybe a pricing change hit. You'd never see this in an aggregate number.
We've seen teams discover that churn concentrates heavily in the first 90 days of a specific acquisition channel. That's not a retention problem - it's an acquisition quality problem. Cohorts make it visible.
Common Calculation Mistakes
1. Pulling from Stripe payment data with retries masking failures. Stripe retries failed payments automatically. If you're counting "active subscription" as "not churned," you're including accounts that have failed payment three times and are about to cancel. Build operational MRR tables instead of relying on payment processor status.
2. Including new customers in the denominator. If you started with 1,000 customers, acquired 200, and lost 80, your churn is 80 / 1,000 = 8%. Not 80 / 1,200 = 6.7%. The new customers haven't had time to churn yet.
3. Multiplying monthly churn by 12. Use the compounding formula. At 5% monthly, the difference between the wrong method (60%) and the right one (46%) is enormous.
4. Confusing cancellation with churn. A customer who cancels mid-annual-contract hasn't churned yet - they've signaled intent to leave, but the paid subscription term hasn't ended. Track cancellation date and churn date separately, or you'll mistime your retention interventions and miscount your active base.
5. Treating retention as 100% minus churn with mixed contract lengths. If you have a mix of monthly and annual contracts, a customer who's mid-annual-contract isn't "retained" - they just haven't hit their renewal window yet. Segment by contract type or measure at renewal points.
6. Reporting aggregate instead of cohort-based churn. Aggregate churn blends healthy cohorts with sick ones. It's the metric you show when you want to look good. Cohorts are the metric you use when you want to get better.
7. Compounding month-over-month instead of using month-over-year-ago-month. SaaS Capital recommends comparing each month's retention to the same month a year ago. Month-over-month compounding is extremely sensitive to seasonality. Trailing 3-, 6-, and 12-month averages smooth the noise.
Let's be honest: stop debating the perfect formula. Pick one, be consistent across your reporting, and focus on cohorts. The calculation matters far less than the discipline of measuring the same way every time.
How to Reduce Churn
Knowing your churn rate is step one. Reducing it means pulling four specific levers.
Fix involuntary churn first. This is the lowest-effort, highest-impact move. Implement smart retry logic, pre-dunning emails before cards expire, and automatic card updater services. With expired cards recovering at 68%, you're leaving money on the table every month you don't have this automated.
Improve onboarding. Software products lose 70% of users within three months. If users don't activate core features in the first two weeks, they're already on the path to cancellation. Map your activation milestones and build triggers around them.
Measure cohorts to find where churn concentrates. Don't treat attrition as a company-wide problem. It's almost always concentrated in specific cohorts, channels, or segments. Find the cluster, fix the cluster.
Fix acquisition quality. This is the lever most teams overlook entirely. When outbound teams work unverified contact lists, they reach wrong-fit buyers who close but churn within months. Bad prospect data creates a pipeline of customers who were never going to stick. Tools like Prospeo verify B2B emails at 98% accuracy on a 7-day refresh cycle, so your pipeline starts with the right people at the right companies. The connection between data quality and retention is direct: garbage in, churn out. (If you’re tightening list quality upstream, start with data enrichment services and lead enrichment.)
Here's the thing: most companies treat churn as a customer success problem. It's not. By the time CS gets involved, the damage is done. Churn is an acquisition quality problem first, an onboarding problem second, and a product problem third. CS is just holding the bag. Once you have clean data, predictive models can flag at-risk accounts before they cancel - but the model is only as good as the underlying calculation. (Related: B2B predictive analytics.)
If your CLV math depends on a $4,000 CAC, you can't afford to waste pipeline on unverified contacts. Prospeo's 300M+ verified profiles at ~$0.01/email mean lower acquisition costs and a healthier LTV:CAC ratio - the metrics that actually move the needle on net revenue retention.
Cut your CAC and let the churn math work in your favor.
FAQ
What's a good churn rate for SaaS?
Under 2% monthly or under 10% annual for most mid-market companies. Your vertical matters more than any universal benchmark - Infrastructure SaaS averages 1.8% monthly while Email/Comms tools average 8.1%. Compare against your category, not "all SaaS."
Should I track logo churn or revenue churn?
Both, but revenue churn matters more as you scale. GRR measures how well you retain existing revenue (target 90%+); NRR measures whether your customer base grows organically (target 110%+). Report both side by side in board decks.
How often should I measure churn?
Monthly, compared to the same month a year ago. This "month-over-year-ago-month" approach avoids seasonality distortion. Layer in 3-, 6-, and 12-month trailing averages to smooth noise and spot real trends.
Can churn rate be negative?
Net revenue churn can go negative when expansion revenue from upsells and seat growth exceeds losses. This is called "net negative churn" - NRR above 100% - and it means your existing base grows without adding new logos.
How does bad prospect data increase churn?
Unverified contact lists lead reps to wrong-fit buyers who close but cancel within months. When your outbound data is stale or inaccurate, you're filling the pipeline with accounts that were never going to stick - and your churn rate pays the price downstream.