Subscriber Acquisition Cost: The Practitioner's Guide With Actual Benchmarks
Every SAC article gives you the formula and tells you to "compare to industry benchmarks" - then provides zero benchmarks. You get a definition, a division sign, and a vague suggestion to "optimize your funnel." That's not useful when your CFO is asking why you spent $180k last quarter to add 400 subscribers.
Here are the actual subscriber acquisition cost numbers, the formulas that matter, and the tactical levers that move SAC in the real world.
What You Need (Quick Version)
- The formula and what to include: SAC = Total Sales & Marketing Costs / new subscribers acquired. Include everything - ad spend, salaries, commissions, tools, content production, agency fees, onboarding, and overhead allocation. Excluding costs understates your real SAC by 30-50%.
- Your industry benchmark: Jump to the benchmark tables below. B2B SaaS averages $239 blended, financial services hits $784, eCommerce runs $86.
- The metric that matters more: Gross-margin-adjusted payback period. It tells you when you earn back your SAC, not just what you spent.
Why Most Teams Get SAC Wrong
Marketing budgets dropped to 7.7% of revenue in 2024, and 63% of marketing leaders report increased CFO pressure to prove every dollar. The scrutiny is real. But when you go looking for SAC data, you find the same recycled formula and a suggestion to "benchmark against your industry" with no actual benchmarks attached.
The problem isn't that SAC is hard to calculate. It's that most teams calculate it wrong, compare it to nothing, and then make budget decisions based on a number that's missing half its inputs. You don't have a SAC problem - you have a measurement problem. And measurement problems compound: they distort channel allocation, inflate pipeline forecasts, and make your CFO trust marketing even less.
What Is Subscriber Acquisition Cost?
Subscriber acquisition cost is the total cost to acquire a single new subscriber in a recurring-revenue business. It captures every dollar your sales and marketing org spends to bring a subscriber onboard - ads, promotions, commissions, onboarding efforts, the works - divided by the number of new subscribers you actually landed in that period.
SAC and CAC get used interchangeably, but they shouldn't be. CAC is the umbrella term covering any customer acquisition in any business model. SAC is the precision instrument for subscription businesses: SaaS, telecom, streaming, newsletters, subscription eCommerce. If your revenue is recurring, SAC maps directly to your unit economics, payback period, and LTV calculations.
The distinction matters because subscription businesses have fundamentally different economics. A one-time purchase customer either pays off or doesn't. A subscriber pays off over time - which means SAC isn't just a cost metric, it's the starting point of a payback equation. Get SAC wrong, and every downstream calculation inherits the error.
How to Calculate SAC
The formula is simple. Getting the inputs right is where teams stumble.
SAC = Total Sales & Marketing Costs / New Subscribers Acquired
Both numbers must cover the same time period. Sounds obvious, but we've seen teams divide Q4 spend by full-year subscriber counts and wonder why their SAC looked impossibly low.
What to Include in "Total Costs"
- Advertising and media spend across paid search, paid social, display, and sponsorships
- Sales team salaries, commissions, and bonuses
- Marketing team salaries
- Software and tools - CRM, sequencing platforms, data providers, analytics
- Content production: blog, video, podcast, design
- Agency and contractor fees
- Onboarding costs tied to subscriber activation
- Proportional overhead allocation for office space, management time, and recruiting
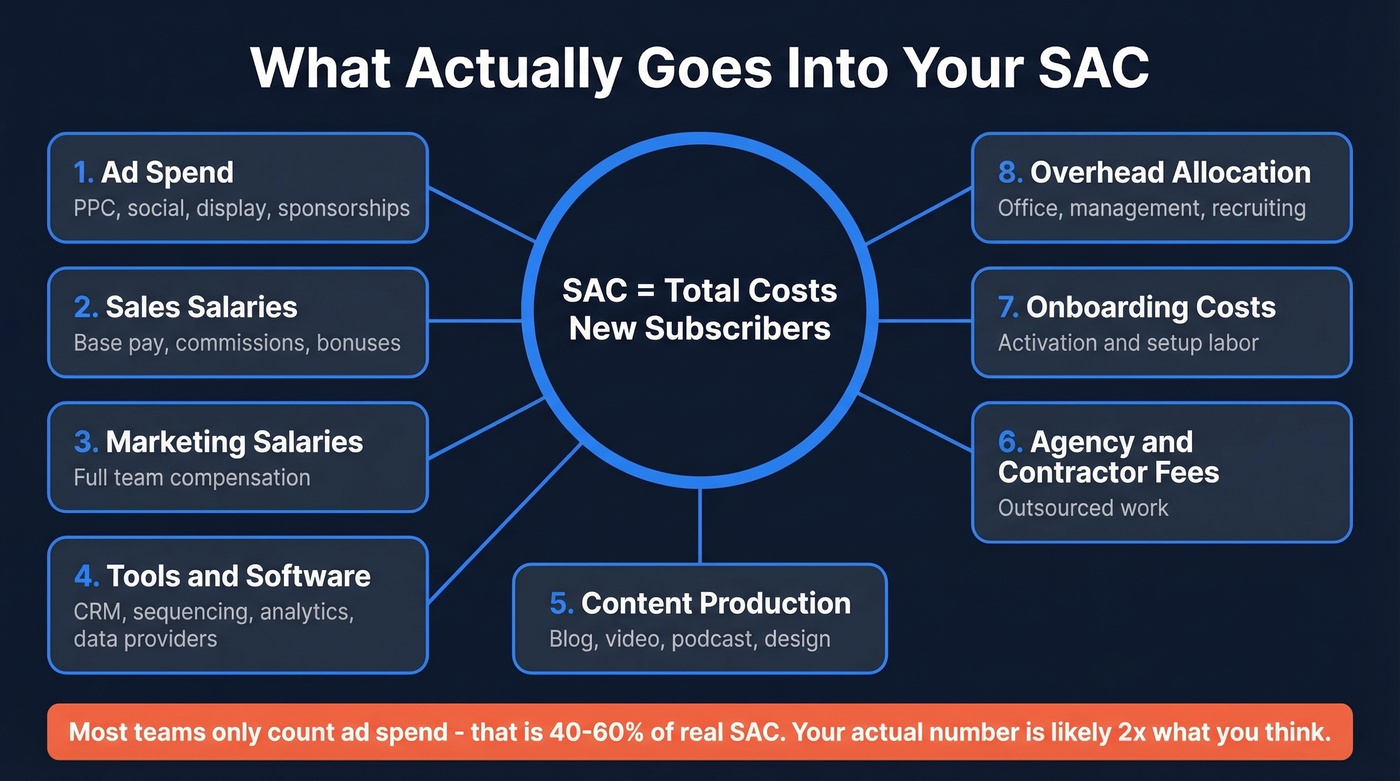
Excluding overhead and salaries is the most common error. Ad spend alone isn't your SAC - it's often 40-60% of it. The rest hides in payroll, tools, and agency invoices. We've found that real SAC is frequently 2x what teams initially report once salaries and overhead get added back in.
Worked Example
Your SaaS company spent $150,000 on sales and marketing in Q1. That breaks down to $60,000 in ad spend, $55,000 in sales salaries and commissions, $20,000 in tools and software, and $15,000 in content and agency fees. You acquired 500 new subscribers.
SAC = $150,000 / 500 = $300 per subscriber.
If you'd only counted ad spend, your SAC would've been $120 - less than half the real number. That's the gap that gets teams in trouble.
SAC Benchmarks That Actually Exist
Here's where most articles go silent. These are CAC figures from First Page Sage's analysis across 29 B2B industries, and for subscription businesses in these verticals, they're the closest thing to SAC benchmarks that exist at scale.
SAC by Industry
| Industry | Organic CAC | Inorganic CAC | Blended CAC |
|---|---|---|---|
| B2B SaaS | $164 | $463 | $239 |
| eCommerce | $58 | $168 | $86 |
| Financial Services | $555 | $1,472 | $784 |
| Cybersecurity | $266 | $750 | $387 |
| Construction | $193 | $545 | $281 |
| Manufacturing | $496 | $1,405 | $723 |
| Legal Services | $514 | $1,453 | $749 |
| Real Estate | $544 | $1,534 | $791 |
| IT & Services | $320 | $903 | $466 |
| Healthcare | $357 | $1,007 | $519 |
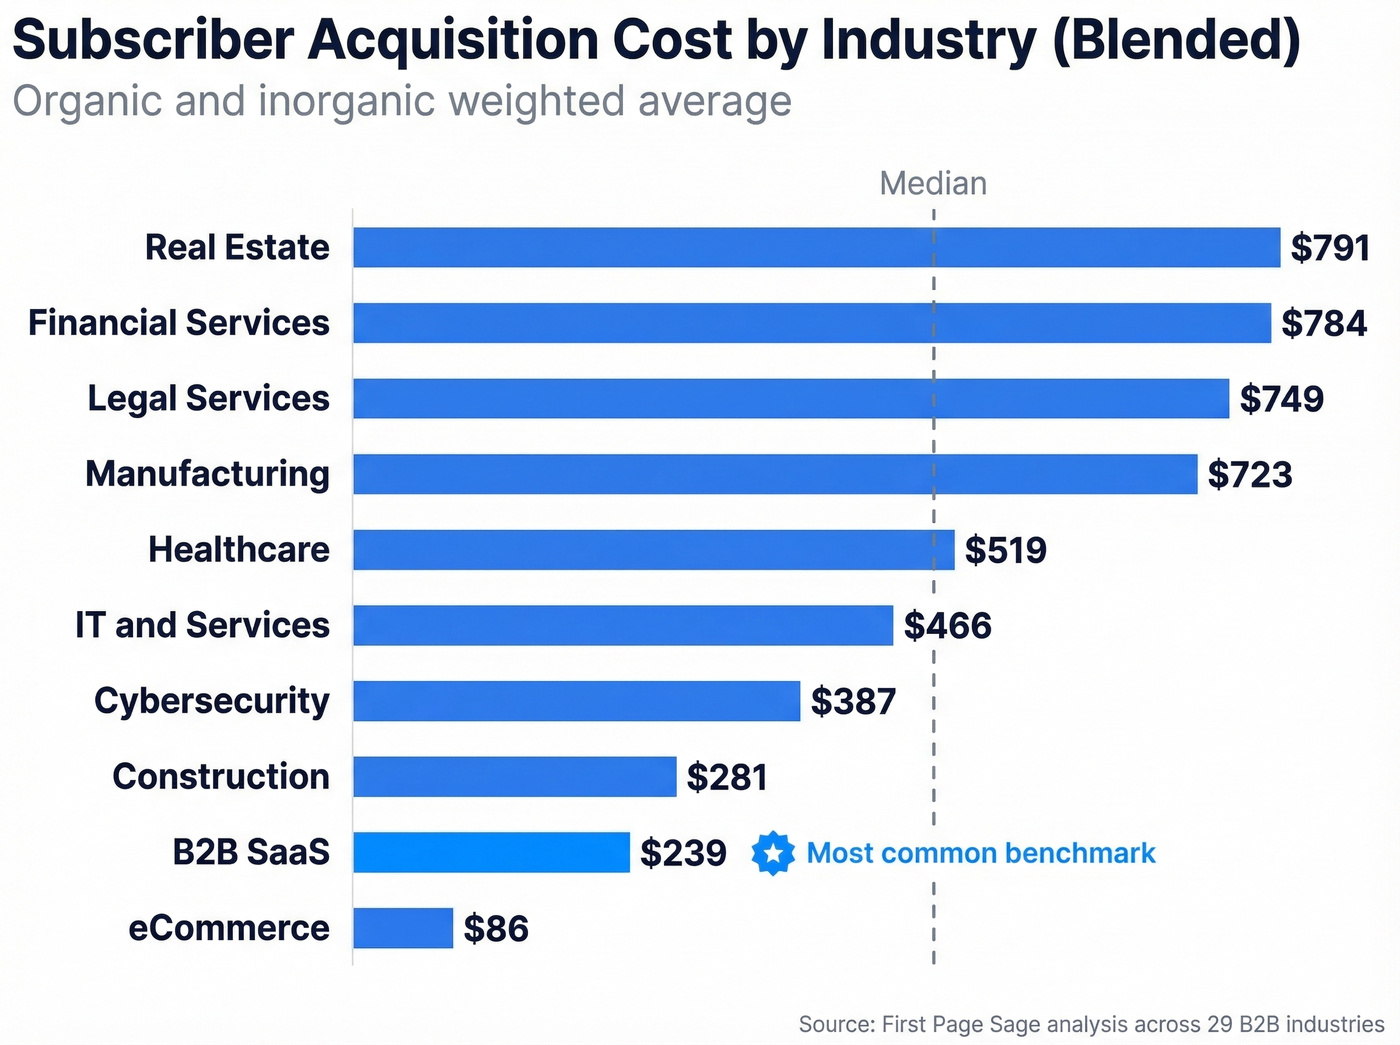
The gap between organic and inorganic is striking across every industry. Financial services pays about 2.7x more per inorganic acquisition than organic. That's not a rounding error - it's a strategic signal about where to invest.
A note on the blended column: these averages weight 75% organic and 25% inorganic, reflecting a content-heavy acquisition mix. If your split is closer to 50/50, your blended number will skew higher.
SAC by Company Size (SaaS)
Blended SAC is misleading because it hides the massive variance between selling to a 20-person startup and a Fortune 500.
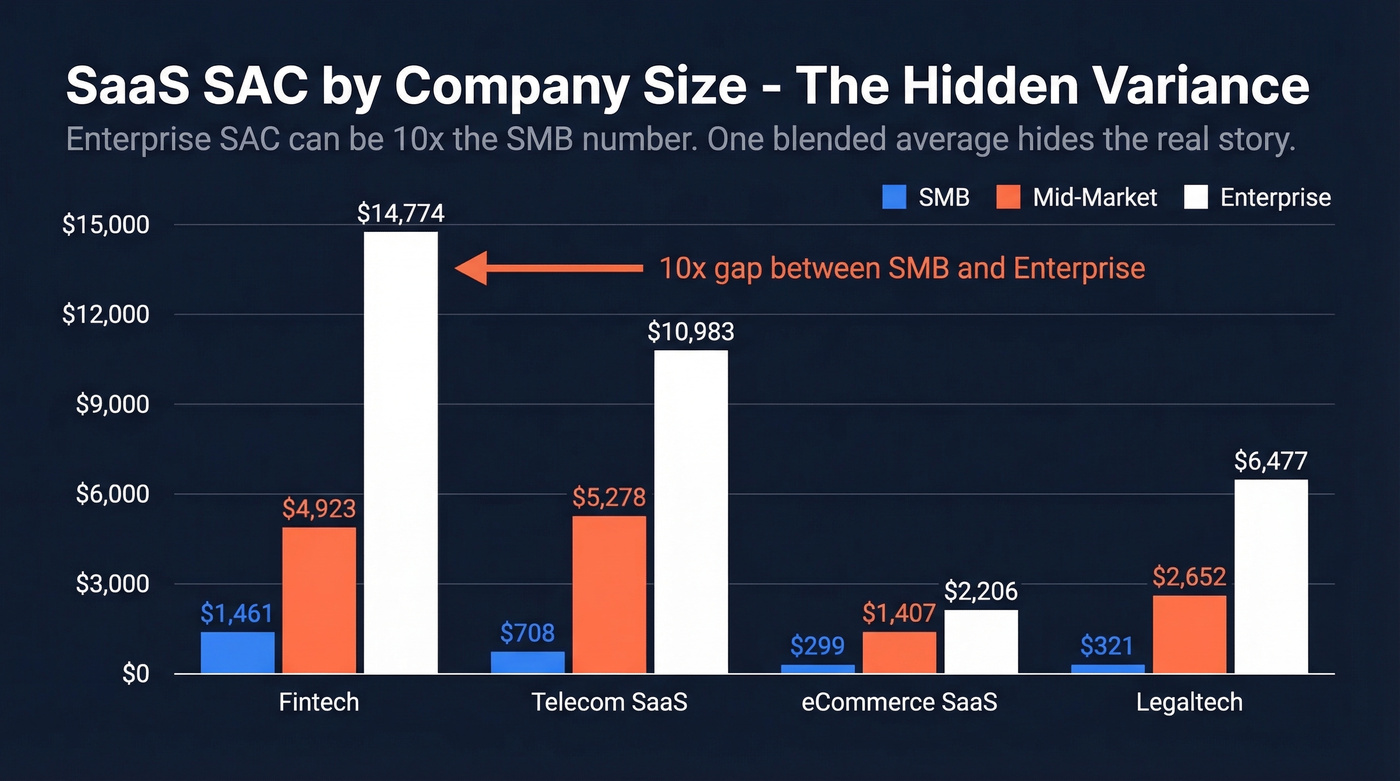
| SaaS Subindustry | SMB | Mid-Market | Enterprise |
|---|---|---|---|
| Fintech | $1,461 | $4,923 | $14,774 |
| Telecom SaaS | $708 | $5,278 | $10,983 |
| eCommerce SaaS | $299 | $1,407 | $2,206 |
| Legaltech | $321 | $2,652 | $6,477 |
Enterprise Fintech SAC is 10x the SMB number. If you're reporting a single blended SAC to your board, you're hiding the story. Segment by company size, or your "average" will mislead every decision it touches.
SAC by Channel
Channel-level SAC varies wildly depending on offer value and audience. Here's what we've seen across dozens of subscription businesses:
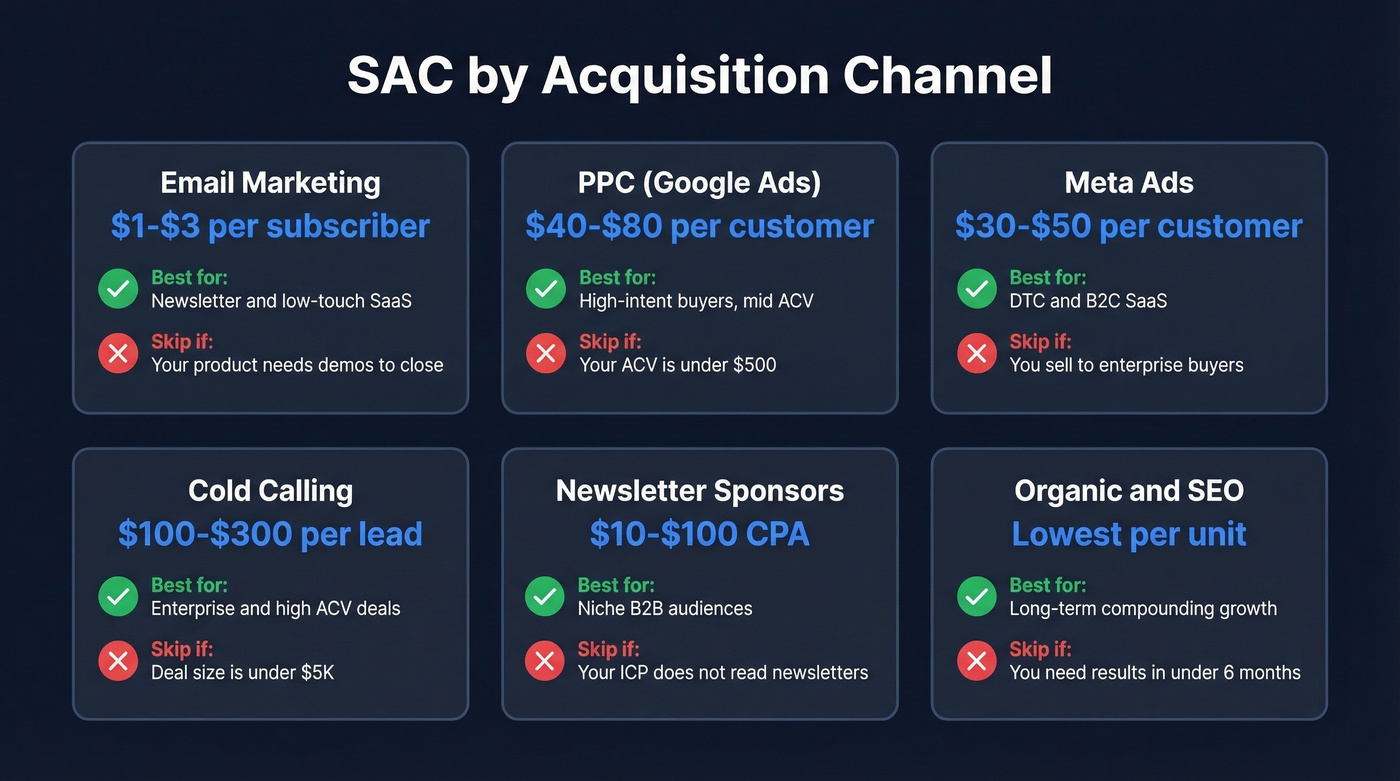
| Channel | Typical Cost | Best For | Skip If... |
|---|---|---|---|
| Email marketing | $1-$3/subscriber | Newsletter, low-touch SaaS | Your product requires demos to close |
| PPC (Google Ads) | $40-$80/customer | High-intent buyers, mid-ACV | Your ACV is under $500 |
| Meta ads | $30-$50/customer | DTC, B2C SaaS | You're selling to enterprise buyers |
| Cold calling | $100-$300/lead | Enterprise, high ACV | Your deal size is under $5K |
| Newsletter sponsors | $10-$100 CPA | Niche B2B audiences | Your ICP doesn't read newsletters |
| Organic/SEO | Lowest per unit | Long-term compounding | You need results in under 6 months |
For paid email and newsletter growth, $1-$5 per email subscriber is a common ballpark. The real insight is that most teams don't track SAC by channel at all - they calculate one blended number and call it a day.
Tools and data providers are 10-20% of your SAC denominator inputs. Switch to Prospeo at $0.01/email with 98% accuracy and you cut wasted spend on bounces, bad data, and re-verification. Teams using Prospeo see bounce rates drop from 35%+ to under 4%.
Cut your SAC by fixing the data line item first.
LTV:SAC Ratio (Overrated)
The standard benchmark is 3:1 - for every dollar you spend acquiring a subscriber, you should generate at least three dollars in lifetime value. Chargebee puts the lower boundary even higher at 3.9, arguing that anything below that signals trouble.
Here's the thing: LTV:SAC is a lagging indicator that requires mature retention data to calculate accurately. If you're pre-Series B, your churn curve hasn't stabilized. Your "lifetime" is a guess. A guess divided by a cost doesn't give you a strategy - it gives you a number that feels scientific but isn't.
The retention economics underneath LTV are real, though. Consider a SaaS company with $50 ARPU and 3% monthly churn. Reducing churn by just one percentage point extends average subscriber lifetime from 33 months to 50 months - that's $850 more LTV per subscriber without spending a single acquisition dollar. Small churn improvements have outsized impact on the ratio, which is exactly why most teams should obsess over retention before they optimize acquisition spend.
LTV:SAC works as a board-level health check once you have 18+ months of cohort data. Before that, payback period is the metric that actually keeps you alive.
SAC Payback Period: The Survival Metric
Payback period answers the question your CFO actually cares about: how many months until we earn back what we spent to acquire this subscriber?
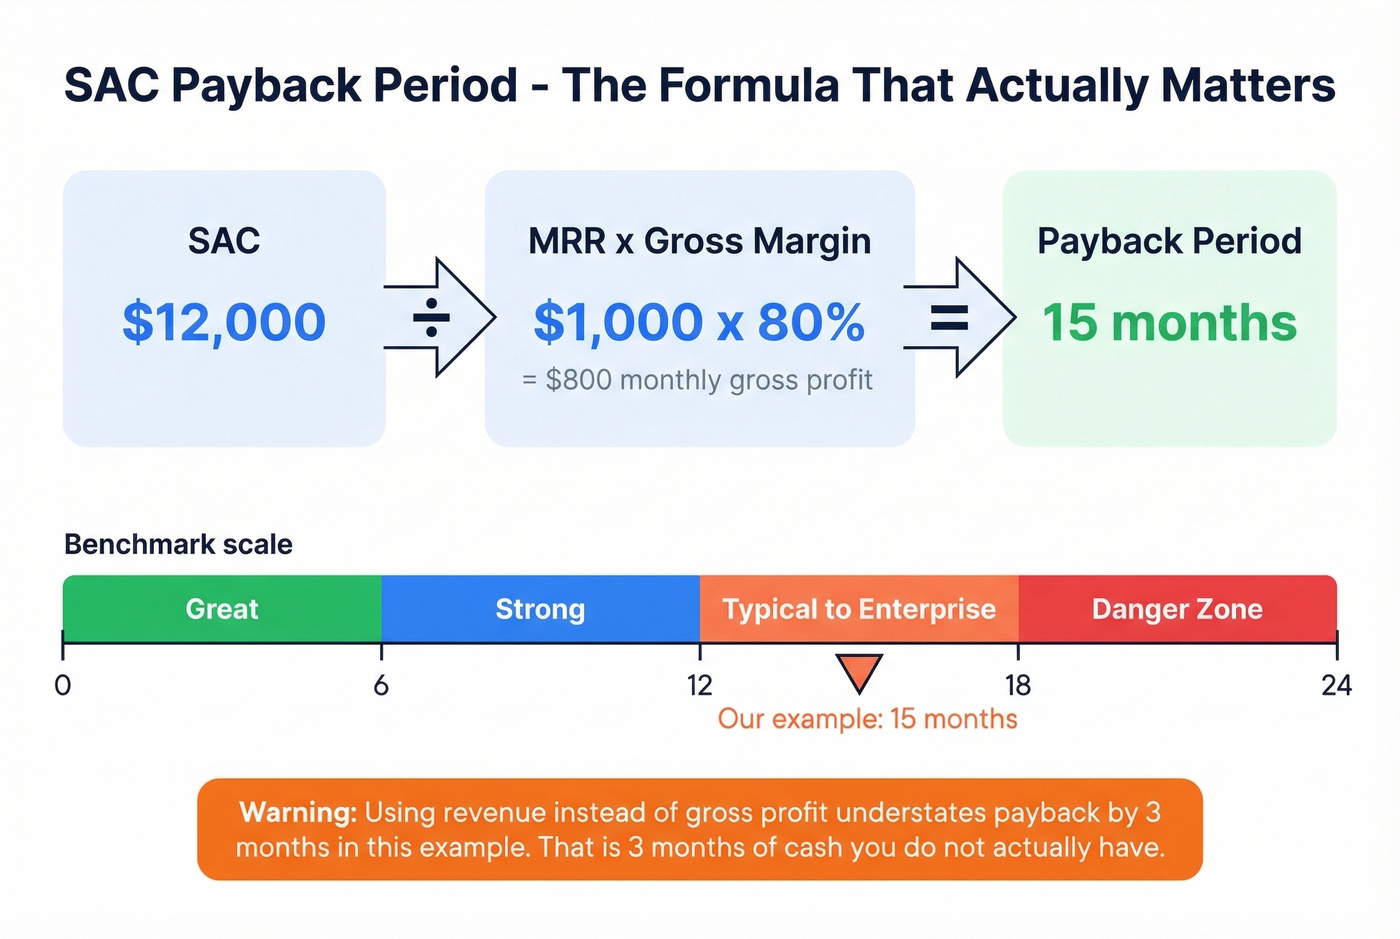
Payback Period = SAC / (MRR x Gross Margin %)
The gross margin adjustment is critical. Revenue isn't profit. If you're running 80% gross margins, only 80 cents of every MRR dollar goes toward paying back your acquisition cost.
Worked Example
Your SAC is $12,000. Monthly recurring revenue per subscriber is $1,000. Gross margin is 80%.
Payback = $12,000 / ($1,000 x 0.80) = 15 months.
If you'd used revenue instead of gross profit, you'd calculate 12 months - and you'd be lying to yourself by three months. That's three months of cash you don't actually have.
Benchmark Ranges
Most SaaS companies land in the 8-15 month range. Here's how the benchmarks break down:
- Great: 0-6 months
- Strong: Under 12 months
- Typical: 8.6-15 months
- Enterprise (acceptable): 12-18 months
For cash-constrained businesses - which is most startups - payback period matters more than LTV:SAC because it tells you whether you'll survive long enough to see the lifetime value materialize. A 5:1 LTV:SAC ratio means nothing if your payback is 24 months and you have 12 months of runway.
Let's be honest: if your annual contract value is under $10K, you probably don't need enterprise sales motions. Your SAC should be under $500, your payback under 6 months, and your acquisition channels should be overwhelmingly self-serve. The companies we see blowing up their SAC are the ones running enterprise playbooks against SMB deal sizes.
How to Measure SAC Accurately
Your CFO just asked for SAC by channel. You've only ever calculated a blended number. Now what?
The answer is attribution, and single-touch attribution systematically distorts SAC by over-crediting one channel and under-crediting everything else. HubSpot's 2025 State of Marketing report found that 75% of companies now use multi-touch attribution. The U-shaped model is the most common starting point: 40% credit to first touch, 40% to last touch, 20% split across middle interactions. Multi-touch attribution is associated with 15-30% efficiency gains because you can finally see which channels drive conversions versus which ones just touch prospects who would've converted anyway.
In our experience, the three most common measurement errors that inflate SAC are misaligned timeframes, excluding overhead and salaries, and ignoring conversion lag from free trials and freemium tiers. If someone signs up for a free trial in March and converts in May, the acquisition cost belongs in March's cohort, not May's.
If you want a clean way to map spend to outcomes, start by defining your funnel metrics and then layer in multi-touch attribution.
How to Reduce Subscriber Acquisition Cost
Targeting and Segmentation
Broad targeting is the fastest way to burn acquisition budget. Circles.Life ran a microsegmentation campaign that produced a 61% higher email click rate and 102% higher push notification open rate compared to their standard campaigns. That's not incremental - it's a step-change in acquisition efficiency.
The practical move: calculate SAC by channel and by audience segment, then kill the underperformers. Most teams discover that 2-3 channels drive 80% of their efficient acquisitions, and the rest just drag the blended number down.
If you need a repeatable way to define segments, use an Ideal Customer Profile and score leads consistently.
Digital-First Acquisition
Virgin Mobile KSA launched with a fully digital model - no physical stores, no retail partnerships - and achieved 25% lower SAC versus the prepaid industry average. T-Mobile integrated AI into their order management systems and reduced order fallouts by 95%, removing friction that was killing conversions after prospects had already decided to buy.
The lesson isn't "go digital." It's that acquisition friction is invisible SAC inflation. Every form field, every manual approval step, every broken checkout flow is money you already spent to get the prospect there - wasted.
Content, Referrals, and PLG
Look at the benchmark table again. Organic CAC is dramatically lower than inorganic across every single industry. B2B SaaS organic is $164 versus $463 inorganic. Financial services: $555 versus $1,472. The gap is consistent and massive.
Referral programs and product-led growth work as SAC multipliers because they convert existing subscribers into acquisition channels. Your cost to acquire a referred subscriber can be close to zero - the referring subscriber already did the selling. In the best case, you achieve "negative SAC," where the revenue from a referred subscriber's first payment exceeds the referral incentive cost, making the acquisition net-profitable from day one.
If you're building the organic engine, treat it like a system: B2B content marketing plus consistent measurement, not random posts.
Data Quality - The Silent SAC Killer
Your outbound team sent 10,000 emails last month. 2,200 bounced. That's 22% of your acquisition budget on fire - consumed SDR hours, burned sender reputation, wasted sequence spend, and zero pipeline to show for it.
Bad contact data is the most overlooked SAC inflator because it doesn't show up as a line item. It hides inside your existing spend, making every channel look less efficient than it actually is. One Prospeo customer, Snyk, saw bounce rates drop from 35-40% to under 5% and AE-sourced pipeline jump 180% after cleaning up their data layer. That's the kind of SAC impact that comes from fixing inputs, not campaigns.
If bounces are a recurring issue, track your email bounce rate and fix deliverability before scaling volume.
Tools for Tracking and Optimizing SAC
CRM and analytics: HubSpot CRM or Salesforce for tracking subscriber acquisition sources and costs. Plans typically start around $25/user/month.
Subscription billing: Chargebee (starts around $249/month) or Stripe Billing for subscriber lifecycle data, MRR tracking, and churn metrics that feed your payback calculations.
Analytics dashboards: Databox (starts around $47/month), Baremetrics (starts around $108/month), or ProfitWell for visualizing SAC trends, cohort payback, and LTV:SAC ratios over time.
Data quality: Prospeo sits upstream of your CRM with a free tier of 75 emails/month and paid usage around $0.01/email. With 143M+ verified emails and a 92% API match rate, it ensures contacts entering the funnel are real - clean data in means accurate SAC out. If you're evaluating vendors, start with a shortlist of data enrichment services.
If you're running outbound, your stack matters as much as your copy - especially your SDR tools and sequencing workflow.
Enterprise SAC hits $14K+ because reps waste hours chasing wrong contacts. Prospeo's 125M+ verified mobiles deliver a 30% pickup rate - 3x the industry average. More conversations per dollar spent means your SAC payback period shrinks fast.
Every direct dial that connects is SAC dollars earned back faster.
FAQ
What's a good subscriber acquisition cost?
B2B SaaS averages $239 blended, financial services hits $784, and eCommerce runs $86. The raw number matters less than your LTV:SAC ratio (aim for 3:1+) and payback period (under 12 months is strong for most subscription models).
How is SAC different from CAC?
CAC covers customer acquisition in any business model. SAC is subscription-specific, counting only recurring subscribers. It's more precise for SaaS, telecom, and streaming because it maps directly to MRR, churn cohorts, and payback calculations.
What costs should I include in SAC?
Everything tied to acquisition: ad spend, sales salaries, commissions, marketing tools, content production, agency fees, onboarding, and proportional overhead. Teams that only count ad spend typically understate real SAC by 30-50%.
How do I lower SAC without cutting budget?
Segment SAC by channel and persona, then reallocate toward your most efficient channels. Shift investment toward organic content and referrals. Verify contact data before outbound campaigns - bounced emails silently inflate your cost per subscriber, and fixing that alone can drop effective SAC by around 20%.
Should I prioritize SAC or payback period?
Payback period is more actionable for early-stage companies. SAC tells you what you spent; payback tells you when you earn it back. If you're cash-constrained, payback period determines whether you survive long enough to see your LTV materialize. Track both, but optimize for payback first.